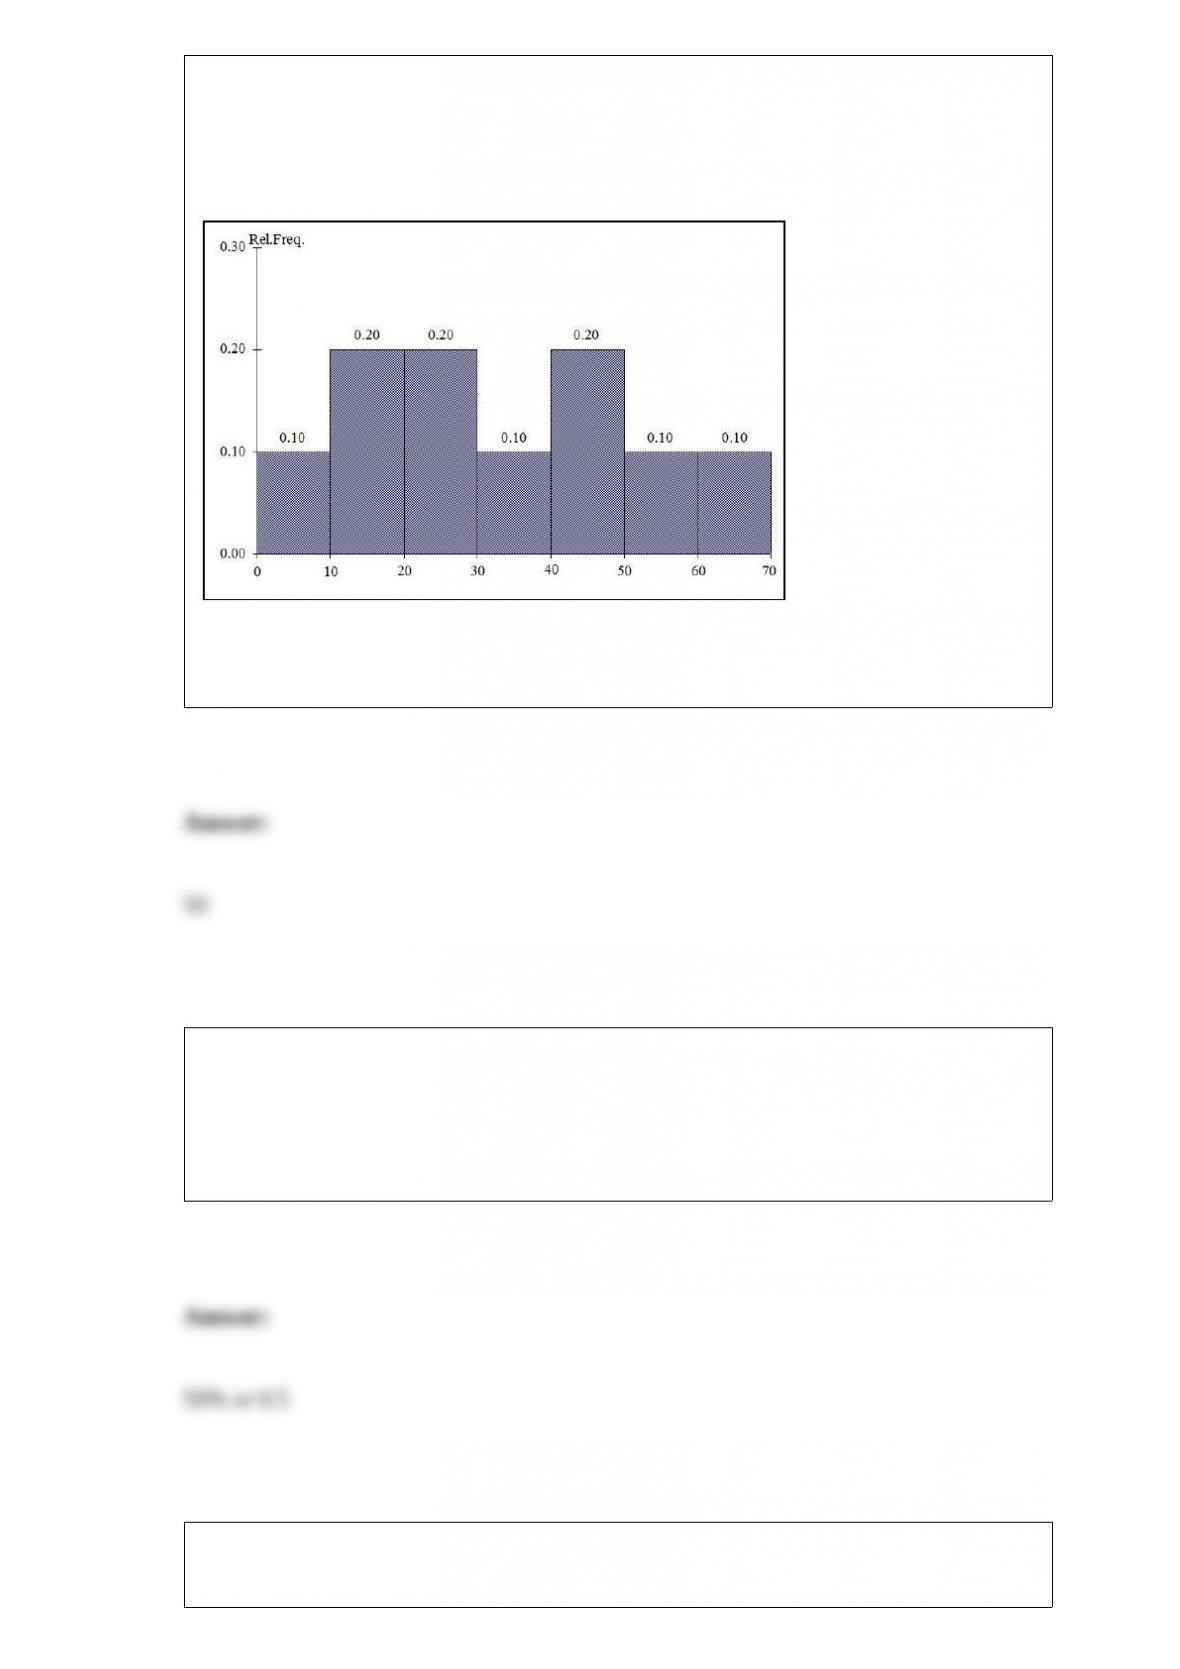
TABLE 2-10
The histogram below represents scores achieved by 200 job applicants on a personality
profile.
Referring to the histogram from Table 2-10, ________ percent of the applicants scored
below 20 or at least 50.
The owner of a fish market determined that the average weight for a catfish is 3.2
pounds. He also knew that the probability of a randomly selected catfish that would
weigh more than 3.8 pounds is 20% and the probability that a randomly selected catfish
that would weigh less than 2.8 pounds is 30%. The probability that a randomly selected
catfish will weigh between 2.6 and 3.6 pounds is ________.
TABLE 17-3
A financial analyst wanted to examine the relationship between salary (in $1,000) and 4
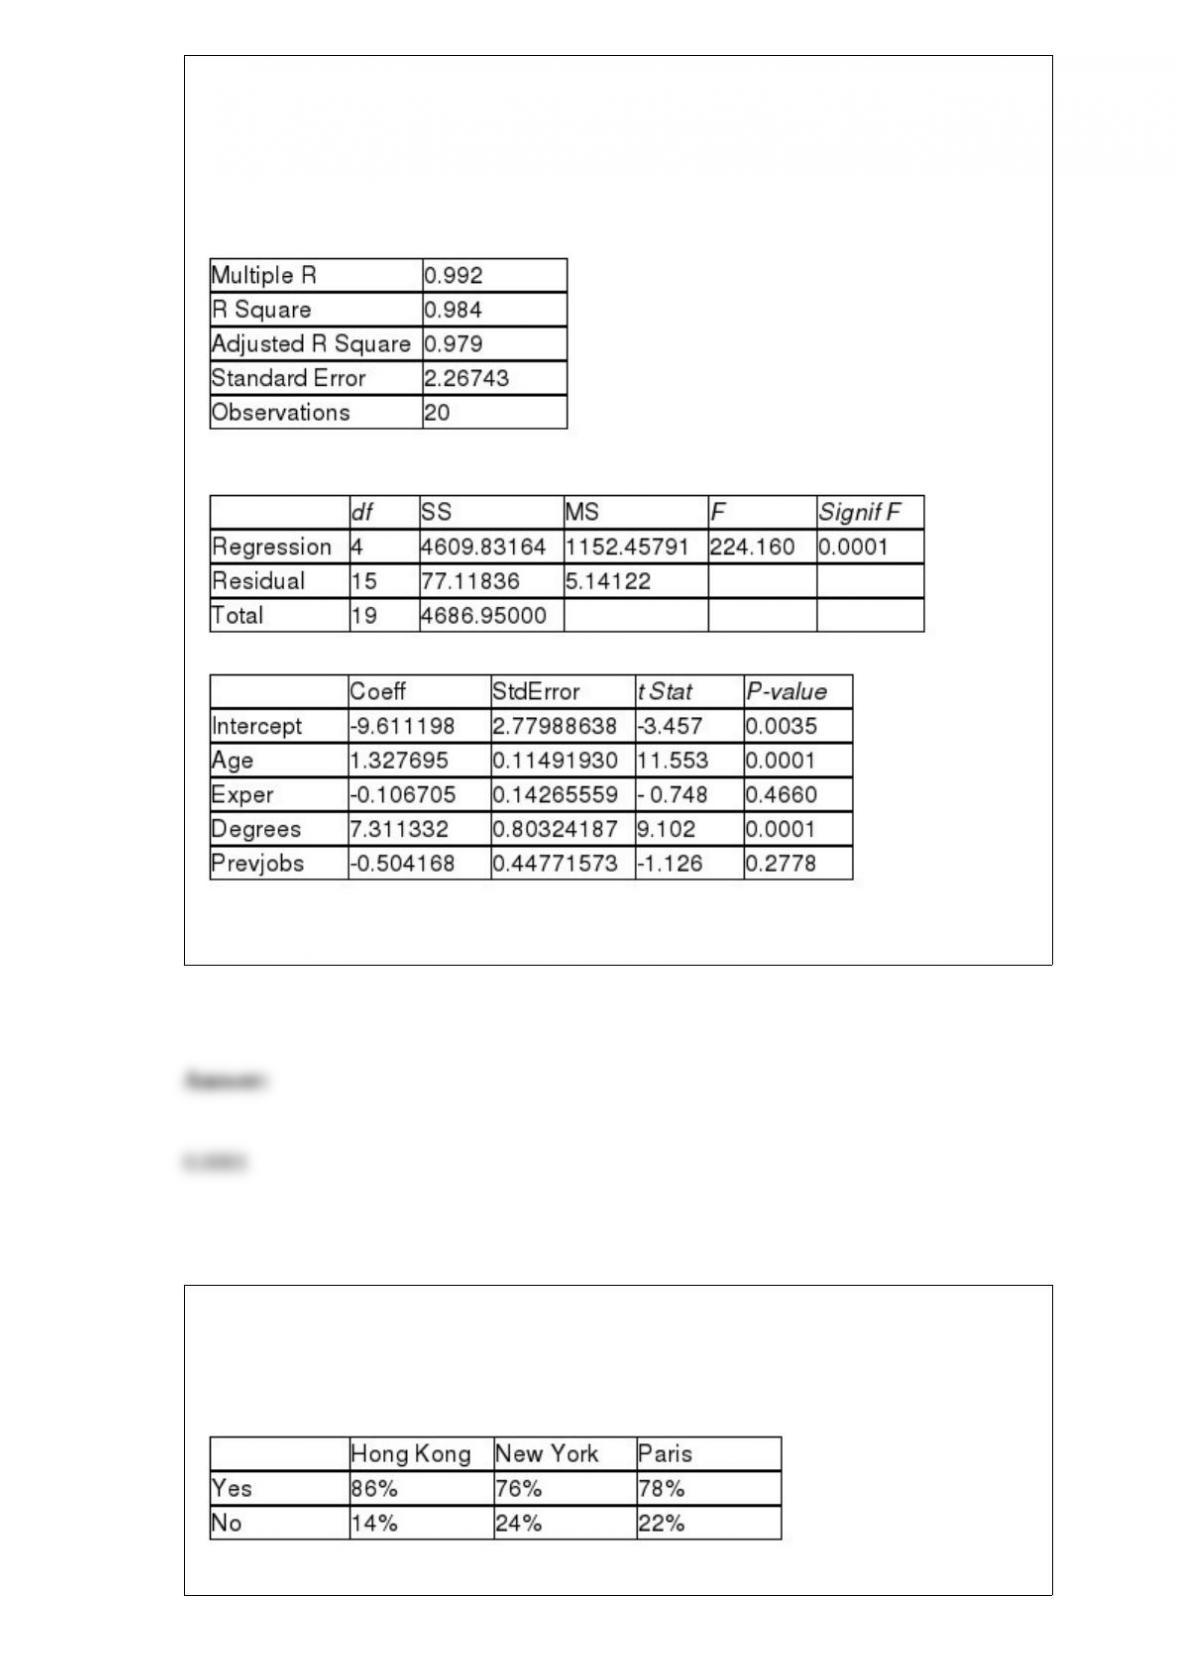
variables: age (X1 = Age), experience in the field (X2 = Exper), number of degrees (X3 =
Degrees), and number of previous jobs in the field (X4 = Prevjobs). He took a sample of
20 employees and obtained the following Microsoft Excel output:
SUMMARY OUTPUT
Regression Statistics
ANOVA
Referring to Table 17-3, the p-value of the F test for the significance of the entire
regression is ________.
TABLE 12-7
Data on the percentage of 200 hotels in each of the three large cities across the world on
whether minibar charges are correctly posted at checkout are given below.
At the 0.05 level of significance, you want to know if there is evidence of a difference
in the proportion of hotels that correctly post minibar charges among the three cities.
Referring to Table 12-7, the expected cell frequency for the Paris/No cell is ________.
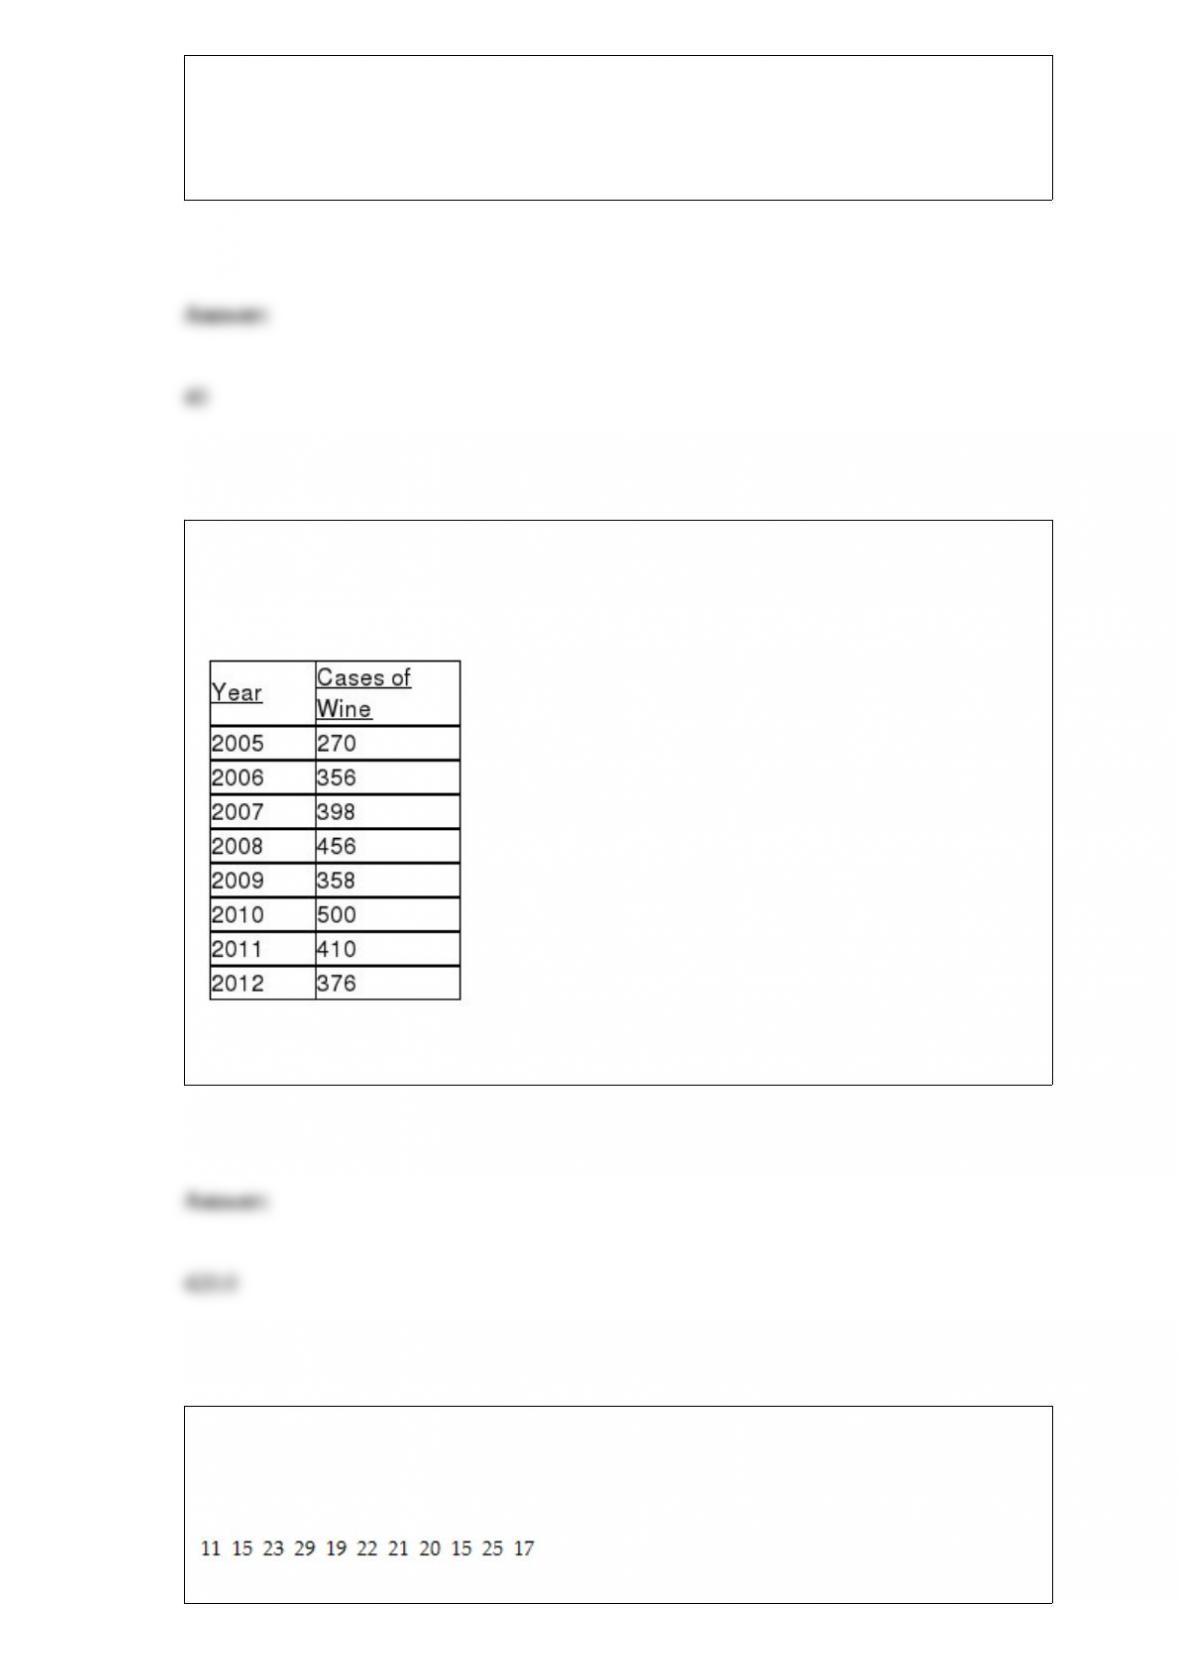
TABLE 16-4
The number of cases of merlot wine sold by a Paso Robles winery in an 8-year period
follows.
Referring to Table 16-4, a centered 5-year moving average is to be constructed for the
wine sales. The moving average for 2010 is ________.
TABLE 3-2
The data below represent the amount of grams of carbohydrates in a serving of
breakfast cereal in a sample of 11 different servings.

Referring to Table 3-2, the third quartile of the carbohydrate amounts is ________
grams.