
True or False: The amount of coffee consumed by an individual in a day is an example
of a discrete numerical variable.
True or False: A Walmart store in a small town monitors customer complaints and
organizes these complaints into six distinct categories. Over the past year, suppose the
company has received 534 complaints. One possible graphical method for representing
these data would be a Pareto chart.
TABLE 8-7
A hotel chain wants to estimate the mean number of rooms rented daily in a given
month. The population of rooms rented daily is assumed to be normally distributed for
each month with a standard deviation of 240 rooms. During February, a sample of 25
days has a sample mean of 370 rooms.
True or False: Referring to Table 8-7, it is possible that the 99% confidence interval
calculated from the data will not contain the sample mean number of rooms rented daily
in a given month.
True or False: If a time series does not exhibit a long-term trend, the method of
exponential smoothing may be used to obtain short-term predictions about the future.
True or False: The A in the DCOVA framework stands for “apply.”
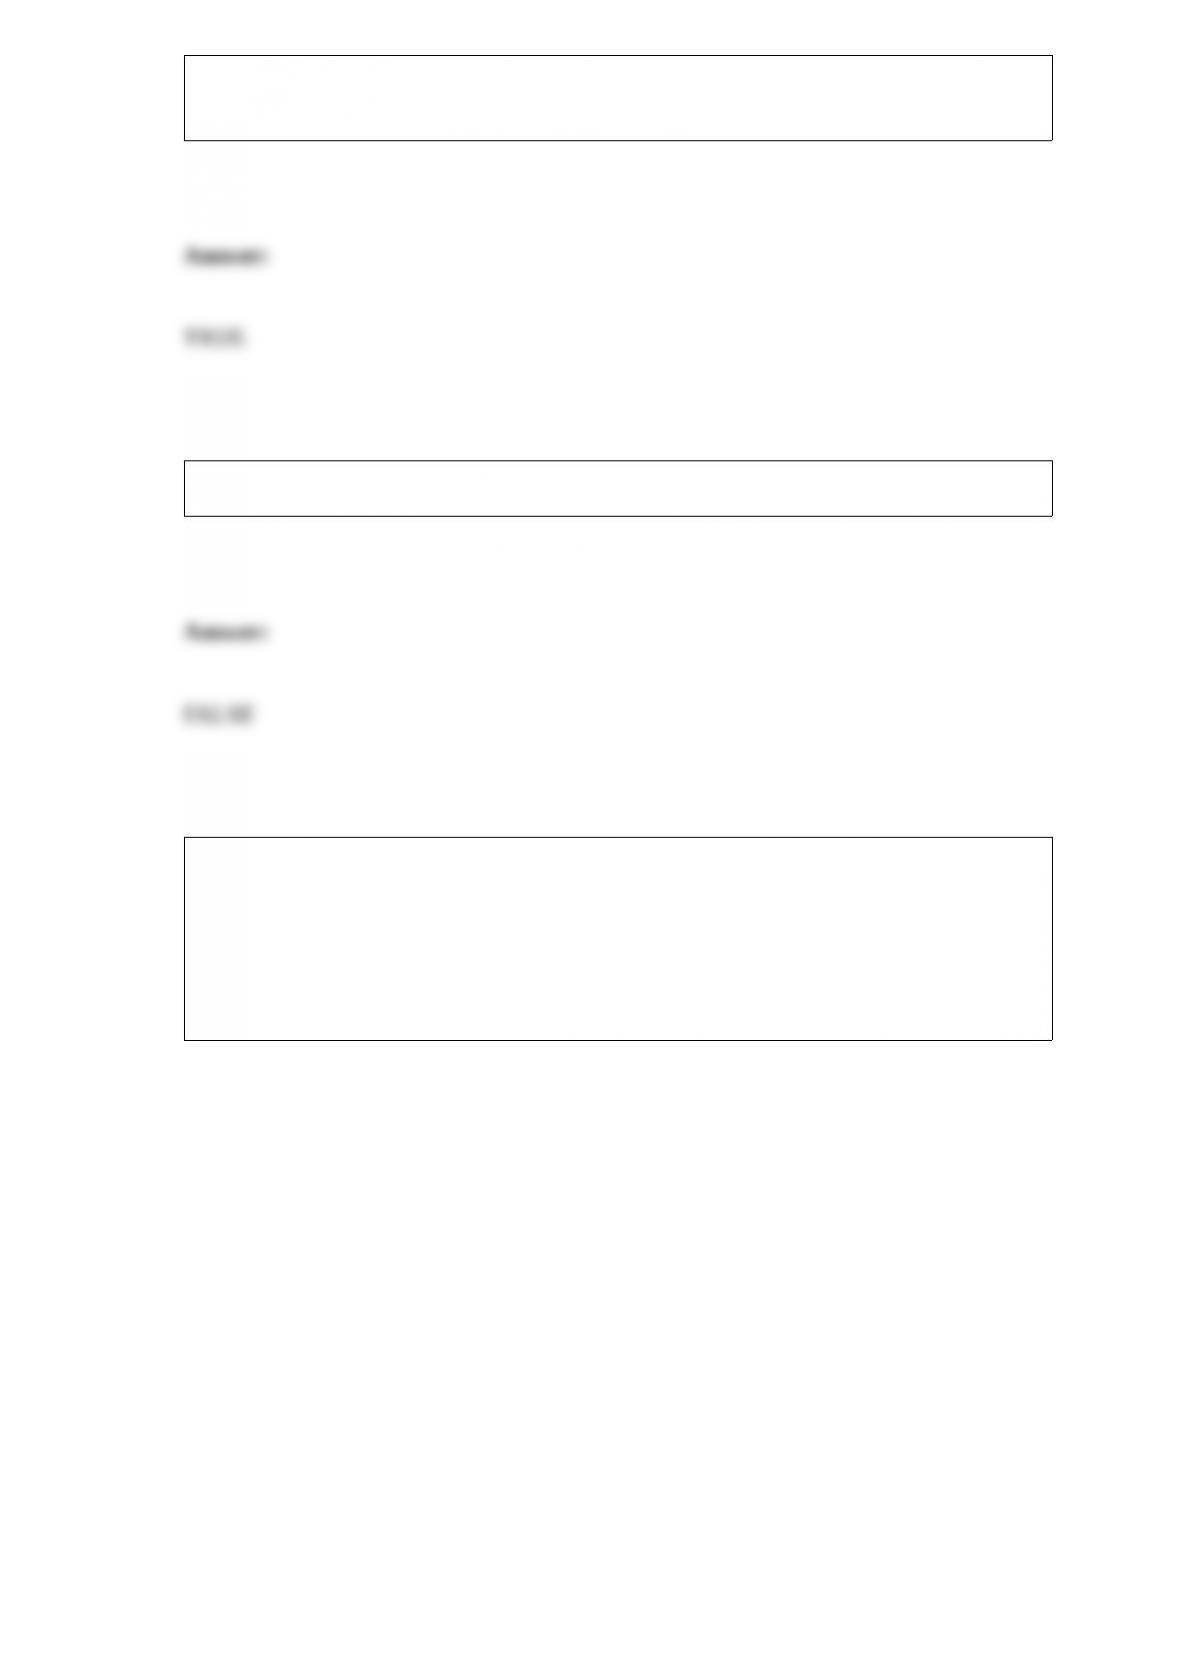
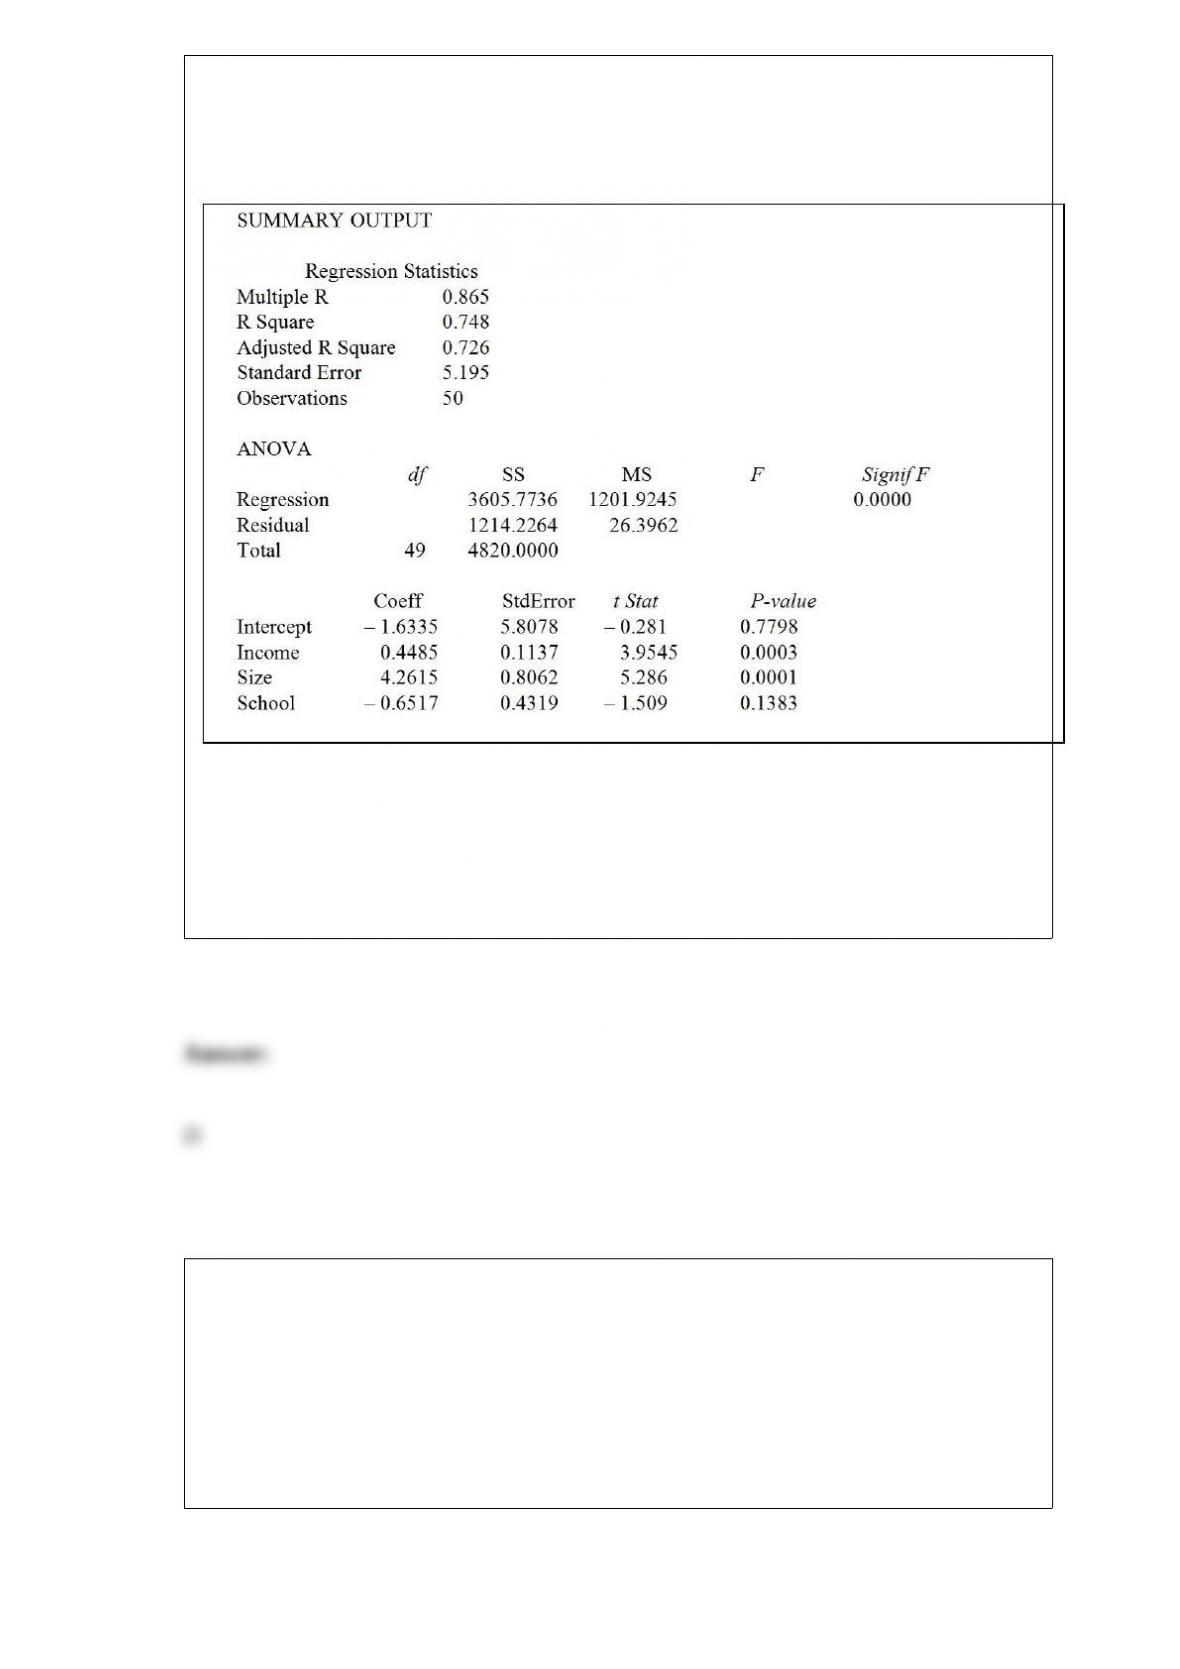
TABLE 17-1
A real estate builder wishes to determine how house size (House) is influenced by
family income (Income), family size (Size), and education of the head of household
(School). House size is measured in hundreds of square feet, income is measured in
thousands of dollars, and education is in years. The builder randomly selected 50
families and ran the multiple regression. Microsoft Excel output is provided below:
Referring to Table 17-1, which of the following values for the level of significance is
the smallest for which at least two explanatory variables are significant individually?
A) 0.01
B) 0.025
C) 0.05
D) 0.15
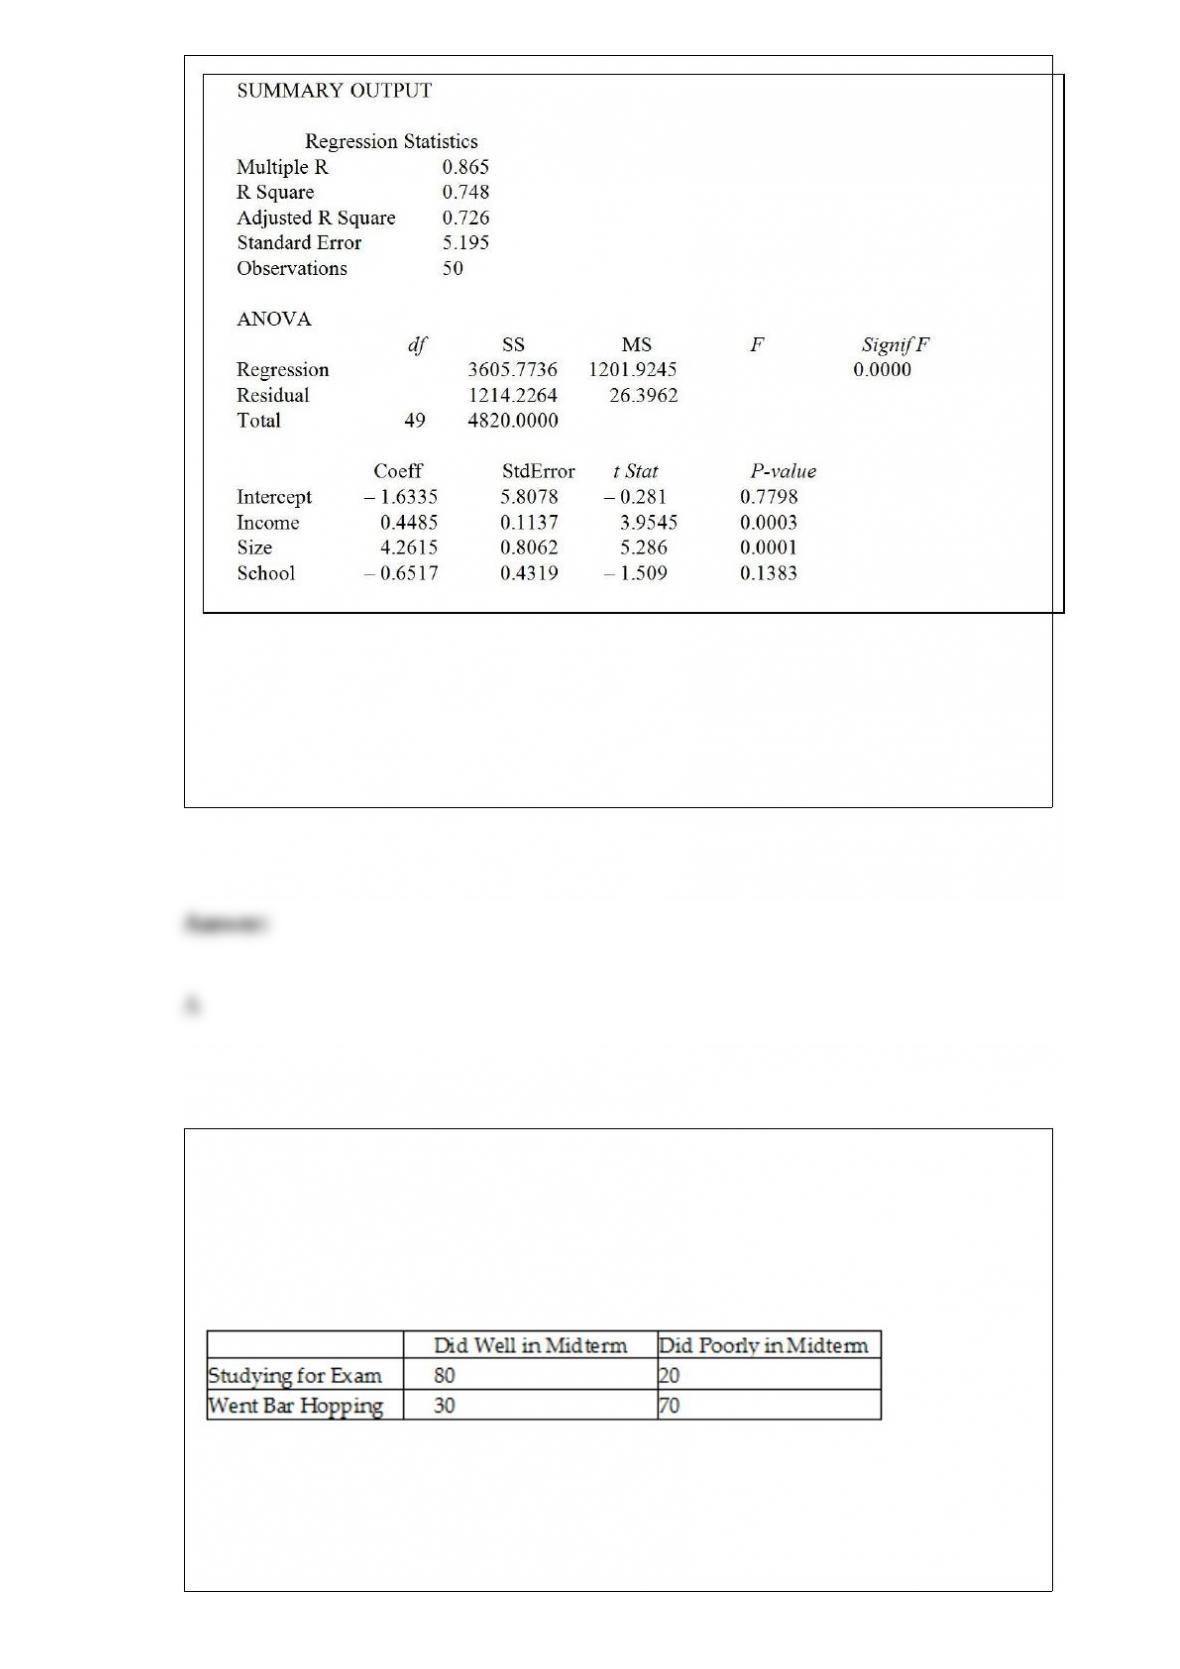
TABLE 2-6
A sample of 200 students at a Big-Ten university was taken after the midterm to ask
them whether they went bar hopping the weekend before the midterm or spent the
weekend studying, and whether they did well or poorly on the midterm. The following
table contains the result.
Referring to Table 2-6, of those who did well on the midterm in the sample, ________
percent of them went bar hopping the weekend before the midterm.
A) 15

B) 27.27
C) 30
D) 50
TABLE 9-6
The quality control engineer for a furniture manufacturer is interested in the mean
amount of force necessary to produce cracks in stressed oak furniture. She performs a
two-tail test of the null hypothesis that the mean for the stressed oak furniture is 650.
The calculated value of the Z test statistic is a positive number that leads to a p-value of
0.080 for the test.
Referring to Table 9-6, suppose the engineer had decided that the alternative hypothesis
to test was that the mean was greater than 650. What would be the p-value of this
one-tail test?
A) 0.040
B) 0.160
C) 0.840
D) 0.960
TABLE 11-3
As part of an evaluation program, a sporting goods retailer wanted to compare the
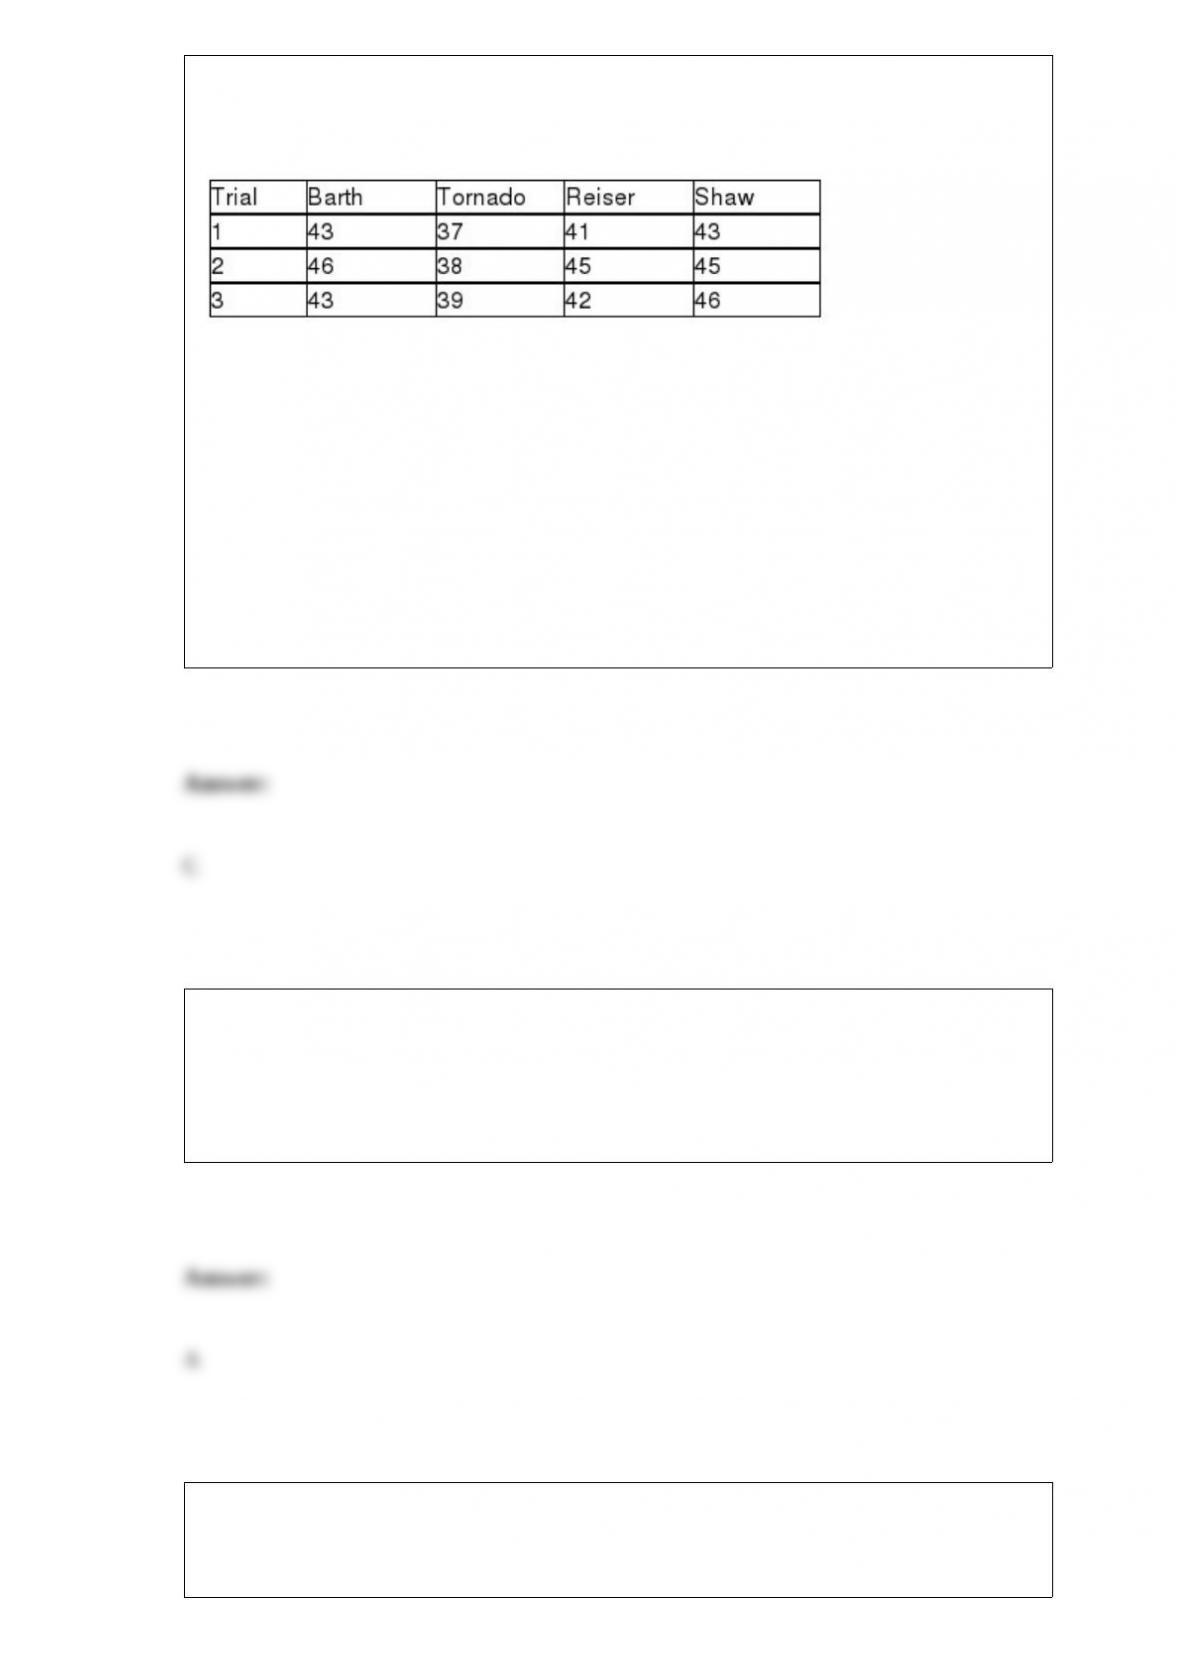
downhill coasting speeds of 4 brands of bicycles. She took 3 of each brand and
determined their maximum downhill speeds. The results are presented in miles per hour
in the table below.
Referring to Table 11-3, what should be the conclusion for the Levene’s test for
homogeneity of variances at a 5% level of significance?
A) There is insufficient evidence that the variances are all the same.
B) There is sufficient evidence that the variances are all the same.
C) There is insufficient evidence that the variances are not all the same.
D) There is sufficient evidence that the variances are not all the same.
Which of the following terms describes the overall long-term tendency of a time series?
A) trend
B) cyclical component
C) irregular component
D) seasonal component
TABLE 17-7
As a project for his business statistics class, a student examined the factors that
determined parking meter rates throughout the campus area. Data were collected for the
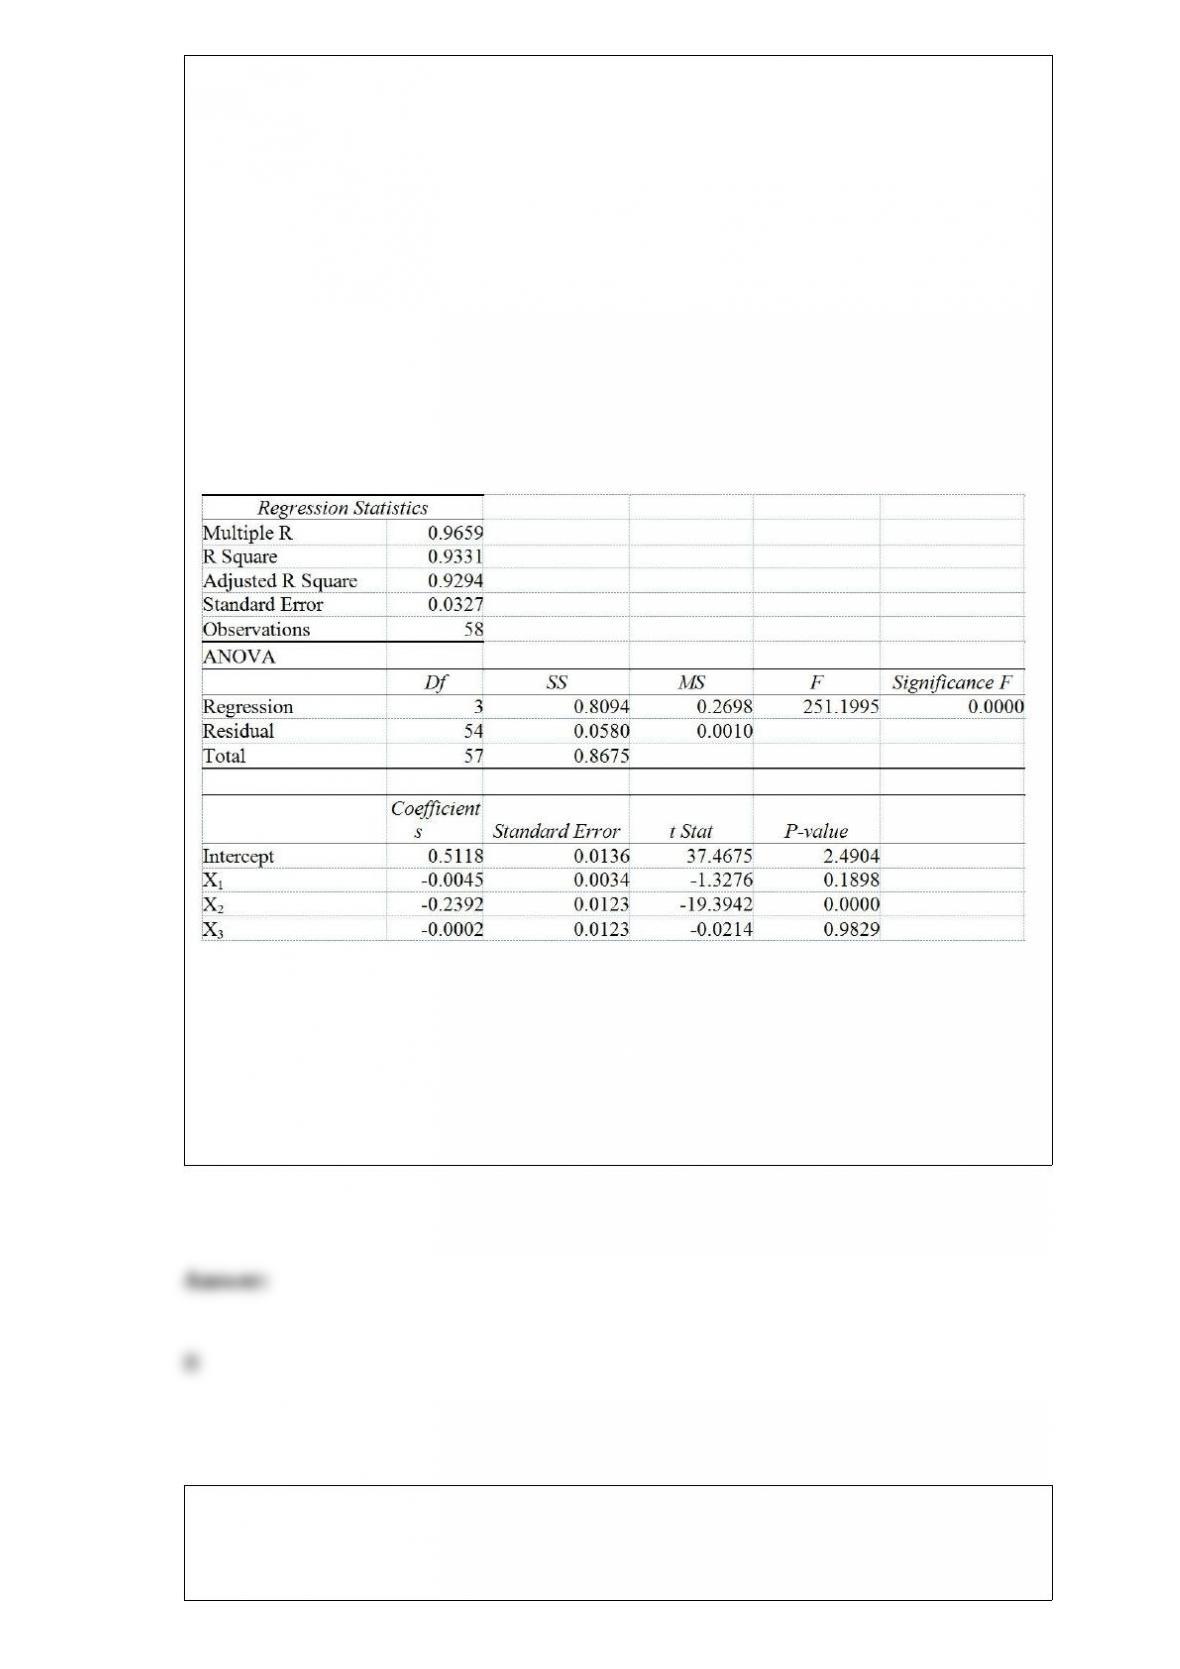
price per hour of parking, blocks to the quadrangle, and one of the three jurisdictions:
on campus, in downtown and off campus, or outside of downtown and off campus. The
population regression model hypothesized is
Yi= α + β1X1i + β2X2i + β3X3i + ε
where
Y is the meter price
X1 is the number of blocks to the quad
X2 is a dummy variable that takes the value 1 if the meter is located in downtown and
off campus and the value 0 otherwise
X3 is a dummy variable that takes the value 1 if the meter is located outside of
downtown and off campus, and the value 0 otherwise
The following Excel results are obtained.
Referring to Table 17-7, if one is already outside of downtown and off campus but
decides to park 3 more blocks from the quad, the estimated mean parking meter rate
will
A) decrease by 0.0045.
B) decrease by 0.0135.
C) decrease by 0.0139.
D) decrease by 0.4979.
TABLE 17-1
A real estate builder wishes to determine how house size (House) is influenced by
family income (Income), family size (Size), and education of the head of household
(School). House size is measured in hundreds of square feet, income is measured in
thousands of dollars, and education is in years. The builder randomly selected 50
families and ran the multiple regression. Microsoft Excel output is provided below:
Referring to Table 17-1, the observed value of the F-statistic is missing from the
printout. What are the degrees of freedom for this F-statistic?
A) 46 for the numerator, 3 for the denominator
B) 3 for the numerator, 49 for the denominator
C) 46 for the numerator, 49 for the denominator
D) 3 for the numerator, 46 for the denominator
Referring to Table 14-2, an employee who took 12 economics courses scores 10 on the
performance rating. What is her estimated expected wage rate?
TABLE 14-2
A professor of industrial relations believes that an individual’s wage rate at a factory (Y)
depends on his performance rating (X1) and the number of economics courses the
employee successfully completed in college (X2). The professor randomly selects 6
workers and collects the following information:
A) 10.90
B) 12.20
C) 24.87
D) 25.70
TABLE 17-12
The marketing manager for a nationally franchised lawn service company would like to
study the characteristics that differentiate home owners who do and do not have a lawn
service. A random sample of 30 home owners located in a suburban area near a large
city was selected; 15 did not have a lawn service (code 0) and 15 had a lawn service
(code 1). Additional information available concerning these 30 home owners includes
family income (Income, in thousands of dollars), lawn size (Lawn Size, in thousands of
square feet), attitude toward outdoor recreational activities (Attitude 0 = unfavorable, 1
= favorable), number of teenagers in the household (Teenager), and age of the head of
the household (Age).
The Minitab output is given below:
Referring to Table 17-12, which of the following is the correct interpretation for the
Income slope coefficient?

A) Holding constant the effect of the other variables, the estimated number of lawn
services purchased increases by 0.2868 for each increase of one thousand dollars in
family income.
B) Holding constant the effect of the other variables, the estimated average number of
lawn services purchased increases by 0.2868 for each increase of one thousand dollars
in family income.
C) Holding constant the effect of the other variables, the estimated probability of
purchasing a lawn service increases by 0.2868 for each increase of one thousand dollars
in family income.
D) Holding constant the effect of the other variables, the estimated natural logarithm of
the odds ratio of purchasing a lawn service increases by 0.2868 for each increase of one
thousand dollars in family income.
When a time series appears to be increasing at an increasing rate, such that percentage
difference from value to value is constant, the appropriate model to fit is the
A) linear trend.
B) quadratic trend.
C) exponential trend.
D) None of the above.
TABLE 17-1
A real estate builder wishes to determine how house size (House) is influenced by
family income (Income), family size (Size), and education of the head of household
(School). House size is measured in hundreds of square feet, income is measured in
thousands of dollars, and education is in years. The builder randomly selected 50
families and ran the multiple regression. Microsoft Excel output is provided below:
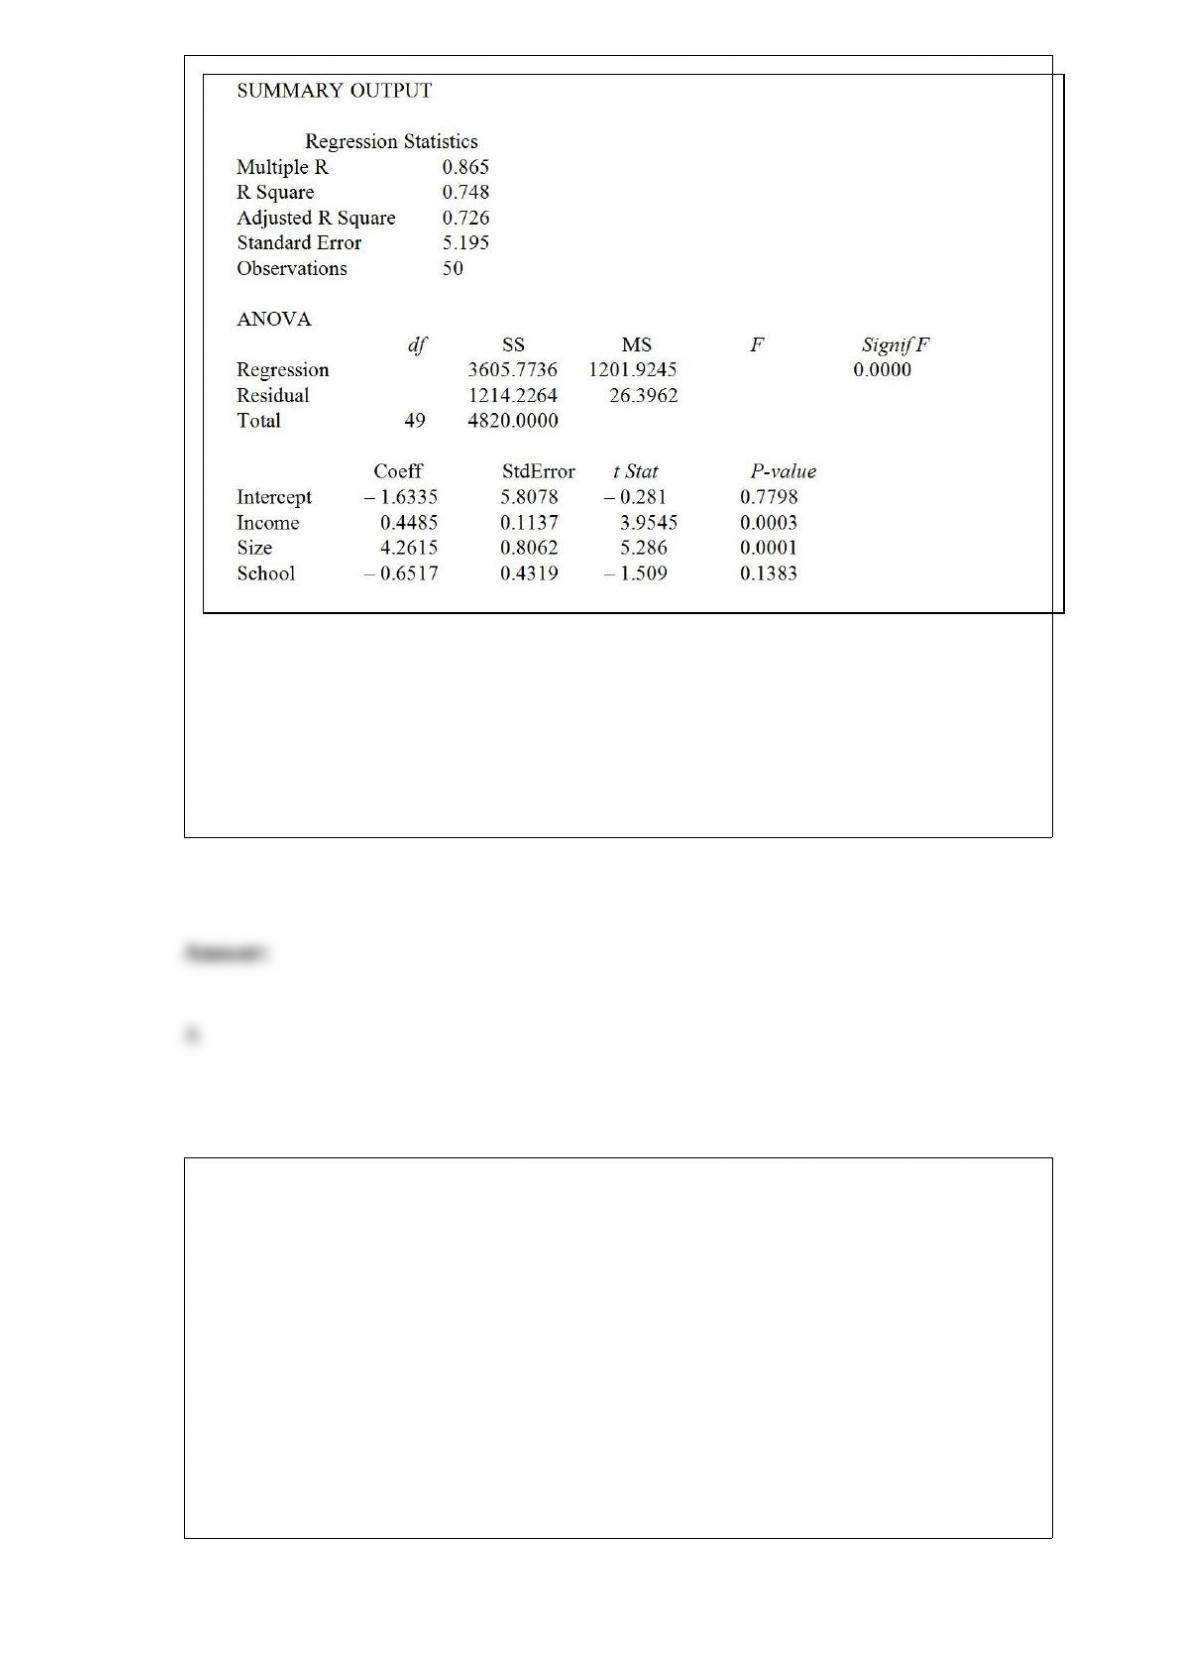
Referring to Table 17-1, what minimum annual income would an individual with a
family size of 9 and 10 years of education need to attain a predicted 5,000 square foot
home (House = 50)?
A) $44.14 thousand
B) $56.75 thousand
C) $178.33 thousand
D) $211.85 thousand
Major league baseball salaries averaged $3.26 million with a standard deviation of $1.2
million in a recent year. Suppose a sample of 100 major league players was taken. Find
the approximate probability that the mean salary of the 100 players was no more than
$3.0 million.
A) approximately 0
B) 0.0151
C) 0.9849
D) approximately 1

The marketing manager for an automobile manufacturer is interested in determining the
proportion of new compact-car owners who would have purchased a knee airbag if it
had been available for an additional cost of $300. The manager believes from previous
information that the proportion is 0.30. Suppose that a survey of 200 new compact-car
owners is selected and 79 indicate that they would have purchased the knee airbag. If
you were to conduct a test to determine whether there is evidence that the proportion is
different from 0.30 and decided not to reject the null hypothesis, what conclusion could
you reach?
A) There is sufficient evidence that the proportion is 0.30.
B) There is not sufficient evidence that the proportion is 0.30.
C) There is sufficient evidence that the proportion is not 0.30.
D) There is not sufficient evidence that the proportion is not 0.30.
TABLE 4-4
Suppose that patrons of a restaurant were asked whether they preferred water or
whether they preferred soda. 70% said that they preferred water. 60% of the patrons
were male. 80% of the males preferred water.
Referring to Table 4-4, suppose a randomly selected patron prefers water. Then the
probability that the patron is a male is ________.
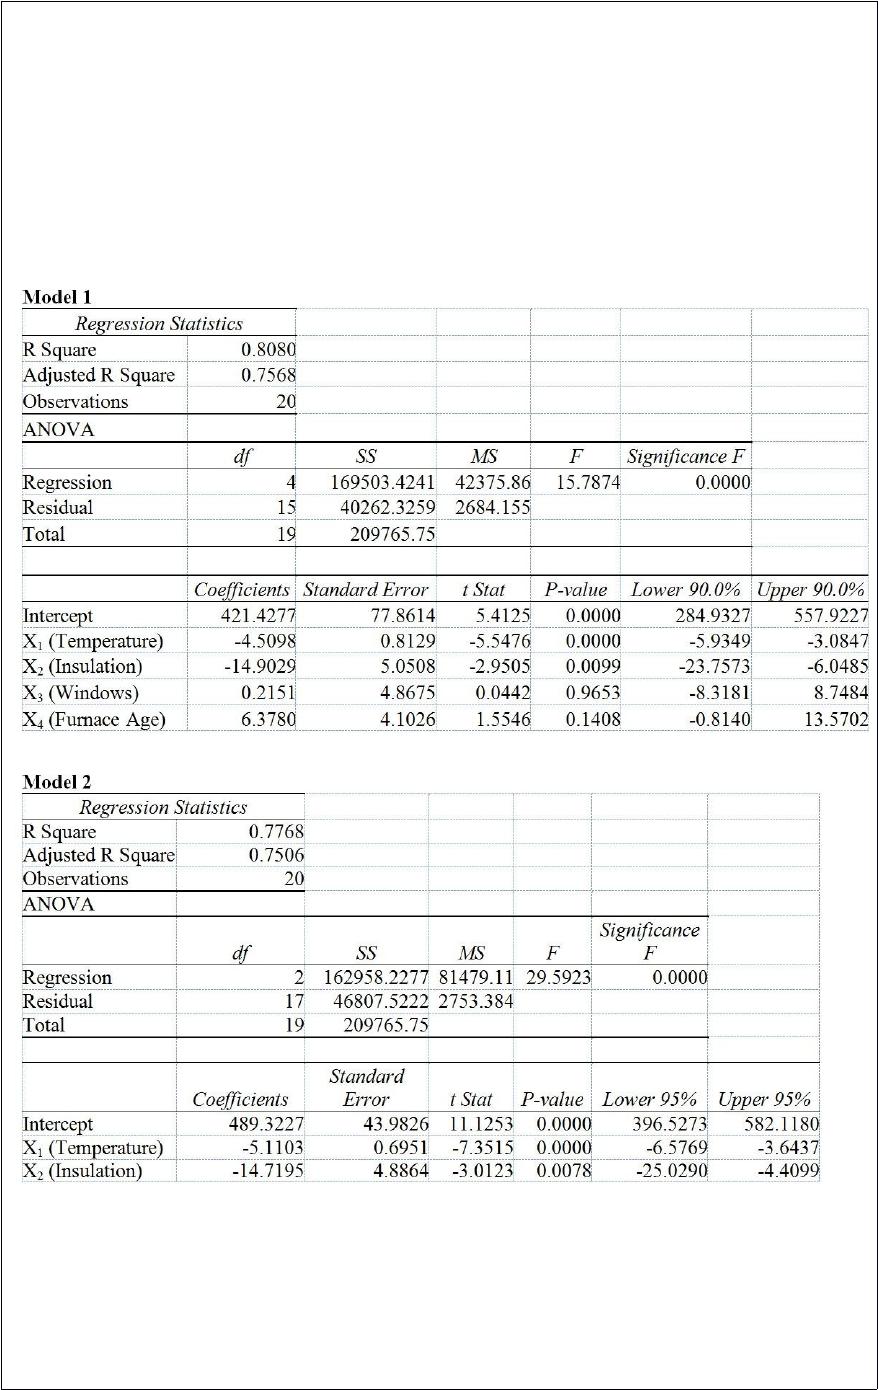
TABLE 17-2
One of the most common questions of prospective house buyers pertains to the cost of
heating in dollars (Y). To provide its customers with information on that matter, a large
real estate firm used the following 4 variables to predict heating costs: the daily
minimum outside temperature in degrees of Fahrenheit (X1), the amount of insulation in
inches (X2), the number of windows in the house (X3), and the age of the furnace in
years (X4). Given below are the EXCEL outputs of two regression models.
Referring to Table 17-2, what are the degrees of freedom of the partial F test for
H0 : β3 = β4 = 0 vs. H1 : At least one βj ≠0, j = 3, 4?
A) 2 numerator degrees of freedom and 15 denominator degrees of freedom
B) 15 numerator degrees of freedom and 2 denominator degrees of freedom
C) 2 numerator degrees of freedom and 17 denominator degrees of freedom
D) 17 numerator degrees of freedom and 2 denominator degrees of freedom
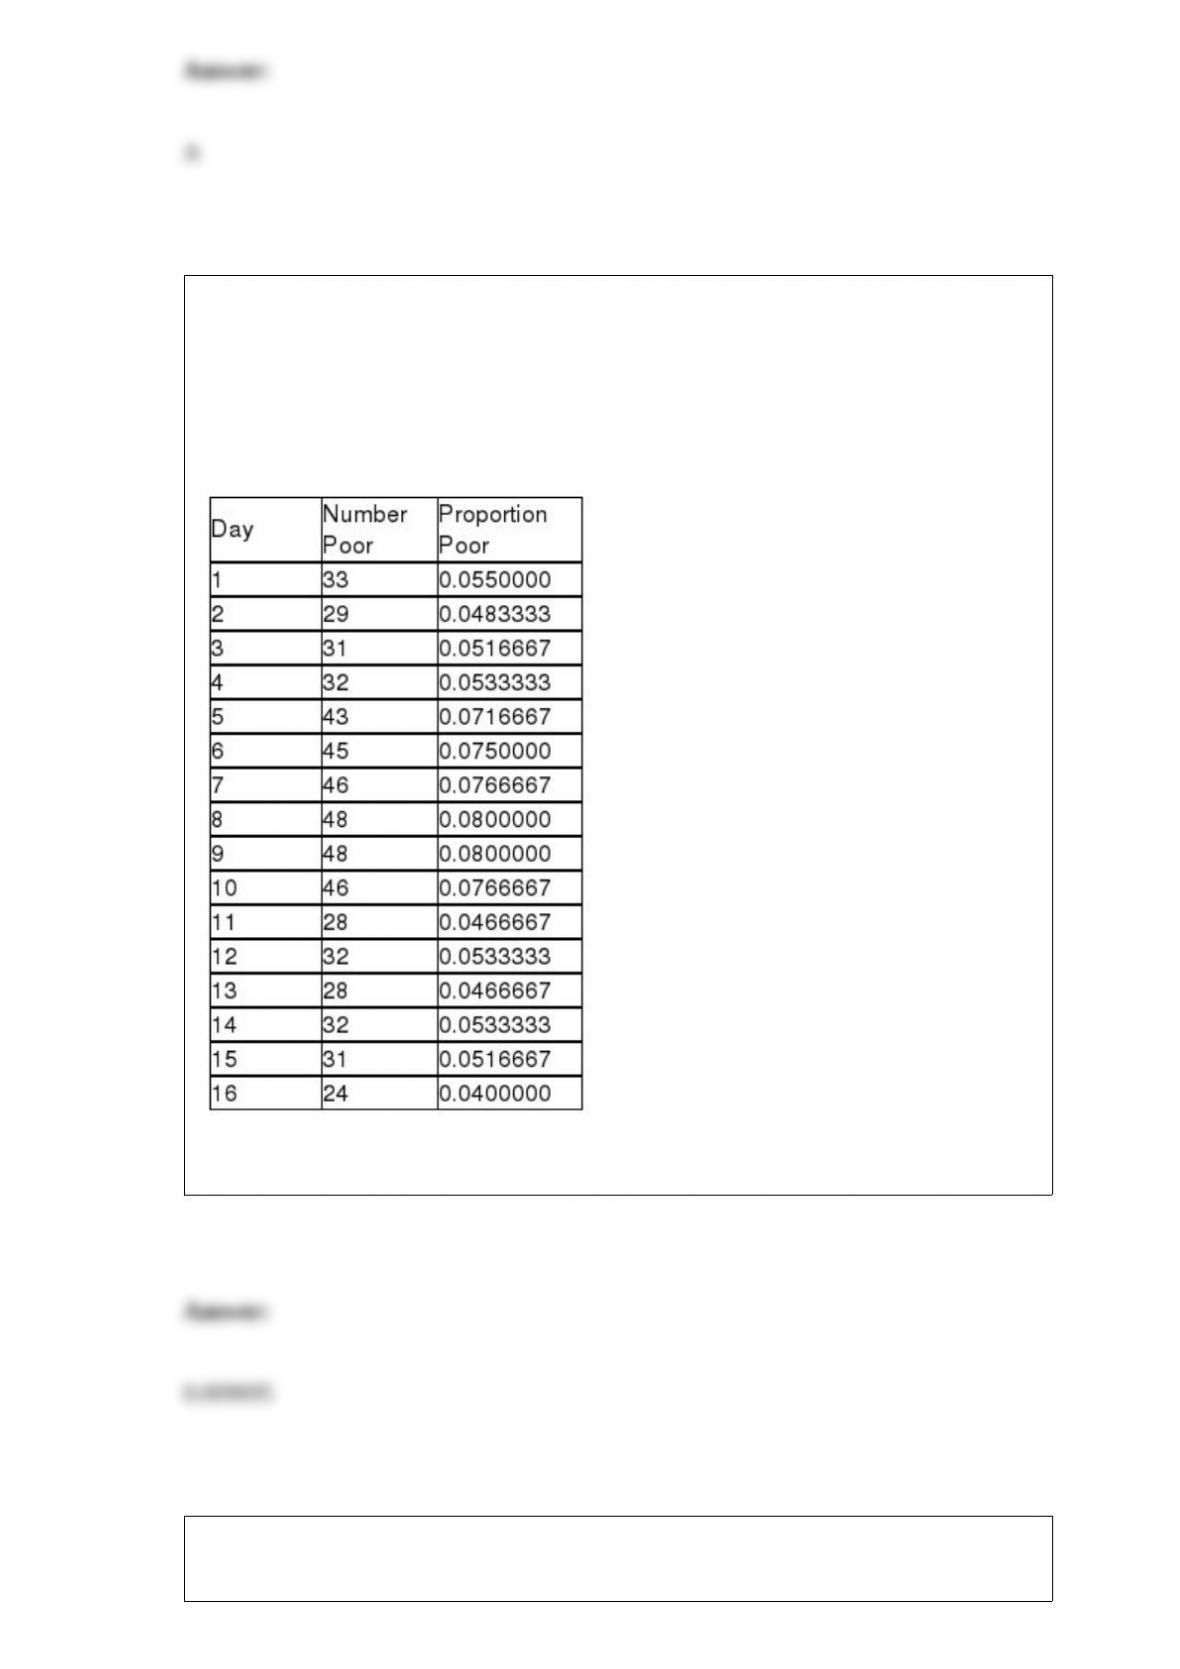
TABLE 18-6
The maker of a packaged candy wants to evaluate the quality of her production process.
On each of 16 consecutive days, she samples 600 bags of candy and determines the
number in each day’s sample that she considers to be of poor quality. The data that she
developed follow.
Referring to Table 18-6, a p control chart is to be constructed for these data. The
estimate of the standard error of the sample proportion is ________.
Referring to Table 14-4, which of the independent variables in the model are significant
at the 5% level?

A) Income only
B) Size only
C) Income and Size
D) None of the above
TABLE 12-20
A filling machine at a local soft drinks company is calibrated to fill the cans at a mean
amount of 12 fluid ounces and a standard deviation of 0.5 ounces. The company wants
to test whether the standard deviation of the amount filled by the machine is 0.5 ounces.
A random sample of 15 cans filled by the machine reveals a standard deviation of 0.67
ounces.
Referring to Table 12-20, what type of test should be performed?
A) Lower-tail test
B) Upper-tail test
C) Two-tail test
D) None of the above.
Referring to Table 14-6, ________% of the variation in heating cost can be explained
by the variation in the amount of insulation while holding the minimum outside
temperature constant.
TABLE 14-6
One of the most common questions of prospective house buyers pertains to the cost of
heating in dollars (Y). To provide its customers with information on that matter, a large
real estate firm used the following 2 variables to predict heating costs: the daily
minimum outside temperature in degrees of Fahrenheit (X1) and the amount of
insulation in inches (X2). Given below is EXCEL output of the regression model.
Also SSR (X1∣ X2) = 8343.3572 and SSR (X2∣ X1) = 4199.2672
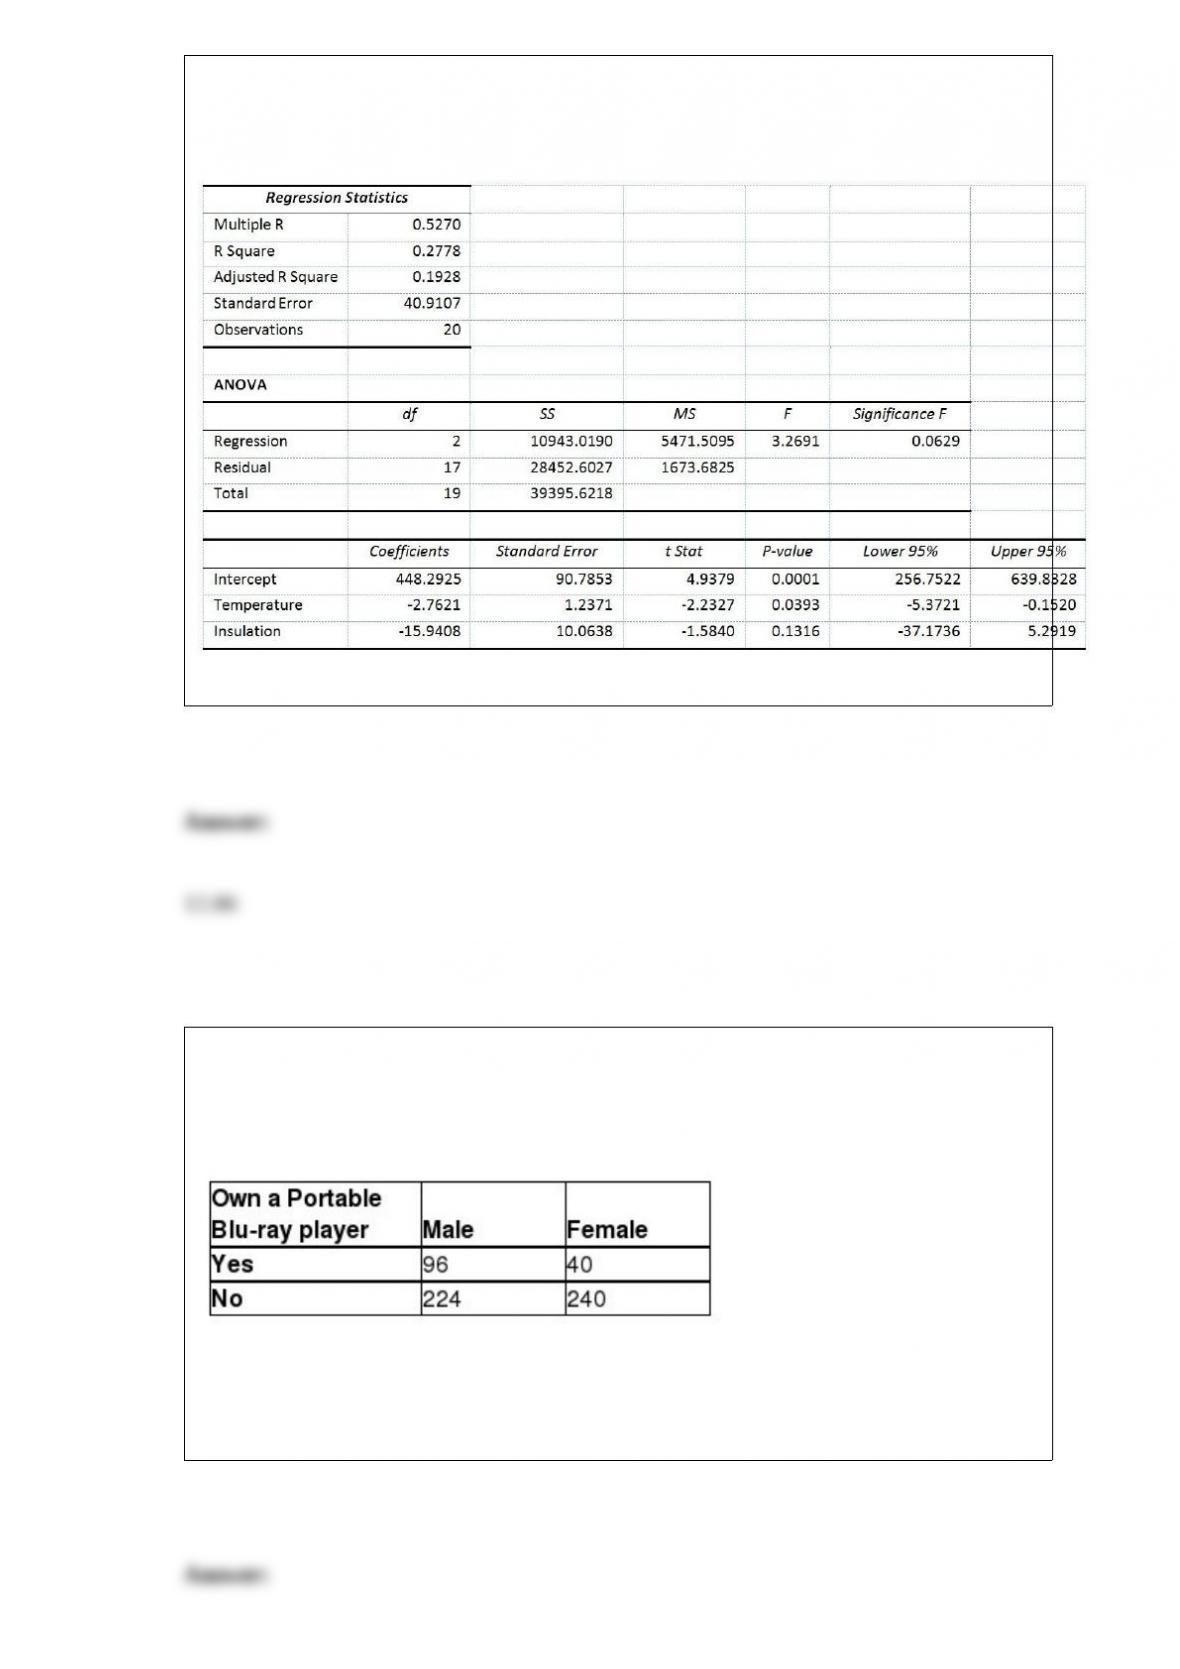
TABLE 2-14
The table below contains the number of people who own a portable Blu-ray player in a
sample of 600 broken down by gender.
Referring to Table 2-14, if the sample is a good representation of the population, we can
expect ________ percent of the females in the population will not own a portable
Blu-ray player.
TABLE 6-3
Suppose the time interval between two consecutive defective light bulbs from a
production line has a uniform distribution over an interval from 0 to 90 minutes.
Referring to Table 6-3, what is the probability that the time interval between two
consecutive defective light bulbs will be at least 50 minutes?
TABLE 17-10
Given below are results from the regression analysis where the dependent variable is
the number of weeks a worker is unemployed due to a layoff (Unemploy) and the
independent variables are the age of the worker (Age), the number of years of education
received (Edu), the number of years at the previous job (Job Yr), a dummy variable for
marital status (Married: 1 = married, 0 = otherwise), a dummy variable for head of
household (Head: 1 = yes, 0 = no) and a dummy variable for management position
(Manager: 1 = yes, 0 = no). We shall call this Model 1. The coefficient of partial
determination ( ) of each of the 6 predictors are, respectively,
0.2807, 0.0386, 0.0317, 0.0141, 0.0958, and 0.1201.
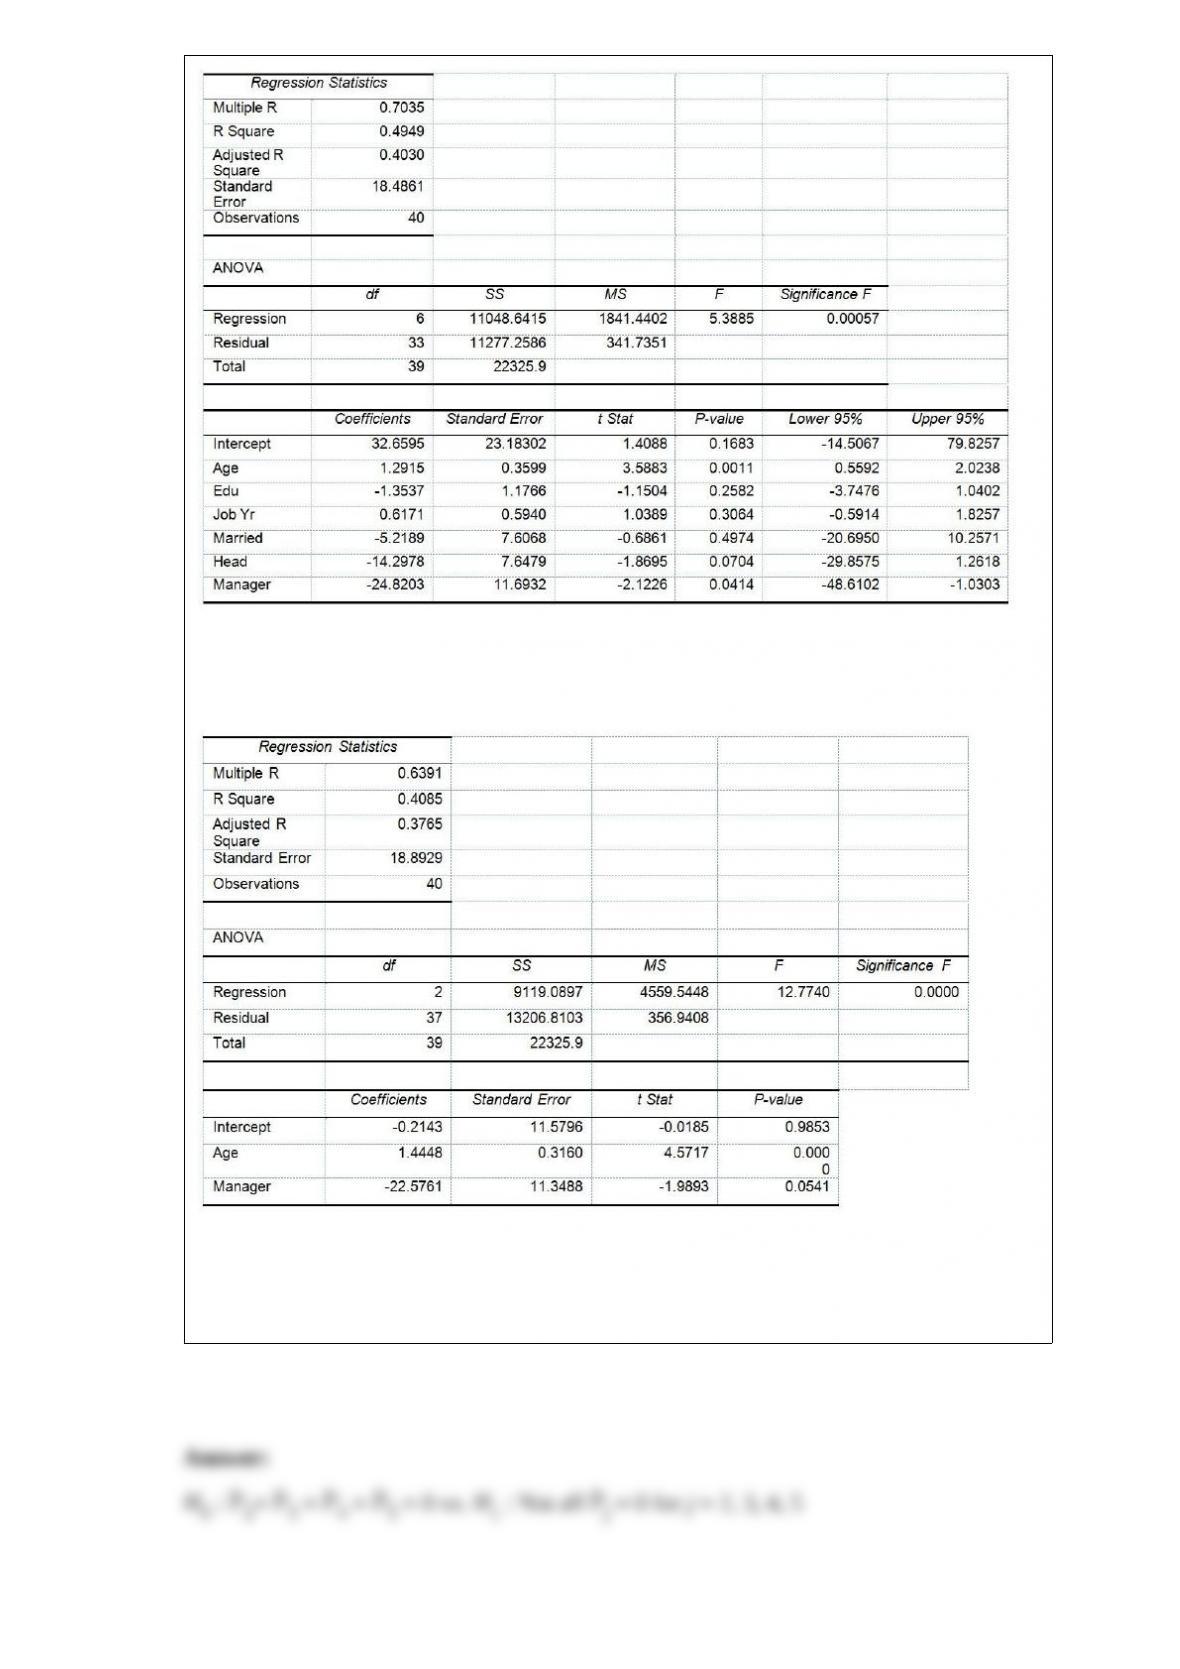
Model 2 is the regression analysis where the dependent variable is Unemploy and the
independent variables are Age and Manager. The results of the regression analysis are
given below:
Referring to Table 17-10 and using both Model 1 and Model 2, what are the null and
alternative hypotheses for testing whether the independent variables that are not
significant individually are also not significant as a group in explaining the variation in
the dependent variable at a 5% level of significance?
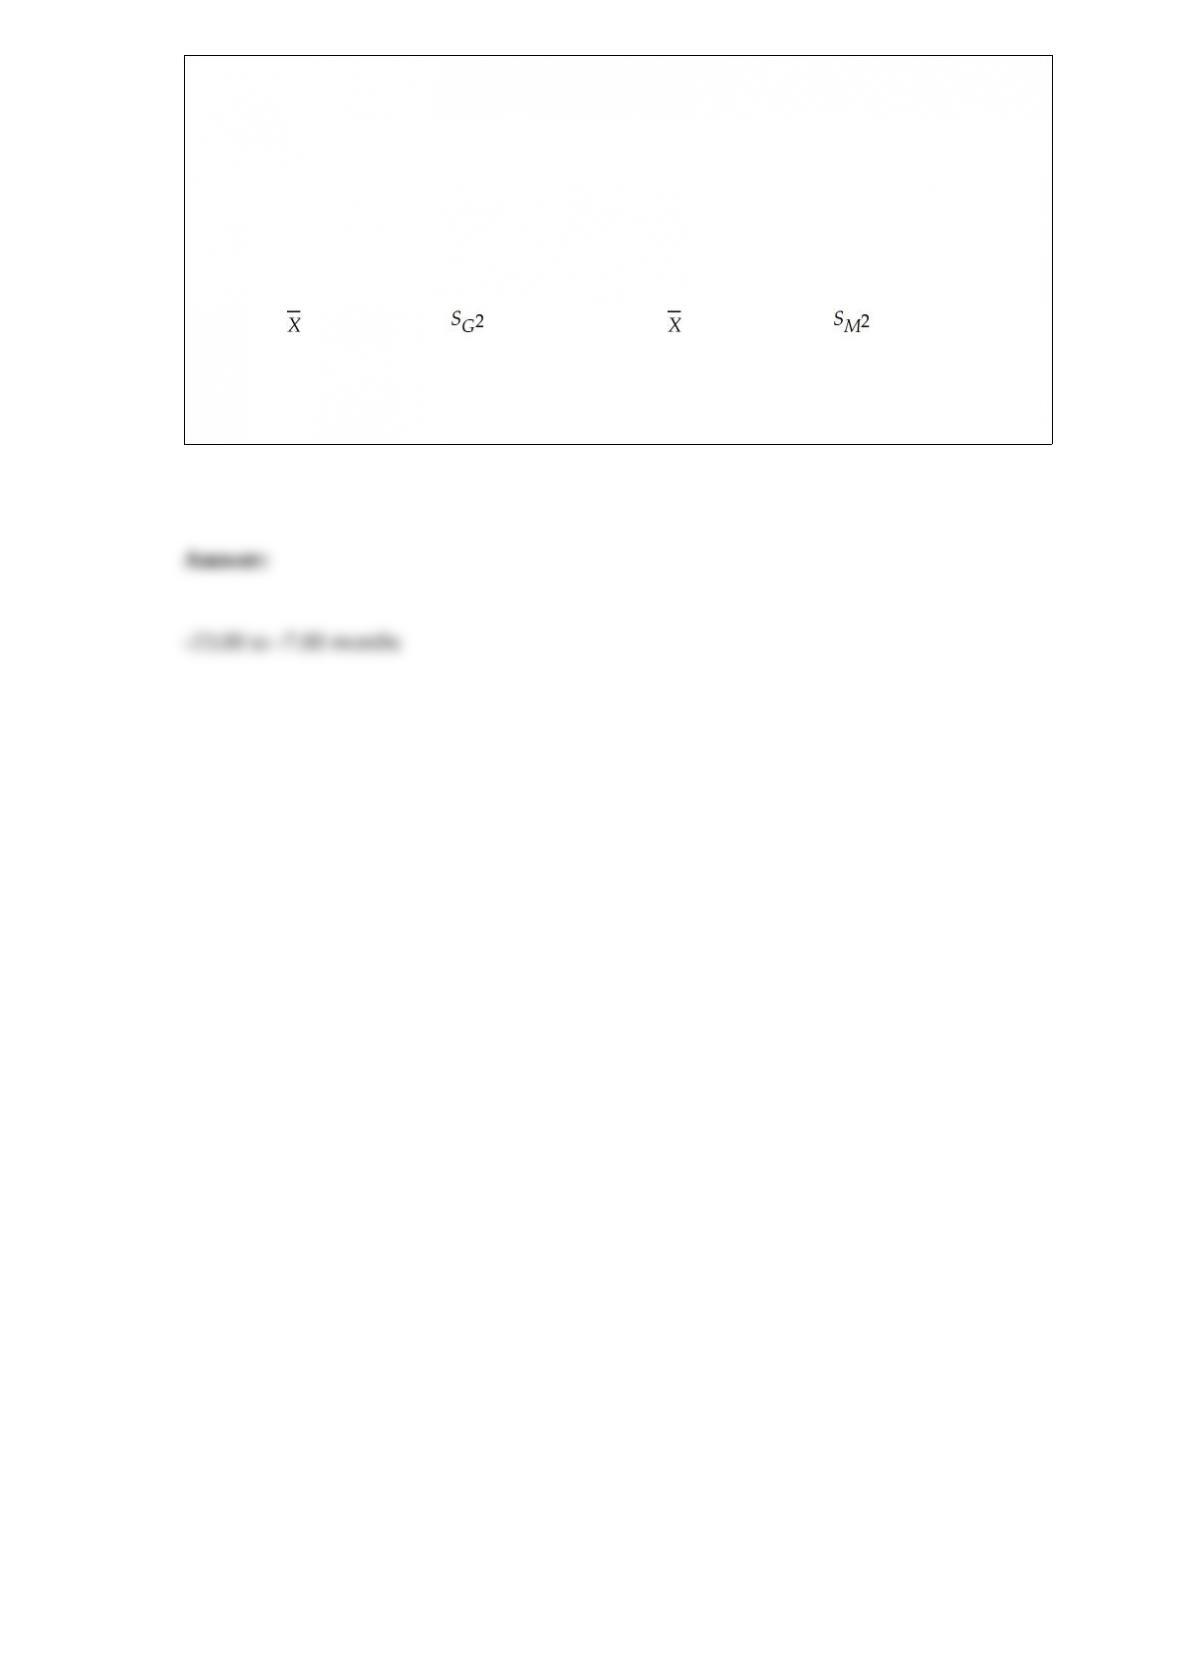
TABLE 10-3
A real estate company is interested in testing whether the mean time that families in
Gotham have been living in their current homes is less than families in Metropolis.
Assume that the two population variances are equal. A random sample of 100 families
from Gotham and a random sample of 150 families in Metropolis yield the following
data on length of residence in current homes.
Gotham: G = 35 months, = 900 Metropolis: M = 50 months, = 1050
Referring to Table 10-3, what is the 95% confidence interval estimate for the difference
in the two means?