
TABLE 9-8
One of the biggest issues facing e-retailers is the ability to turn browsers into buyers.
This is measured by the conversion rate, the percentage of browsers who buy something
in their visit to a site. The conversion rate for a company’s website was 10.1%. The
website at the company was redesigned in an attempt to increase its conversion rates. A
sample of 200 browsers at the redesigned site was selected. Suppose that 24 browsers
made a purchase. The company officials would like to know if there is evidence of an
increase in conversion rate at the 5% level of significance.
Referring to Table 9-8, what critical value should the company officials use to
determine the rejection region?
TABLE 9-8
One of the biggest issues facing e-retailers is the ability to turn browsers into buyers.
This is measured by the conversion rate, the percentage of browsers who buy something
in their visit to a site. The conversion rate for a company’s website was 10.1%. The
website at the company was redesigned in an attempt to increase its conversion rates. A
sample of 200 browsers at the redesigned site was selected. Suppose that 24 browsers
made a purchase. The company officials would like to know if there is evidence of an
increase in conversion rate at the 5% level of significance.
Referring to Table 9-8, the lowest level of significance at which the null hypothesis can
be rejected is ________.
The Human Resources Director of a large corporation wishes to develop an employee
benefits package and decides to select 500 employees from a list of all (N = 40,000)
workers in order to study their preferences for the various components of a potential
package. All the employees in the corporation constitute the ________.
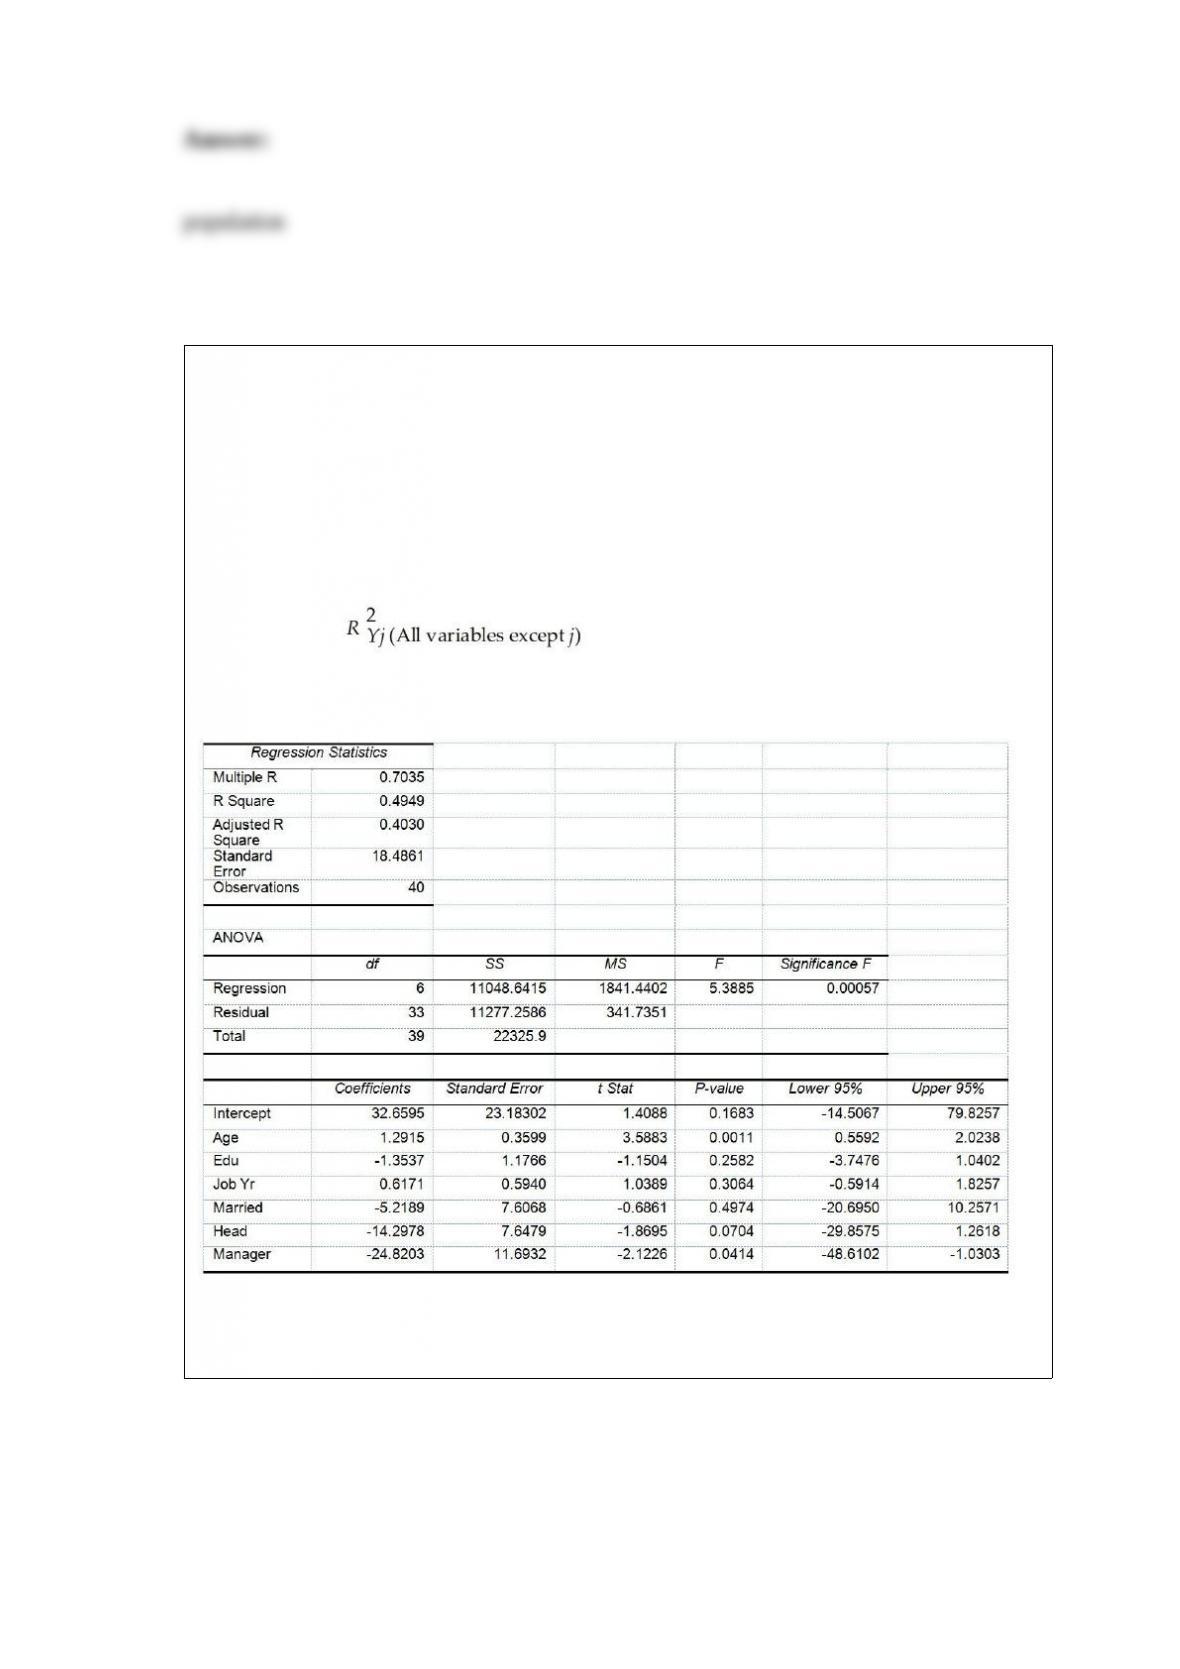
TABLE 17-10
Given below are results from the regression analysis where the dependent variable is
the number of weeks a worker is unemployed due to a layoff (Unemploy) and the
independent variables are the age of the worker (Age), the number of years of education
received (Edu), the number of years at the previous job (Job Yr), a dummy variable for
marital status (Married: 1 = married, 0 = otherwise), a dummy variable for head of
household (Head: 1 = yes, 0 = no) and a dummy variable for management position
(Manager: 1 = yes, 0 = no). We shall call this Model 1. The coefficient of partial
determination ( ) of each of the 6 predictors are, respectively,
0.2807, 0.0386, 0.0317, 0.0141, 0.0958, and 0.1201.
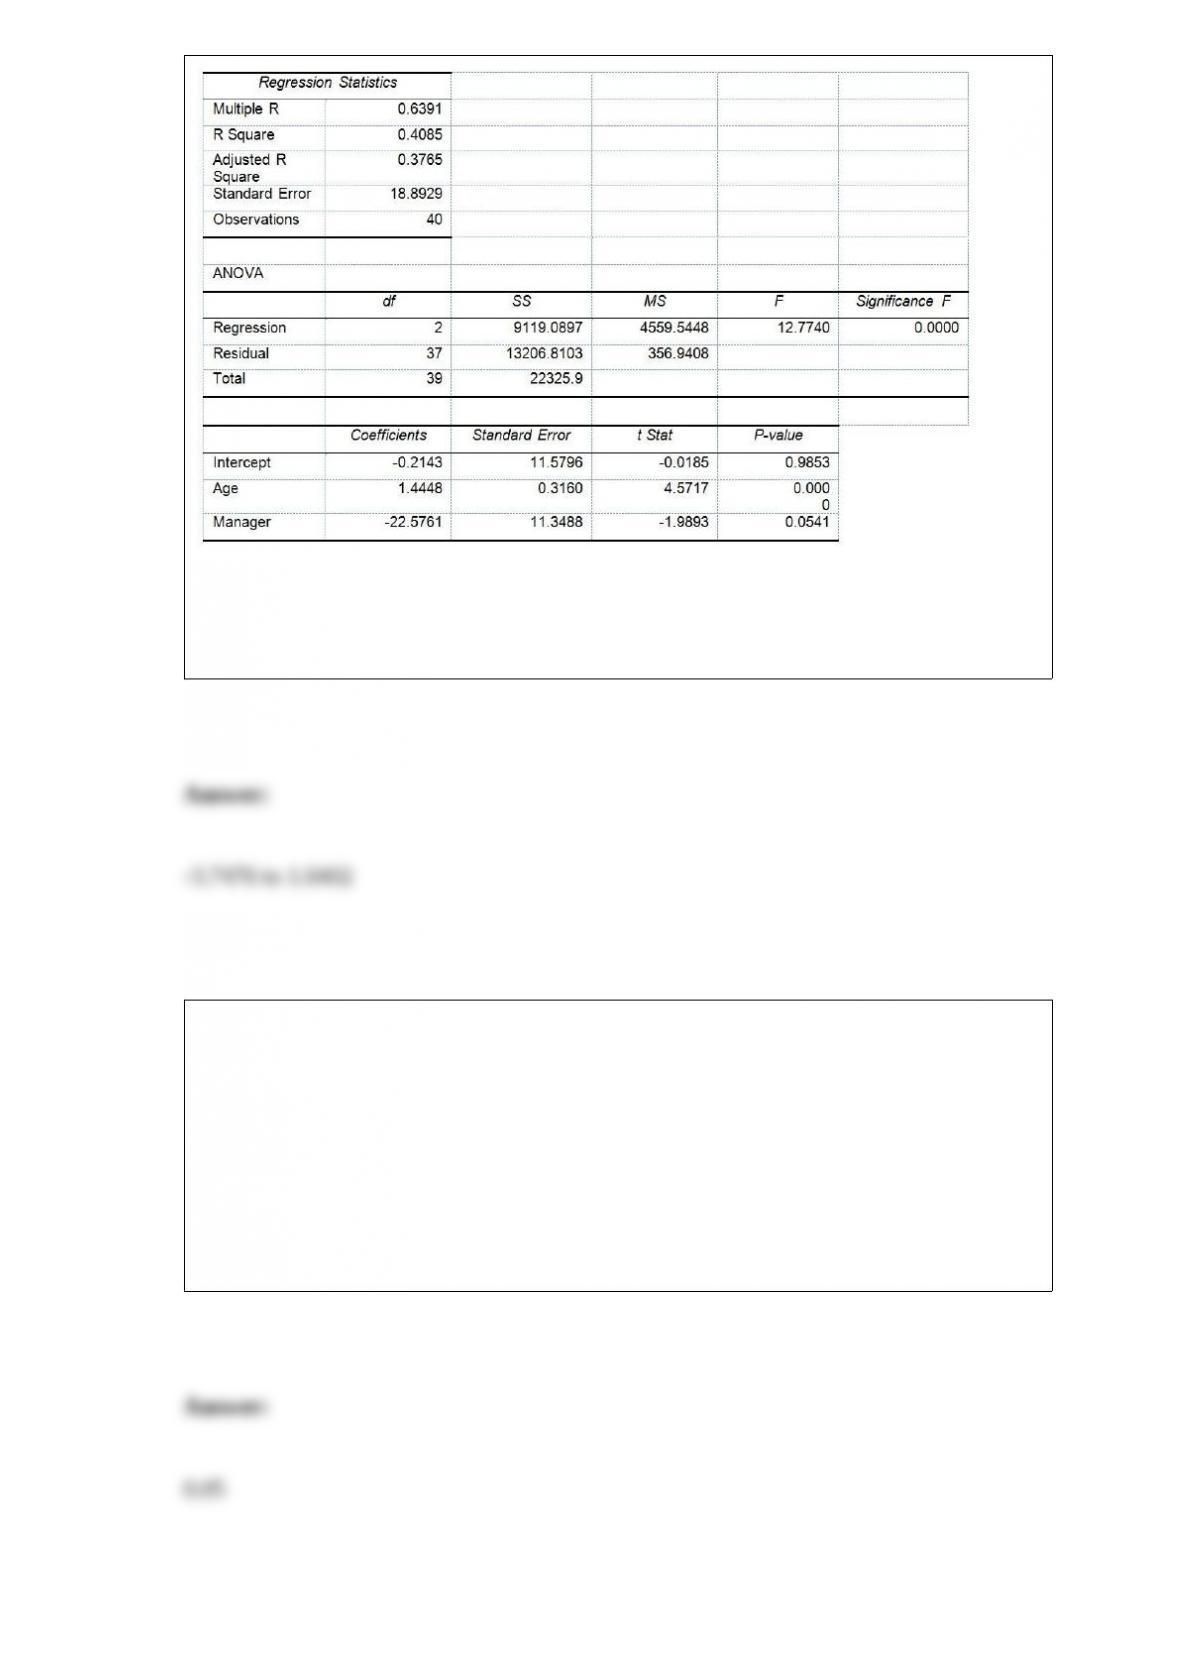
Model 2 is the regression analysis where the dependent variable is Unemploy and the
independent variables are Age and Manager. The results of the regression analysis are
given below:
Referring to Table 17-10, Model 1, what are the lower and upper limits of the 95%
confidence interval estimate for the effect of a one year increase in education received
on the mean number of weeks a worker is unemployed due to a layoff after taking into
consideration the effect of all the other independent variables?
TABLE 4-5
In a meat packaging plant Machine A accounts for 60% of the plant’s output, while
Machine B accounts for 40% of the plant’s output. In total, 4% of the packages are
improperly sealed. Also, 3% of the packages are from Machine A and are improperly
sealed.
Referring to Table 4-5, if a package selected at random came from Machine A, the
probability that it is improperly sealed is ________.

TABLE 3-3
The ordered array below represents the number of vitamin supplements sold by a health
food store in a sample of 16 days.
19, 19, 20, 20, 22, 23, 25, 26, 27, 30, 33, 34, 35, 36, 38, 41
Note: For this sample, the sum of the values is 448, and the sum of the squared
differences between each value and the mean is 812.
Referring to Table 3-3, the range of the number of vitamin supplements sold in this
sample is ________.
TABLE 17-9
What are the factors that determine the acceleration time (in sec.) from 0 to 60 miles per
hour of a car? Data on the following variables for 171 different vehicle models were
collected:
Accel Time: Acceleration time in sec.
Cargo Vol: Cargo volume in cu. ft.
HP: Horsepower
MPG: Miles per gallon
SUV: 1 if the vehicle model is an SUV with Coupe as the base when SUV and Sedan
are both 0
Sedan: 1 if the vehicle model is a sedan with Coupe as the base when SUV and Sedan
are both 0
The regression results using acceleration time as the dependent variable and the
remaining variables as the independent variables are presented below.
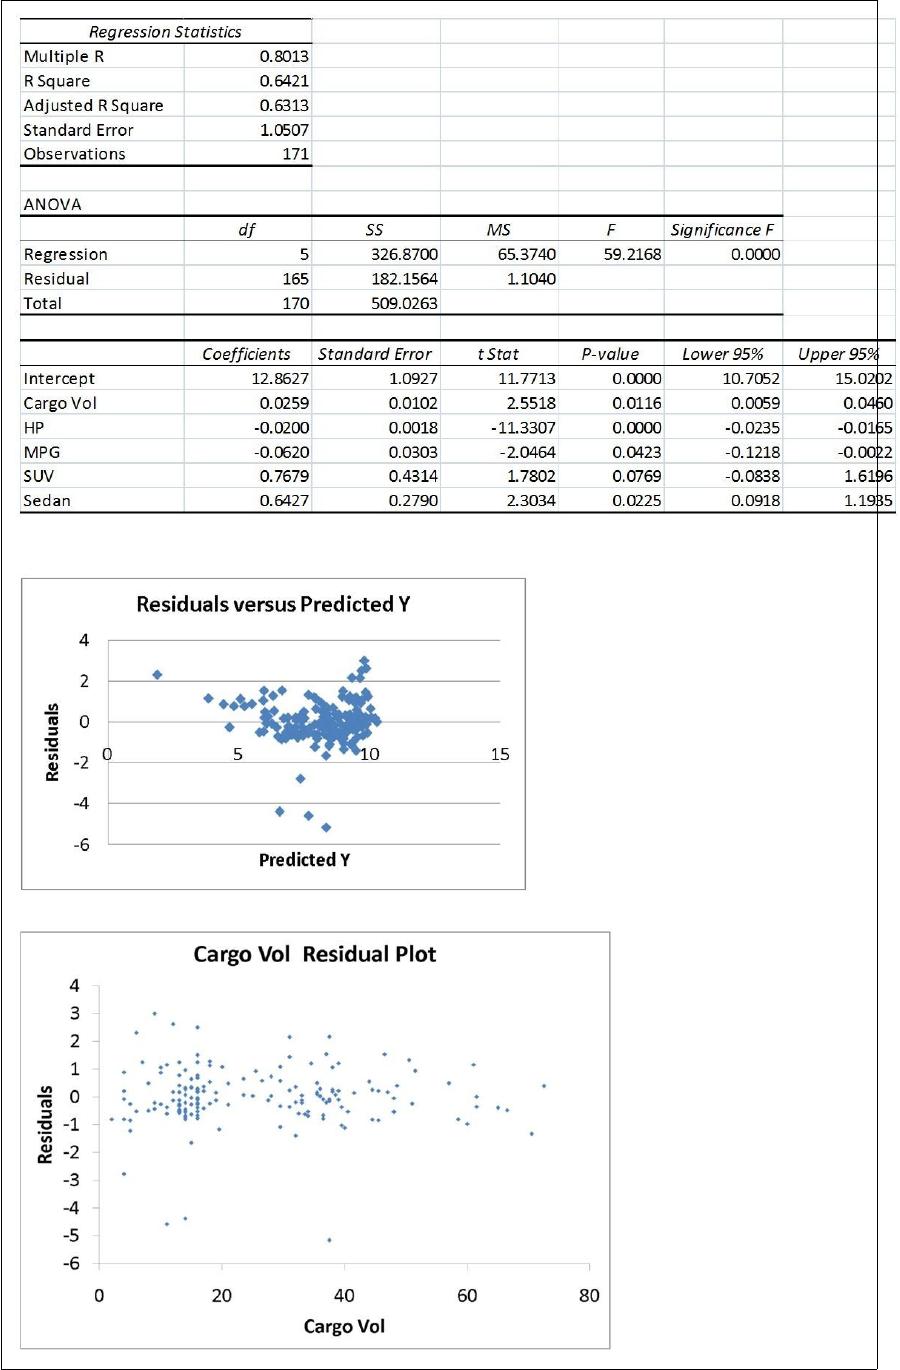
The various residual plots are as shown below.
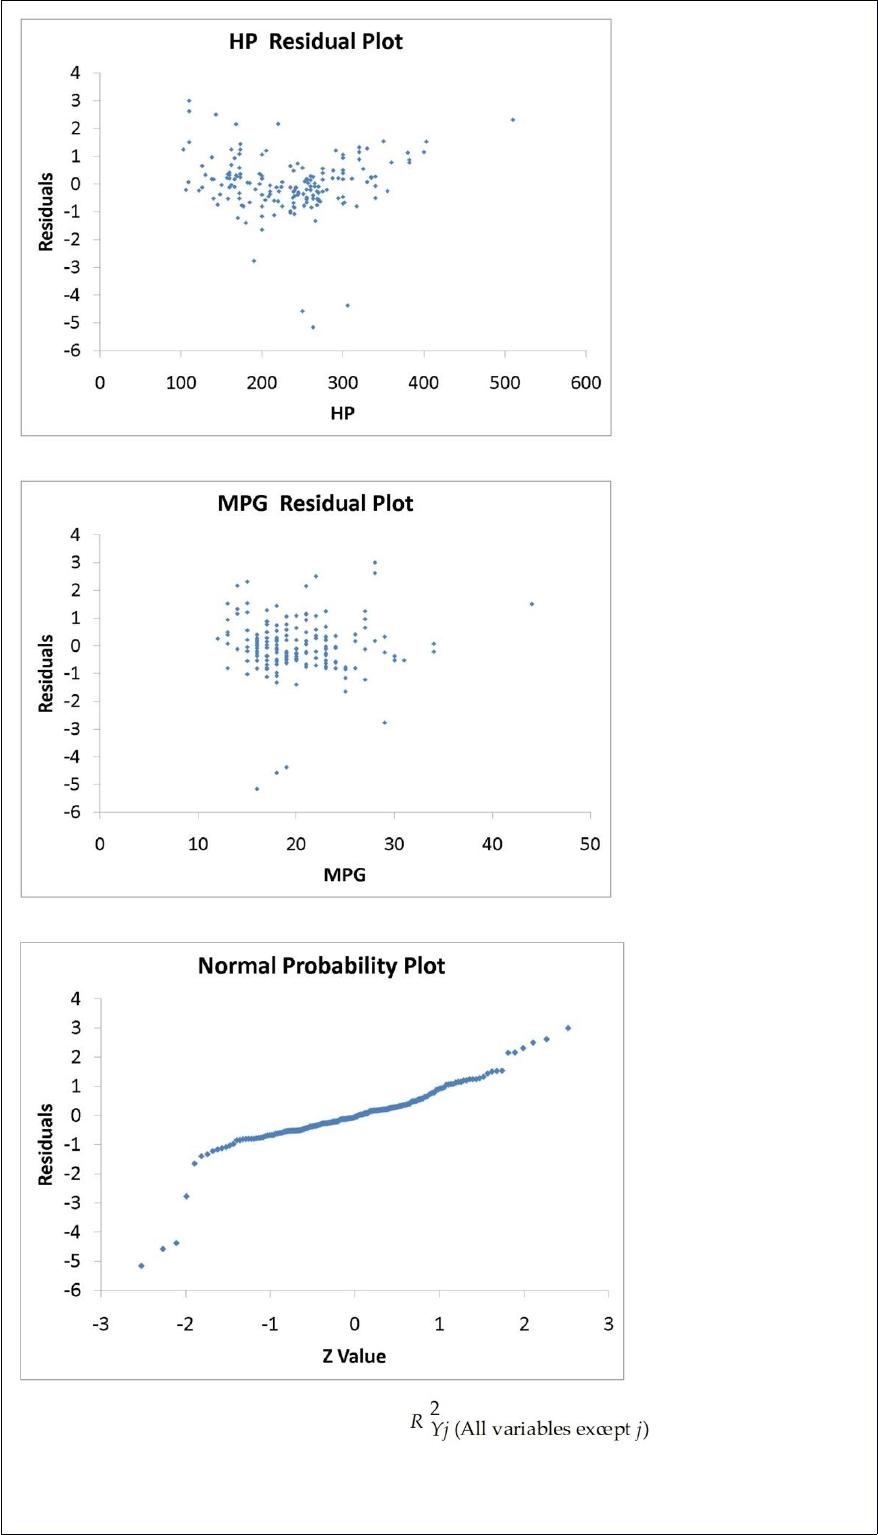
The coefficient of partial determination ( ) of each of the 5
predictors are, respectively, 0.0380, 0.4376, 0.0248, 0.0188, and 0.0312.
The coefficient of multiple determination for the regression model using each of the 5

variables Xj as the dependent variable and all other X variables as independent variables
( ) are, respectively, 0.7461, 0.5676, 0.6764, 0.8582, 0.6632.
Referring to Table 17-9, what is the value of the test statistic to determine whether HP
makes a significant contribution to the regression model in the presence of the other
independent variables at a 5% level of significance?