A study at a college in the west coast reveals that, historically, 45% of the students are
minority students. The expected percentage of minority students in their next group of
freshmen is ________.
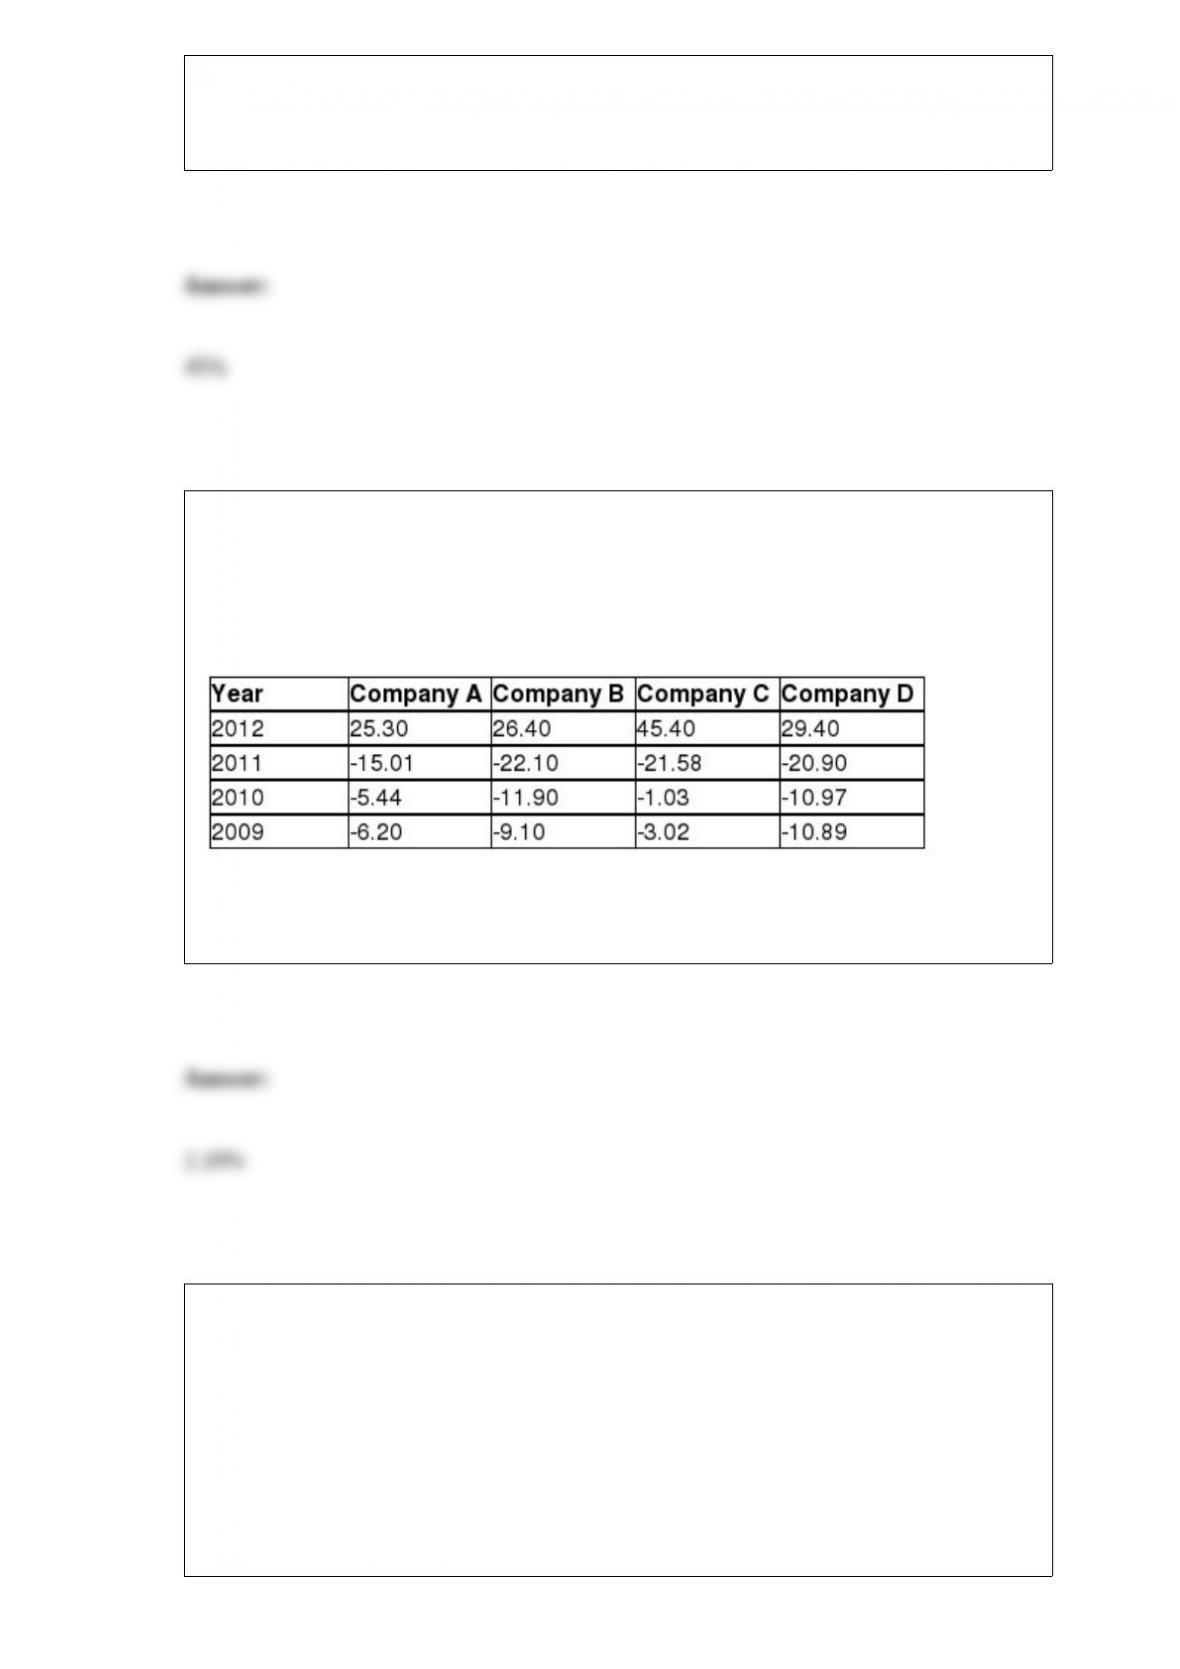
TABLE 3-8
The time period from 2009 to 2012 saw a great deal of volatility in the value of stocks.
The data in the following table represent the total rate of return of our companies from
2009 to 2012.
Referring to Table 3-8, calculate the geometric mean rate of return per year for
Company C.
TABLE 7-7
Times spent studying by students in the week before final exams follow a normal
distribution with standard deviation 8 hours. A random sample of 4 students was taken
from a population of 50 in order to estimate the mean study time for the population of
all students. Use the finite population correction.
Referring to Table 7-7, what is the probability that the sample mean differs from the
population mean by less than 2 hours?
The amount of bleach a machine pours into bottles has a mean of 36 oz. with a standard
deviation of 0.15 oz. Suppose we take a random sample of 36 bottles filled by this
machine. The probability that the mean of the sample is between 35.94 and 36.06 oz. is
________.
The amount of tea leaves in a can from a particular production line is normally
distributed with = 110 grams and = 25 grams. A sample of 25 cans is to be selected.
What is the probability that the sample mean will be greater than 100 grams?