
TABLE 6-2
John has two jobs. For daytime work at a jewelry store he is paid $15,000 per month,
plus a commission. His monthly commission is normally distributed with a mean of
$10,000 and a standard deviation of $2,000. At night he works occasionally as a waiter,
for which his monthly income is normally distributed with a mean of $1,000 and a
standard deviation of $300. John’s income levels from these two sources are
independent of each other.
Referring to Table 6-2, for a given month, what is the probability that John’s
commission from the jewelry store is between $5,000 and $7,000?
TABLE 13-3
The director of cooperative education at a state college wants to examine the effect of
cooperative education job experience on marketability in the work place. She takes a
random sample of 4 students. For these 4, she finds out how many times each had a
cooperative education job and how many job offers they received upon graduation.
These data are presented in the table below.
Referring to Table 13-3, suppose the director of cooperative education wants to
construct a 95% prediction interval for the number of job offers received by a student
who has had exactly two cooperative education jobs. The t critical value she would use
is ________.
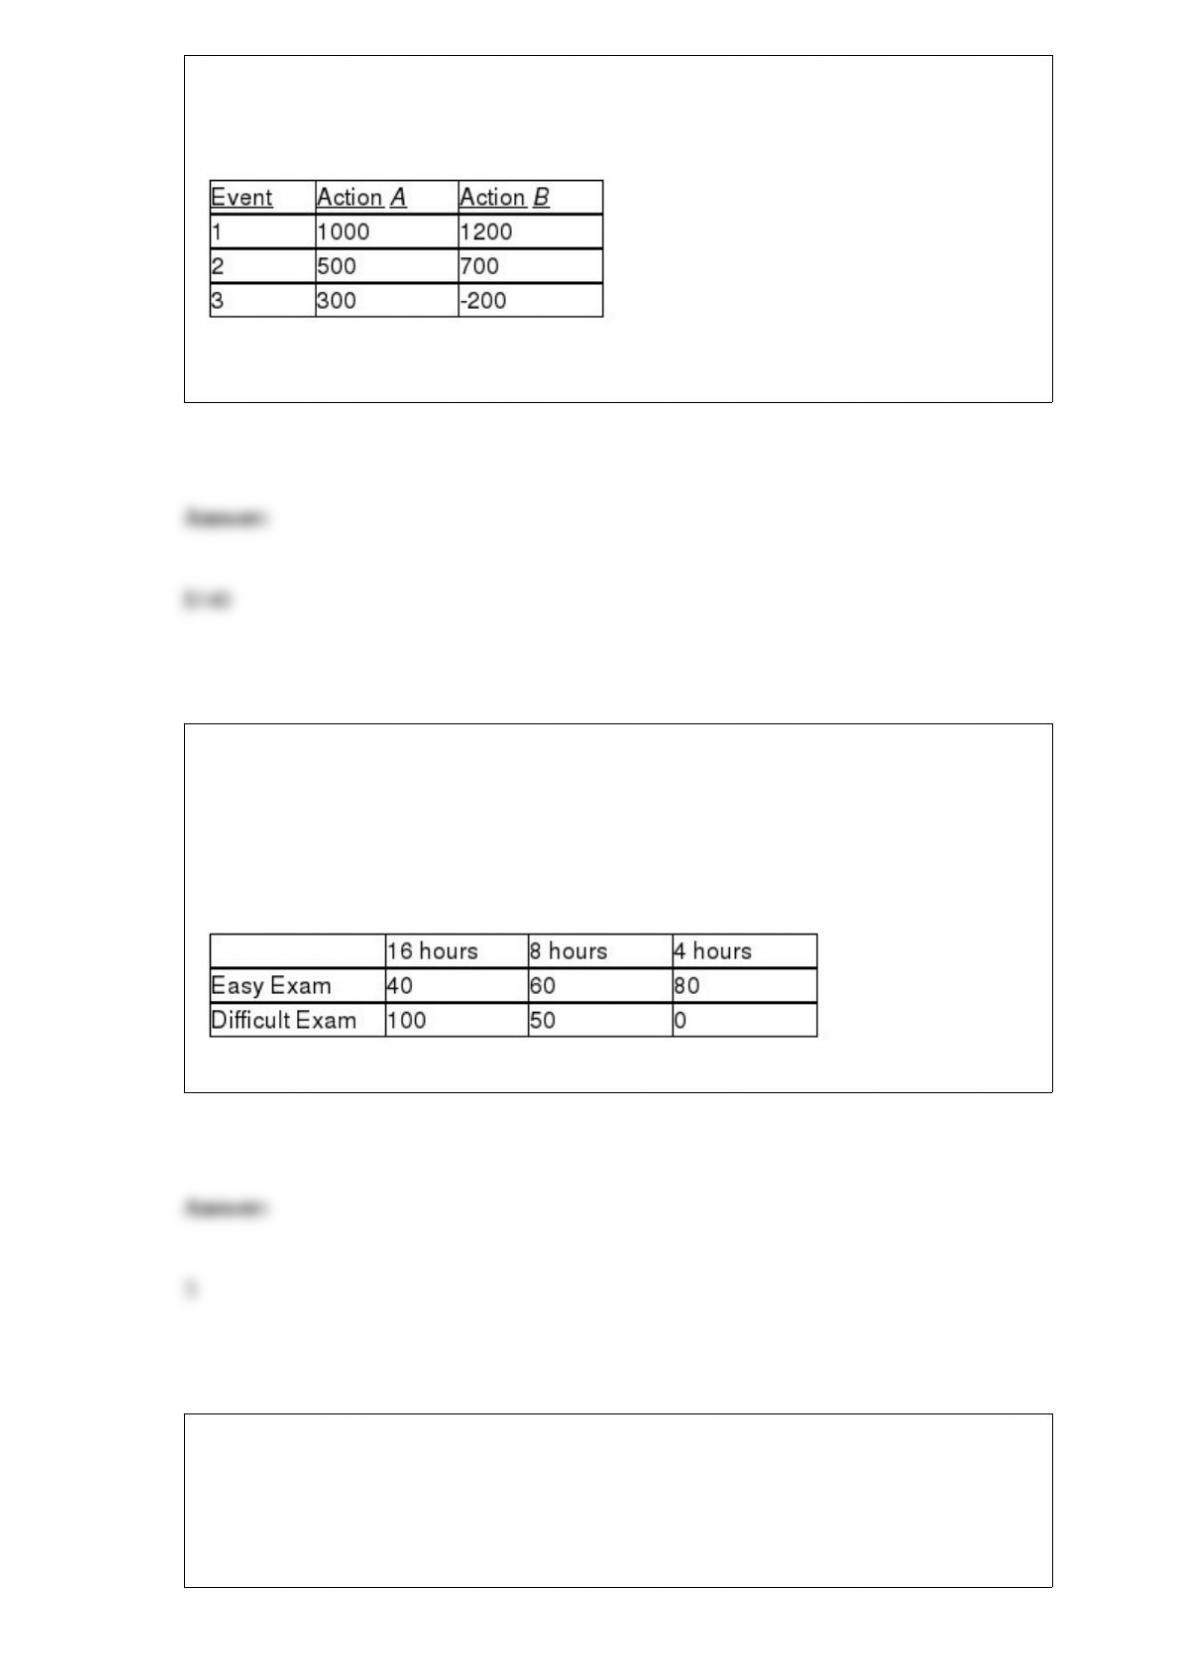
TABLE 19-5
The following payoff table shows profits associated with a set of 2 alternatives under 3
possible events.
Suppose that the probability of Event 1 is 0.2, Event 2 is 0.5, and Event 3 is 0.3.
Referring to Table 19-5, what is the EOL for Action A?
TABLE 19-6
A student wanted to find out the optimal strategy to study for a Business Statistics
exam. He constructed the following payoff table based on the mean amount of time he
needed to study every week for the course and the degree of difficulty of the exam.
From the information that he gathered from students who had taken the course, he
concluded that there was a 40% probability that the exam would be easy.
Referring to Table 19-6, how many possible courses of action are there?
Referring to Table 14-6, ________% of the variation in heating cost can be explained
by the variation in minimum outside temperature while holding the amount of
insulation constant.
TABLE 14-6
One of the most common questions of prospective house buyers pertains to the cost of
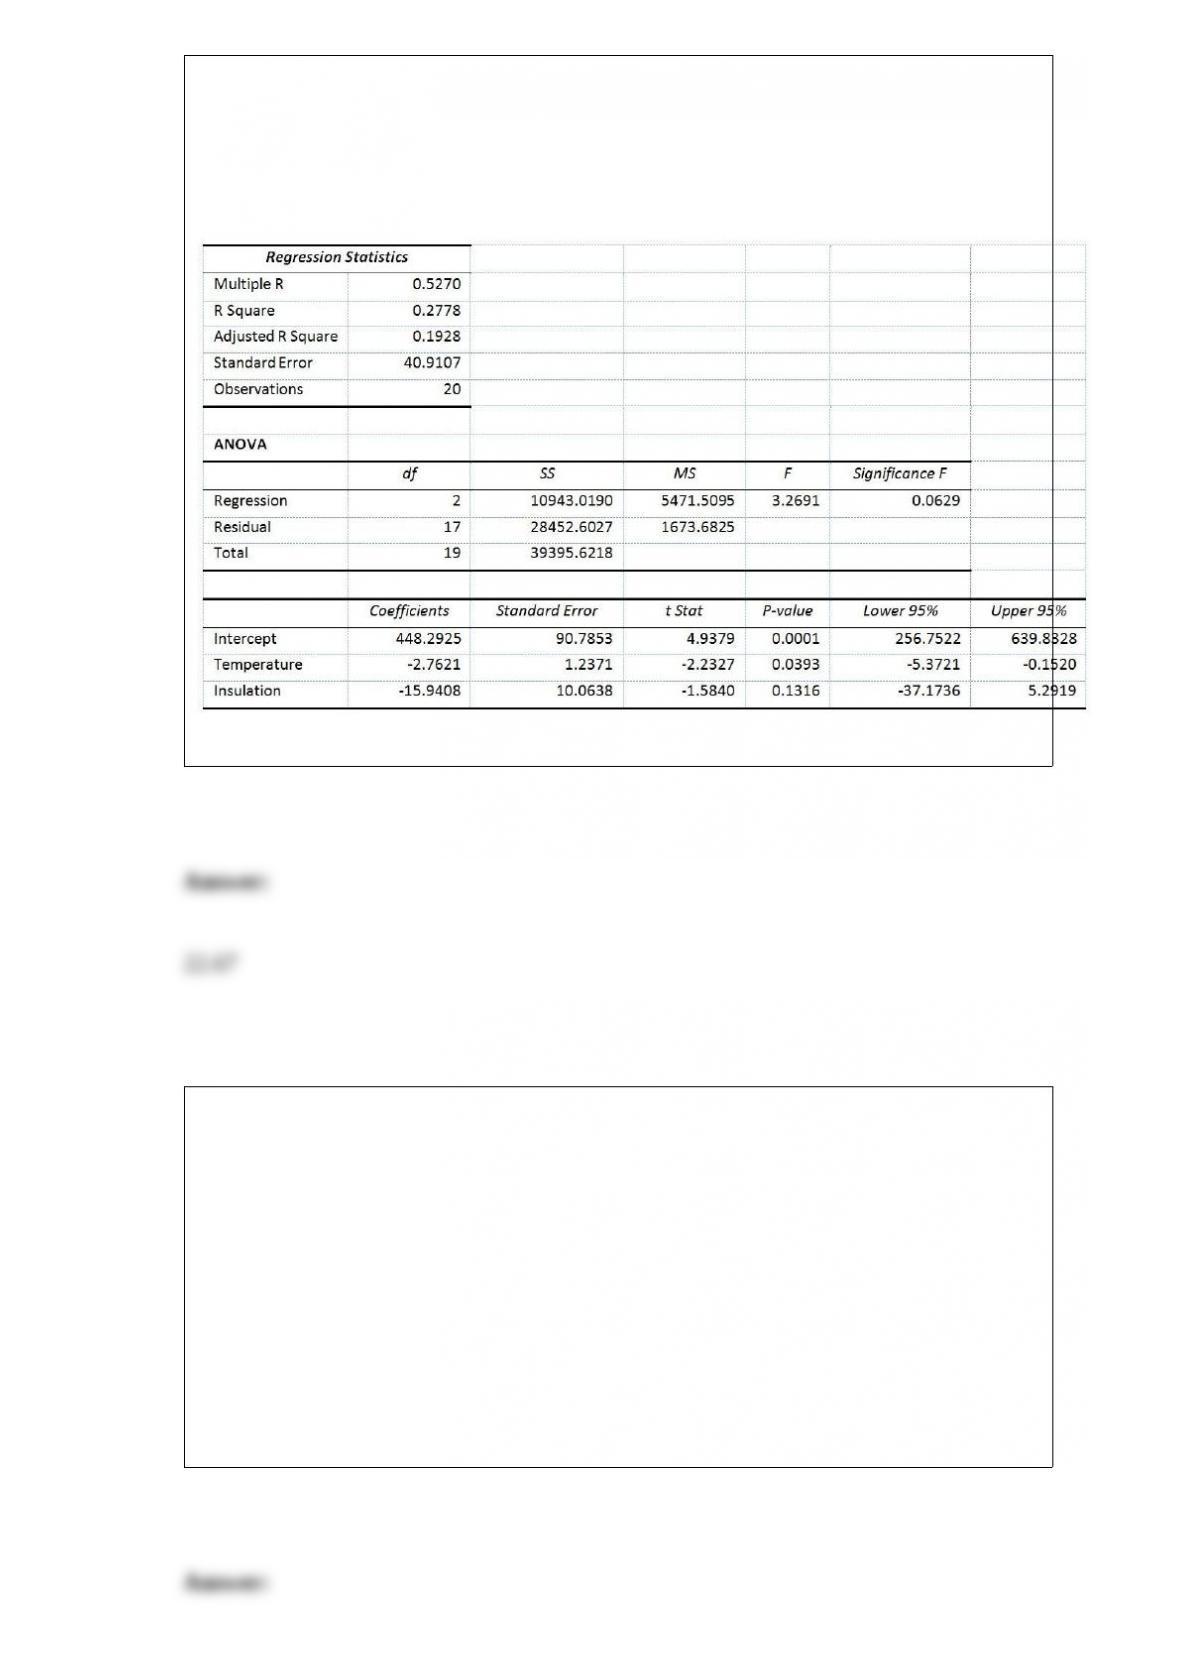
heating in dollars (Y). To provide its customers with information on that matter, a large
real estate firm used the following 2 variables to predict heating costs: the daily
minimum outside temperature in degrees of Fahrenheit (X1) and the amount of
insulation in inches (X2). Given below is EXCEL output of the regression model.
Also SSR (X1∣ X2) = 8343.3572 and SSR (X2∣ X1) = 4199.2672
TABLE 8-10
A sales and marketing management magazine conducted a survey on salespeople
cheating on their expense reports and other unethical conduct. In the survey on 200
managers, 58% of the managers have caught salespeople cheating on an expense report,
50% have caught salespeople working a second job on company time, 22% have caught
salespeople listing a ‘strip bar” as a restaurant on an expense report, and 19% have
caught salespeople giving a kickback to a customer.
Referring to Table 8-10, the critical value for a 95% confidence interval estimate of the
population proportion of managers who have caught salespeople cheating on an
expense report is ________.

An Undergraduate Study Committee of 6 members at a major university is to be formed
from a pool of faculty of 18 men and 6 women. If the committee members are chosen
randomly, what is the probability that all of the members will be men?
TABLE 10-6
To investigate the efficacy of a diet, a random sample of 16 male patients is selected
from a population of adult males using the diet. The weight of each individual in the
sample is taken at the start of the diet and at a medical follow-up 4 weeks later.
Assuming that the population of differences in weight before versus after the diet
follow a normal distribution, the t-test for related samples can be used to determine if
there was a significant decrease in the mean weight during this period. Suppose the
mean decrease in weights over all 16 subjects in the study is 3.0 pounds with the
standard deviation of differences computed as 6.0 pounds.
Referring to Table 10-6, what is the 99% confidence interval estimate for the mean
difference in weight before and after the diet?
TABLE 17-5
You worked as an intern at We Always Win Car Insurance Company last summer. You
notice that individual car insurance premiums depend very much on the age of the
individual, the number of traffic tickets received by the individual, and the population
density of the city in which the individual lives. You performed a regression analysis in
EXCEL and obtained the following information:
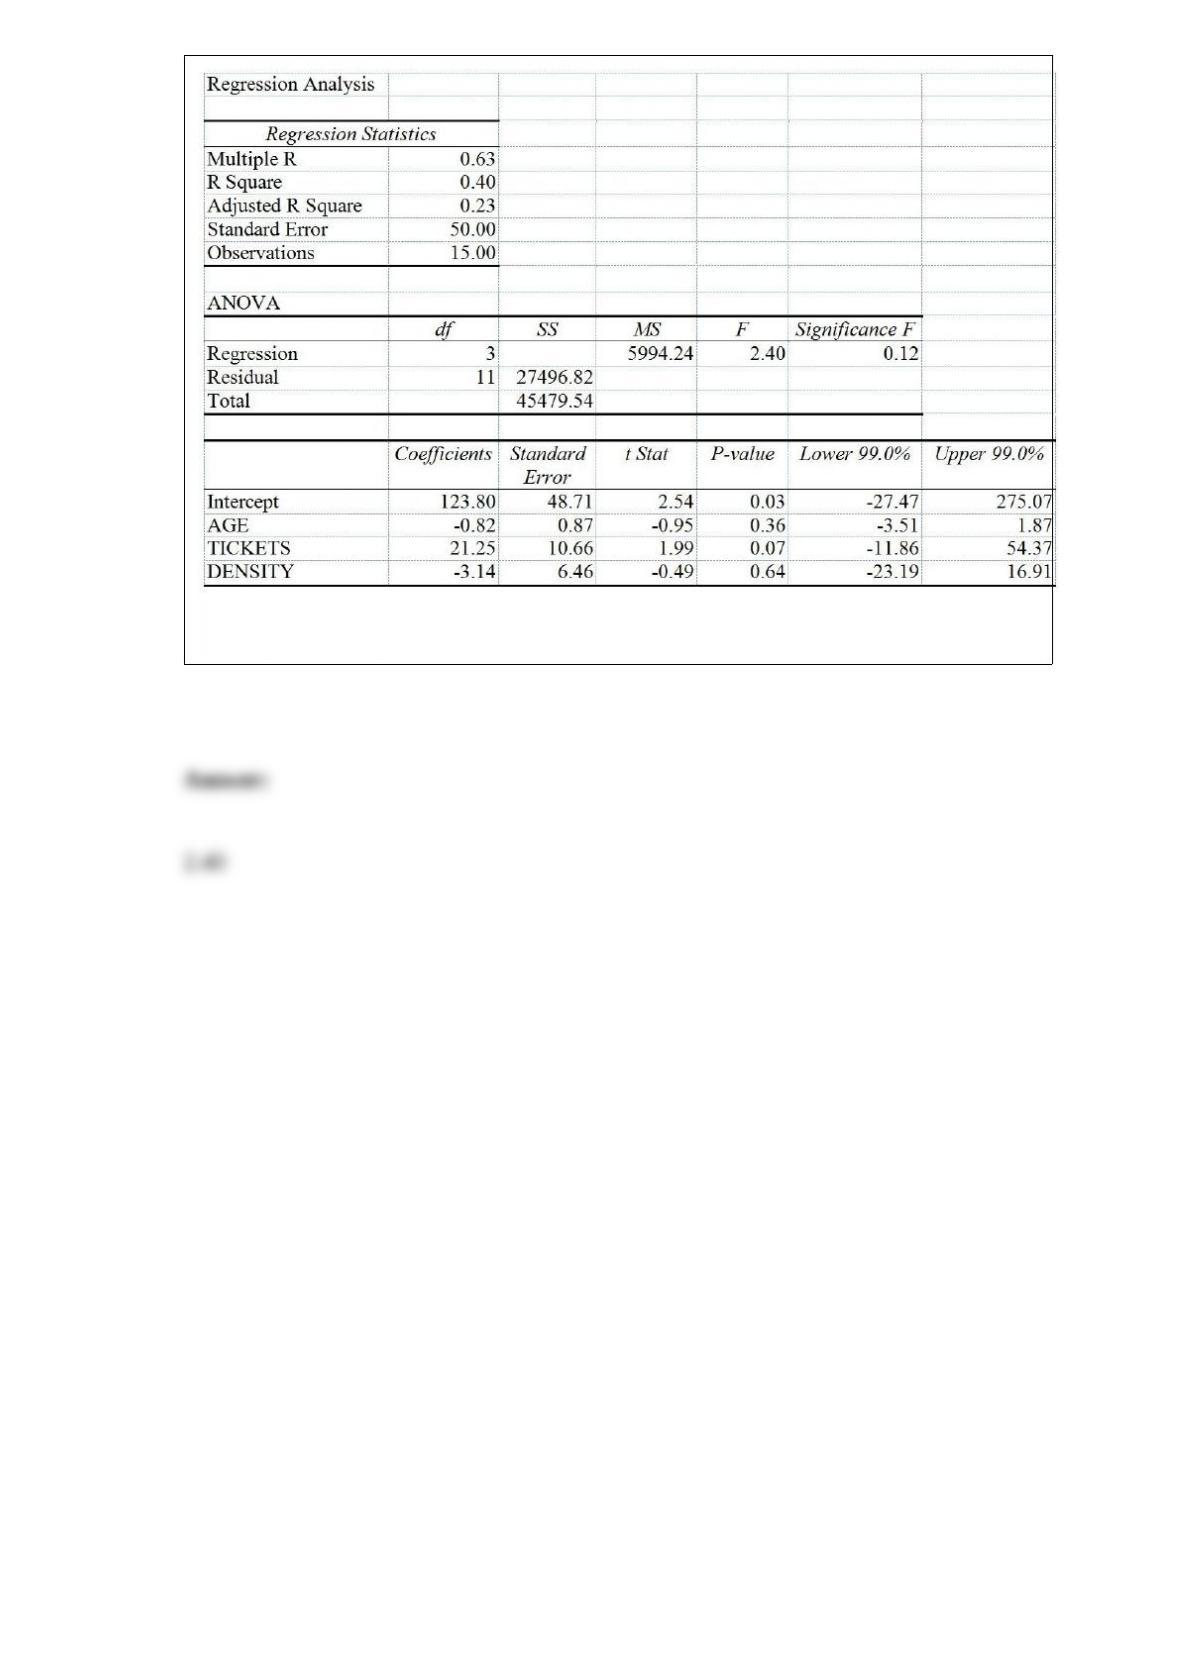
Referring to Table 17-5, to test the significance of the multiple regression model, the
value of the test statistic is ________.