The amount of time necessary for assembly line workers to complete a product is a
normal variable with a mean of 15 minutes and a standard deviation of 2 minutes. So,
15% of the products require more than ________ minutes for assembly.
TABLE 4-6
At a Texas college, 60% of the students are from the southern part of the state, 30% are
from the northern part of the state, and the remaining 10% are from out-of-state. All
students must take and pass an Entry
Referring to Table 4-6, the probability that a randomly selected student is not from
southern Texas and has not passed the ELM is ________.
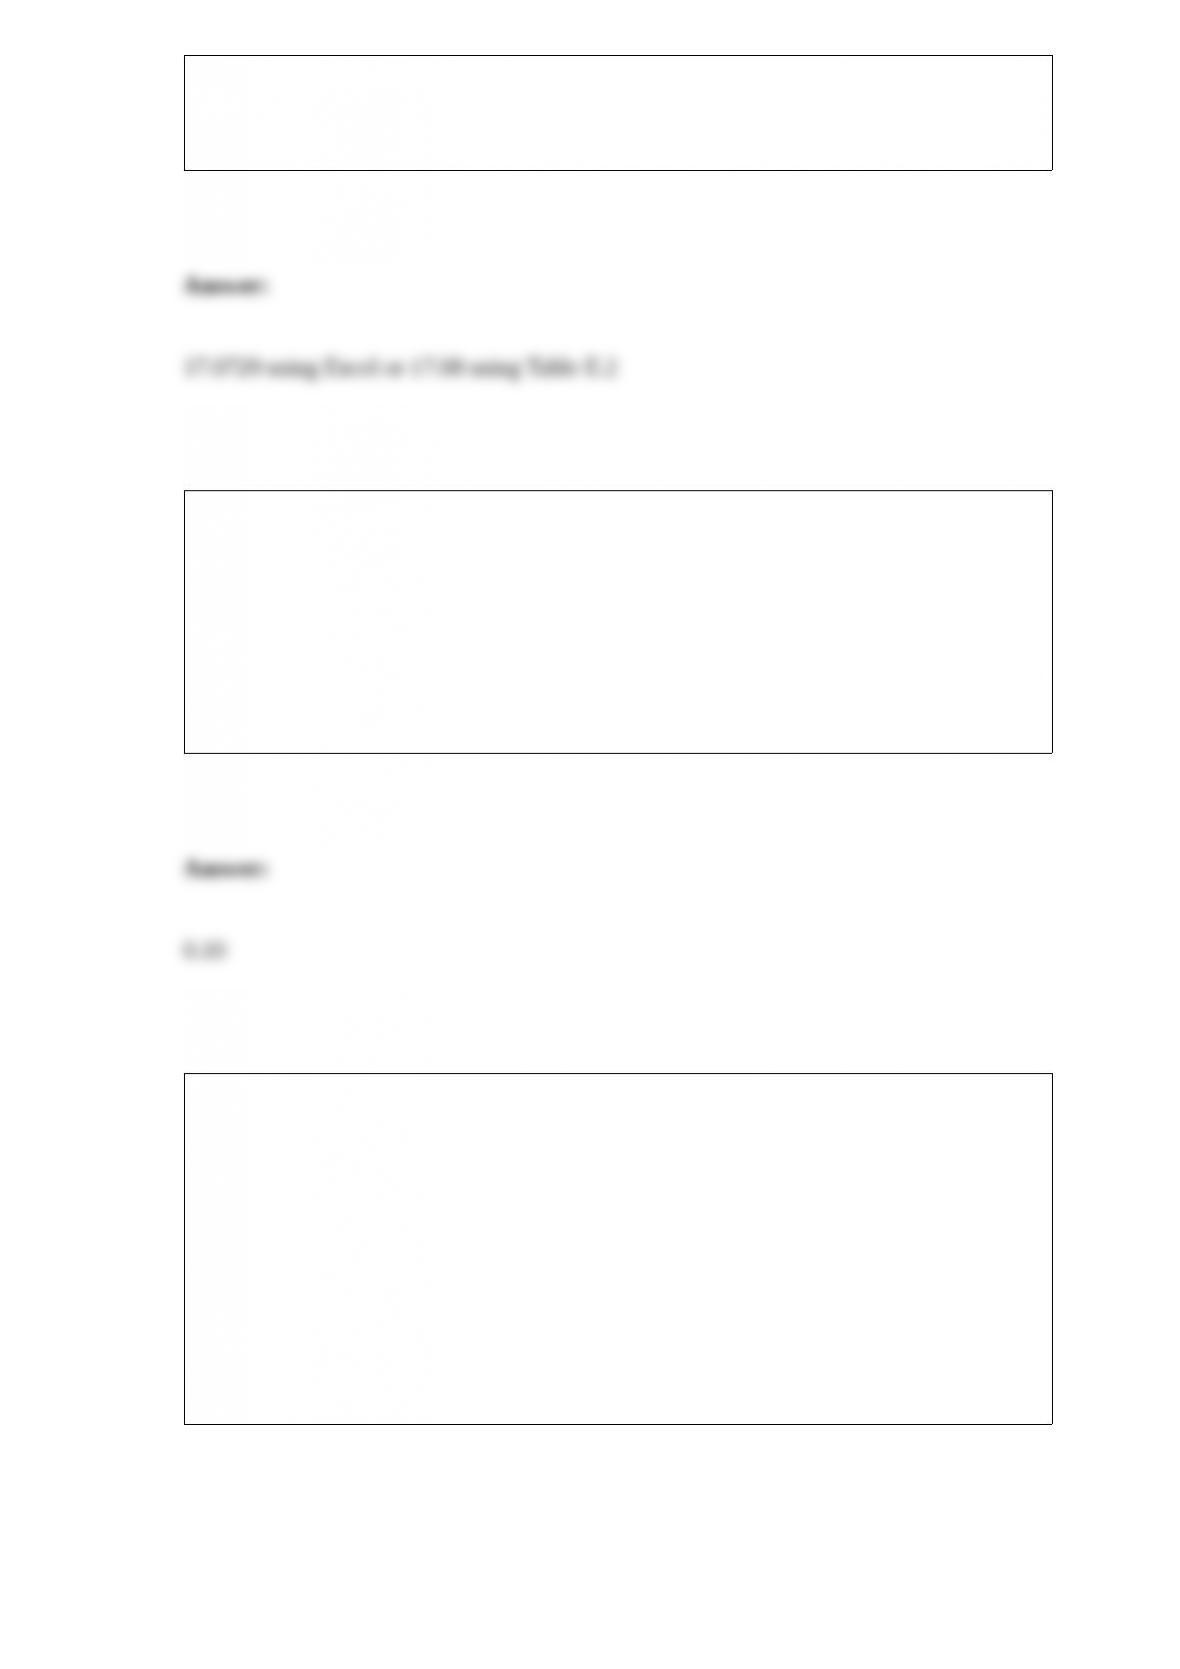
TABLE 11-11
A student team in a business statistics course designed an experiment to investigate
whether the brand of bubblegum used affected the size of bubbles they could blow. To
reduce the person-to-person variability, the students decided to use a randomized block
design using themselves as blocks.
Four brands of bubblegum were tested. A student chewed two pieces of a brand of gum
and then blew a bubble, attempting to make it as big as possible. Another student
measured the diameter of the bubble at its biggest point. The following table gives the
diameters of the bubbles (in inches) for the 16 observations.
Referring to Table 11-11, what is the value of the F test statistic for testing the block
effects?
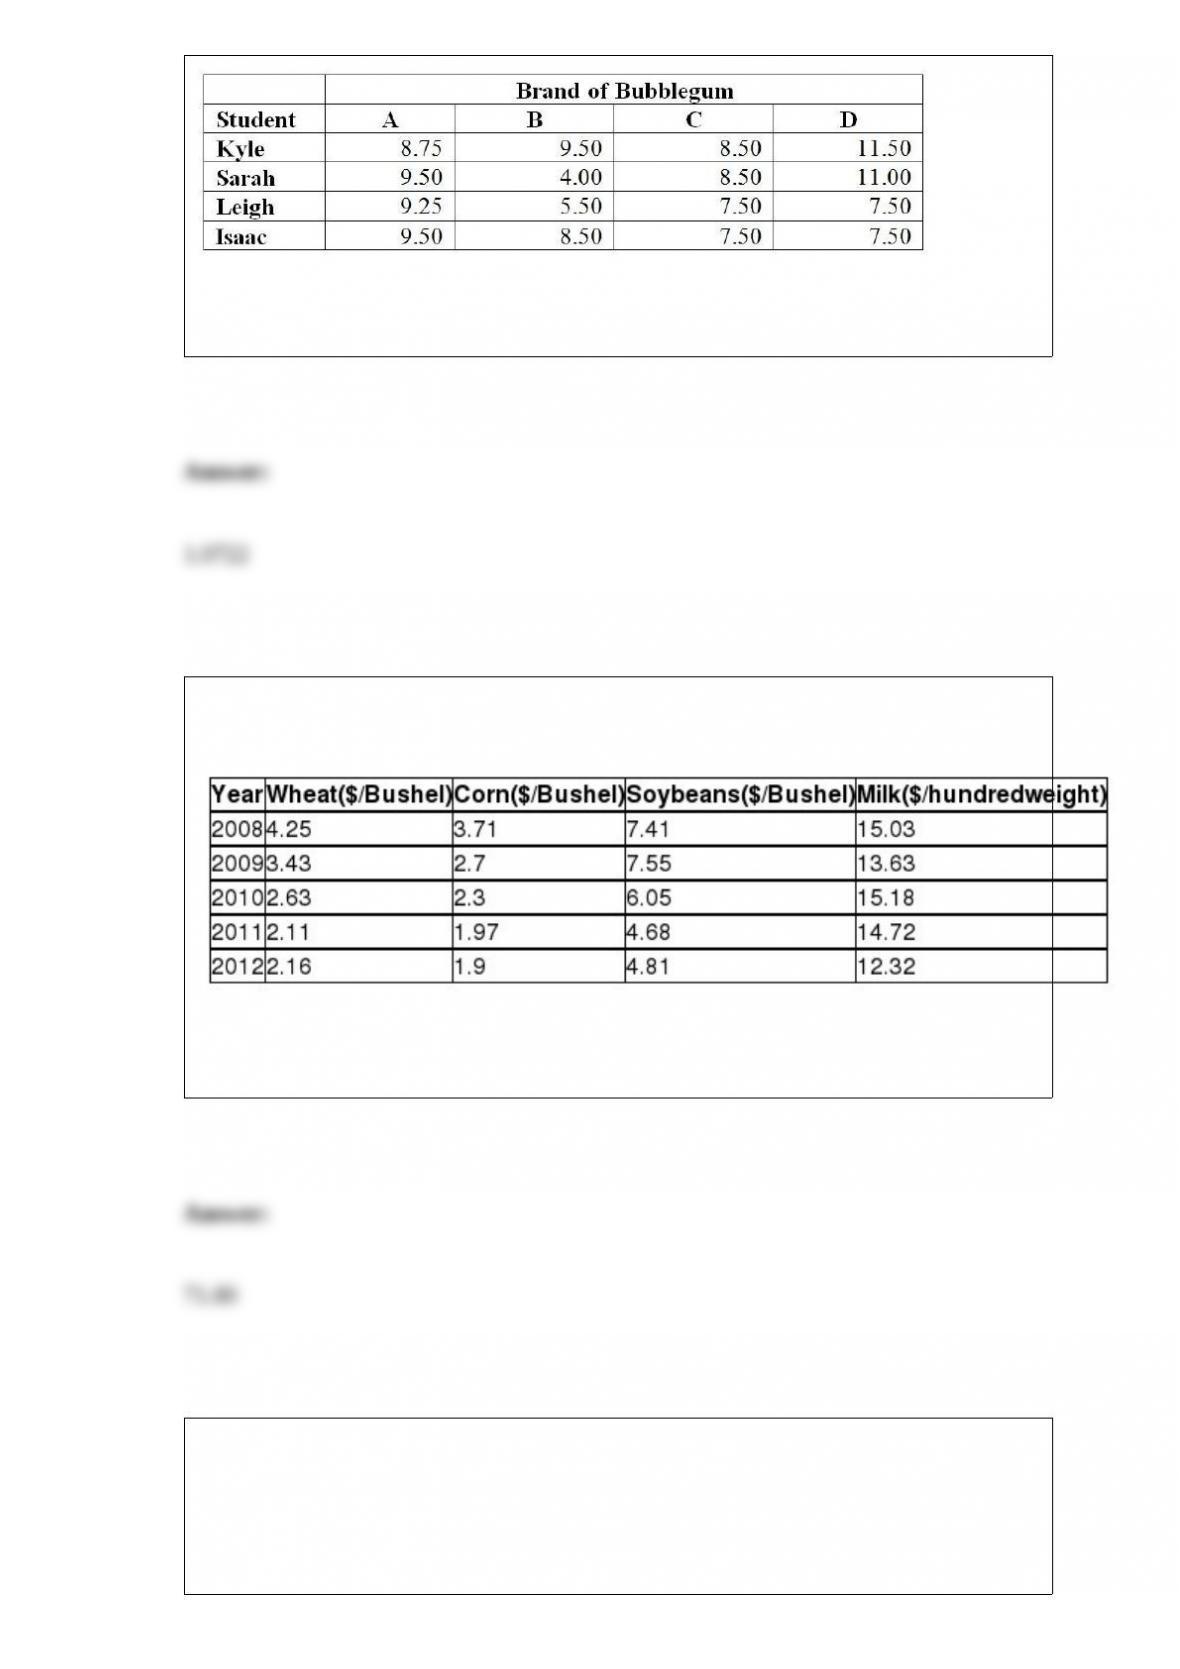
TABLE 16-16
Given below are the prices of a basket of four food items from 2008 to 2012.
Referring to Table 16-16, what is the Paasche price index for the basket of four food
items in 2012 that consisted of 40 bushels of wheat, 50 bushels of corn, 35 bushels of
soybeans and 60 hundredweight of milk in 2012 using 2008 as the base year?
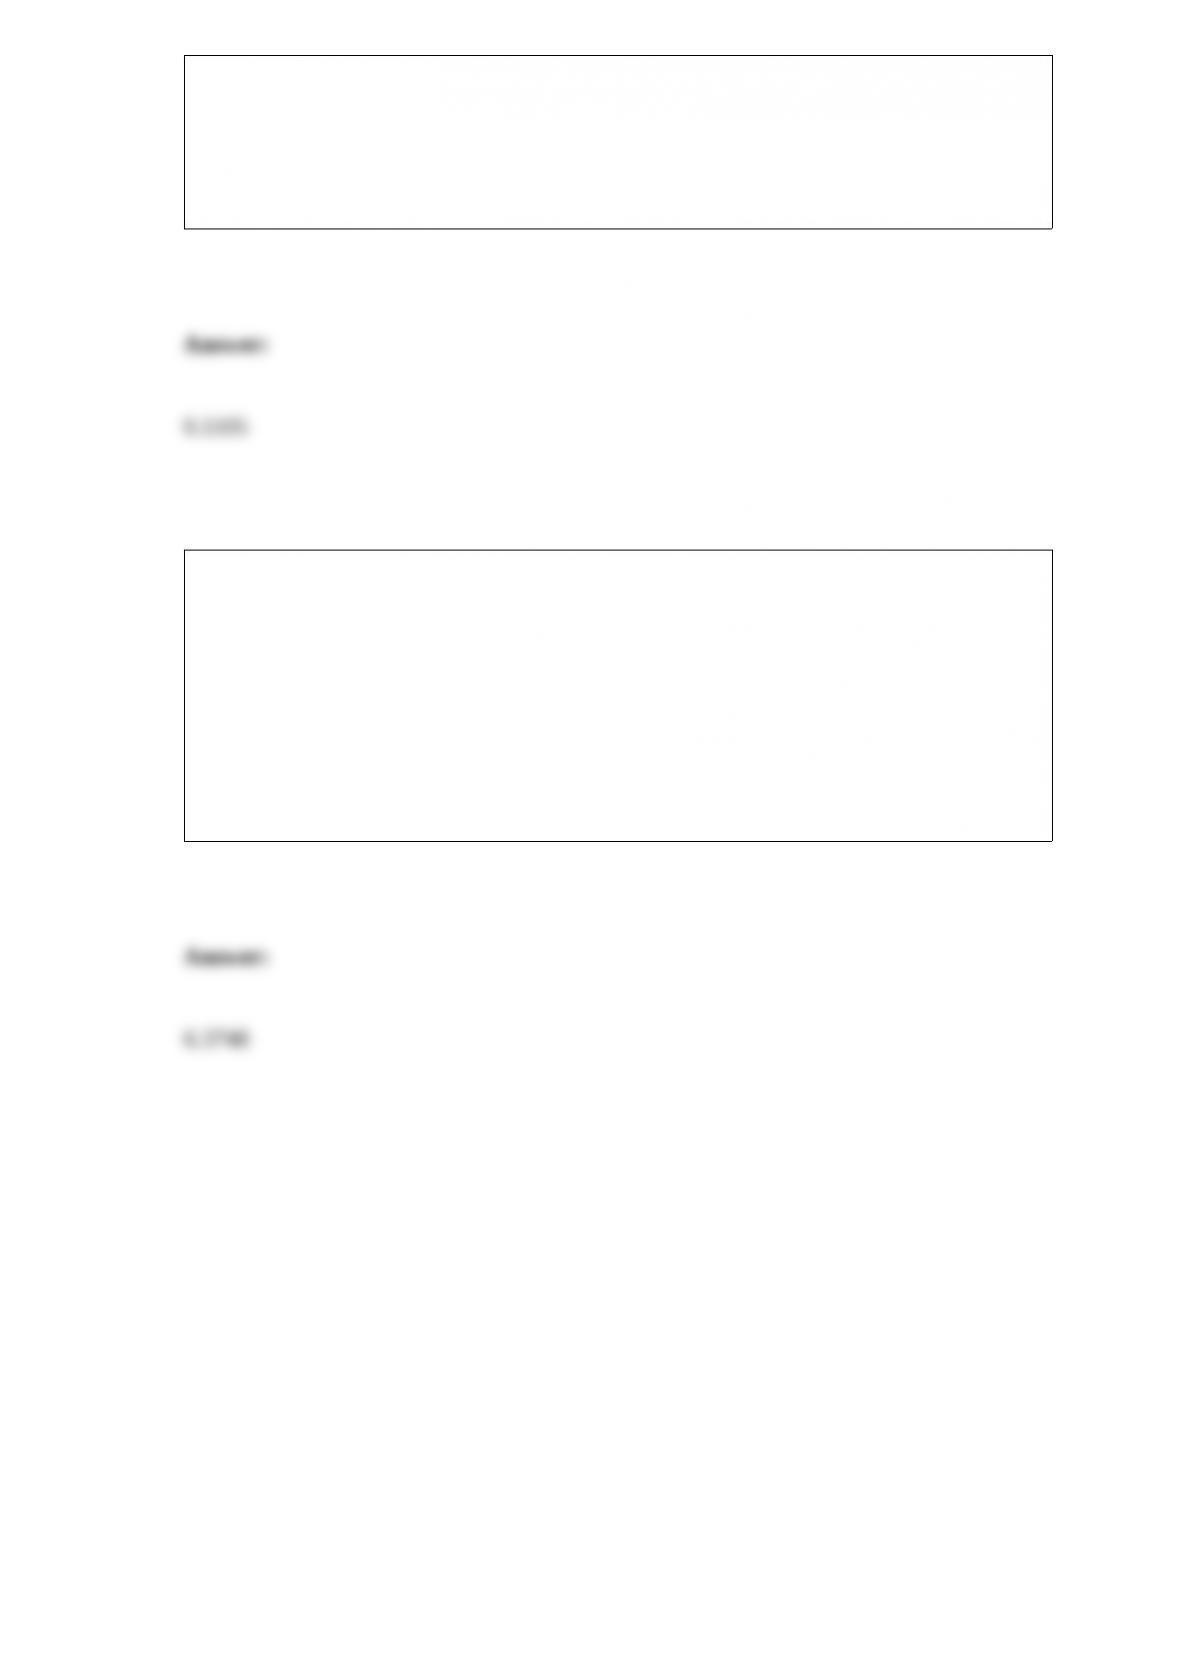
Referring to Table 14-16, what is the p-value of the test statistic to
determine whether engine size makes a signiticant contribution to the
regression model in the presence of the other independent variable at
a 5% level of signiticance?

TABLE 14-16
What are the factors that determine the acceleration time (in sec.)
from 0 to 60 miles per hour of a car? Data on the following variables
for 30 di.erent vehicle models were collected:
Y (Accel Time): Acceleration time in sec.
X1 (Engine Size): c.c.
X2 (Sedan): 1 if the vehicle model is a sedan and 0 otherwise
The regression results using acceleration time as the dependent
variable and the remaining variables as the independent variables are
presented below.
The various residual plots are as shown below.

The coefficient of partial determinations and are 0.3301,
and 0.0594, respectively.
The coefficient of determination for the regression model using each
of the 2 independent variables as the dependent variable and the
other independent variable as independent variables ( ) are,
respectively 0.0077, and 0.0077.
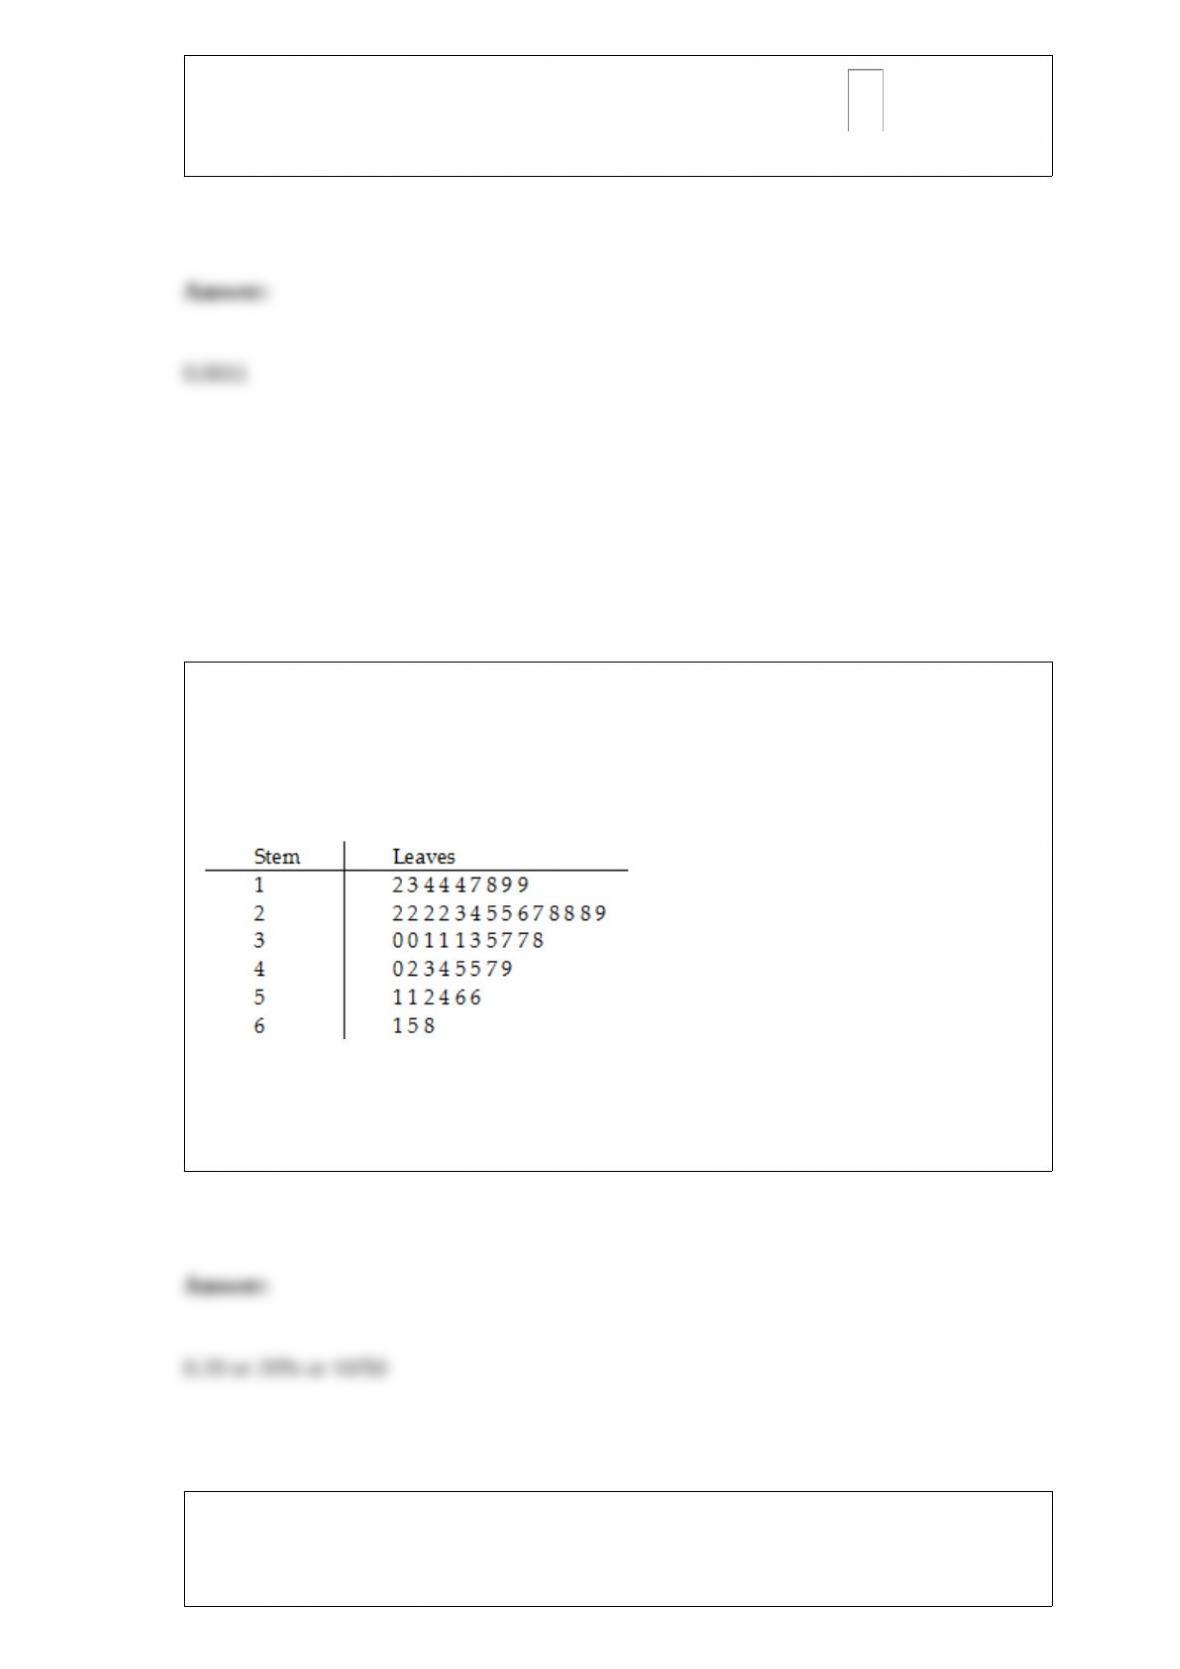
TABLE 2-7
The Stem-and-Leaf display below contains data on the number of months between the
date a civil suit is filed and when the case is actually adjudicated for 50 cases heard in
superior court.
Referring to Table 2-7, if a frequency distribution with equal sized classes was made
from this data, and the first class was “10 but less than 20,” the relative frequency of the
third class would be ________.
TABLE 5-9
A major hotel chain keeps a record of the number of mishandled bags per 1,000
customers. In a recent year, the hotel chain had 4.06 mishandled bags per 1,000
customers. Assume that the number of mishandled bags has a Poisson distribution.
Referring to Table 5-9, what is the probability that in the next 1,000 customers, the
hotel chain will have less than two or more than eight mishandled bags?
TABLE 7-7
Times spent studying by students in the week before final exams follow a normal
distribution with standard deviation 8 hours. A random sample of 4 students was taken
from a population of 50 in order to estimate the mean study time for the population of
all students. Use the finite population correction.
Referring to Table 7-7, 5% of all the samples of 4 will have a sample mean of at least
how many hours above the population mean?