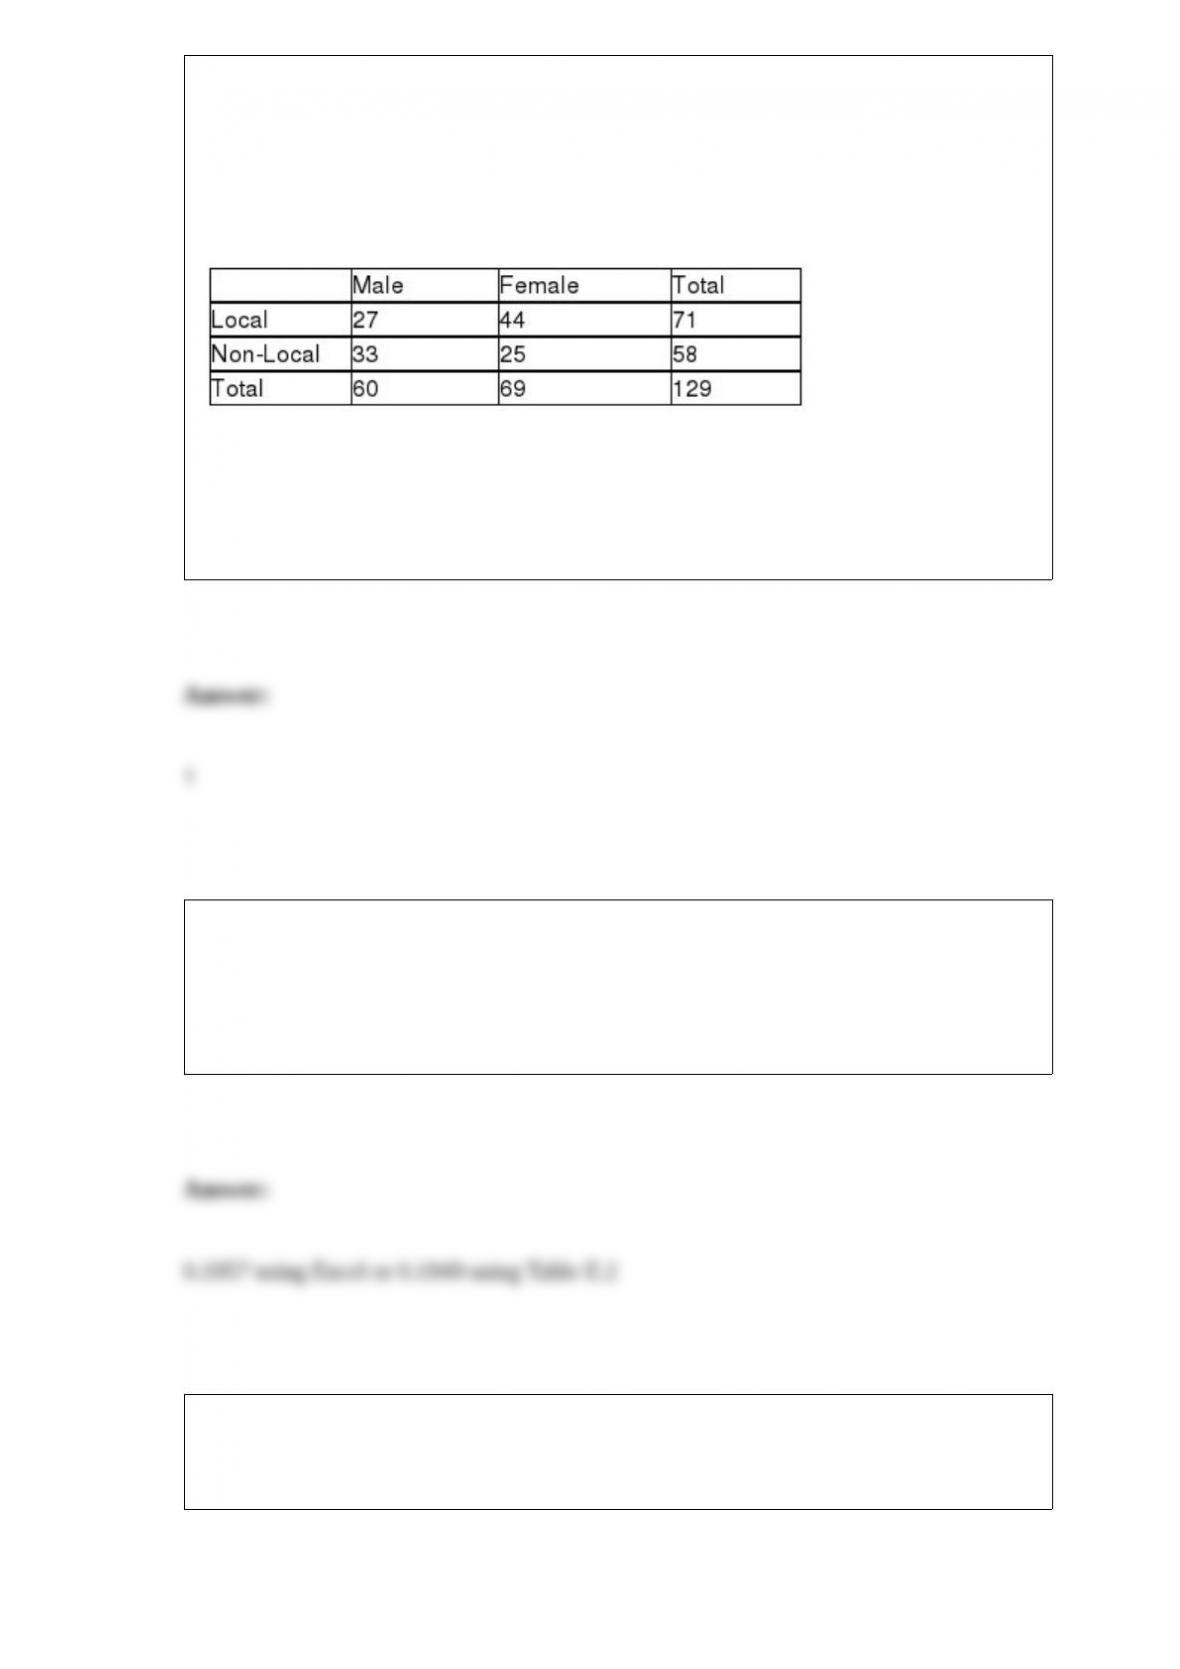
TABLE 12-3
The director of transportation of a large company is interested in the usage of her van
pool. She considers her routes to be divided into local and non-local. She is particularly
interested in learning if there is a difference in the proportion of males and females who
use the local routes. She takes a sample of a day’s riders and finds the following:
She will use this information to perform a chi-square hypothesis test using a level of
significance of 0.05.
Referring to Table 12-3, the test will involve ________ degree(s) of freedom.
A company that sells annuities must base the annual payout on the probability
distribution of the length of life of the participants in the plan. Suppose the probability
distribution of the lifetimes of the participants is approximately a normal distribution
with a mean of 68 years and a standard deviation of 3.5 years. What proportion of the
plan recipients die before they reach the standard retirement age of 65?
TABLE 16-13
Given below is the monthly time-series data for U.S. retail sales of building materials
over a specific year.
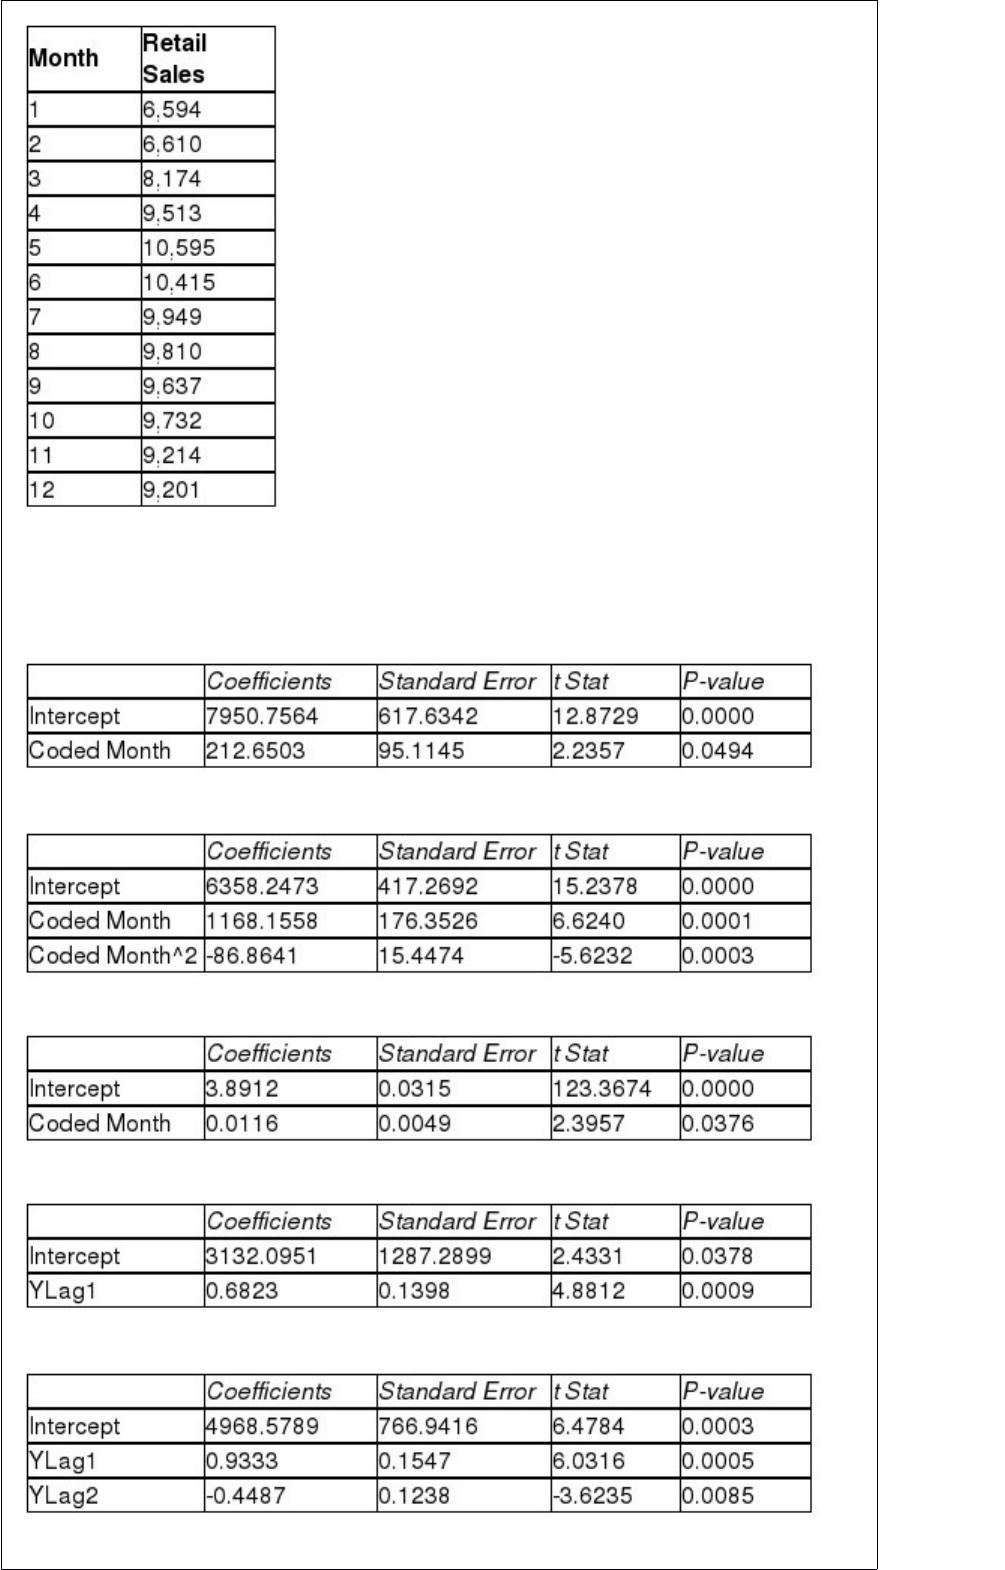
The results of the linear trend, quadratic trend, exponential trend, first-order
autoregressive, second-order autoregressive and third-order autoregressive model are
presented below in which the coded month for the 1st month is 0:
Linear trend model:
Quadratic trend model:
Exponential trend model:
First-order autoregressive:
Second-order autoregressive:
Third-order autoregressive:
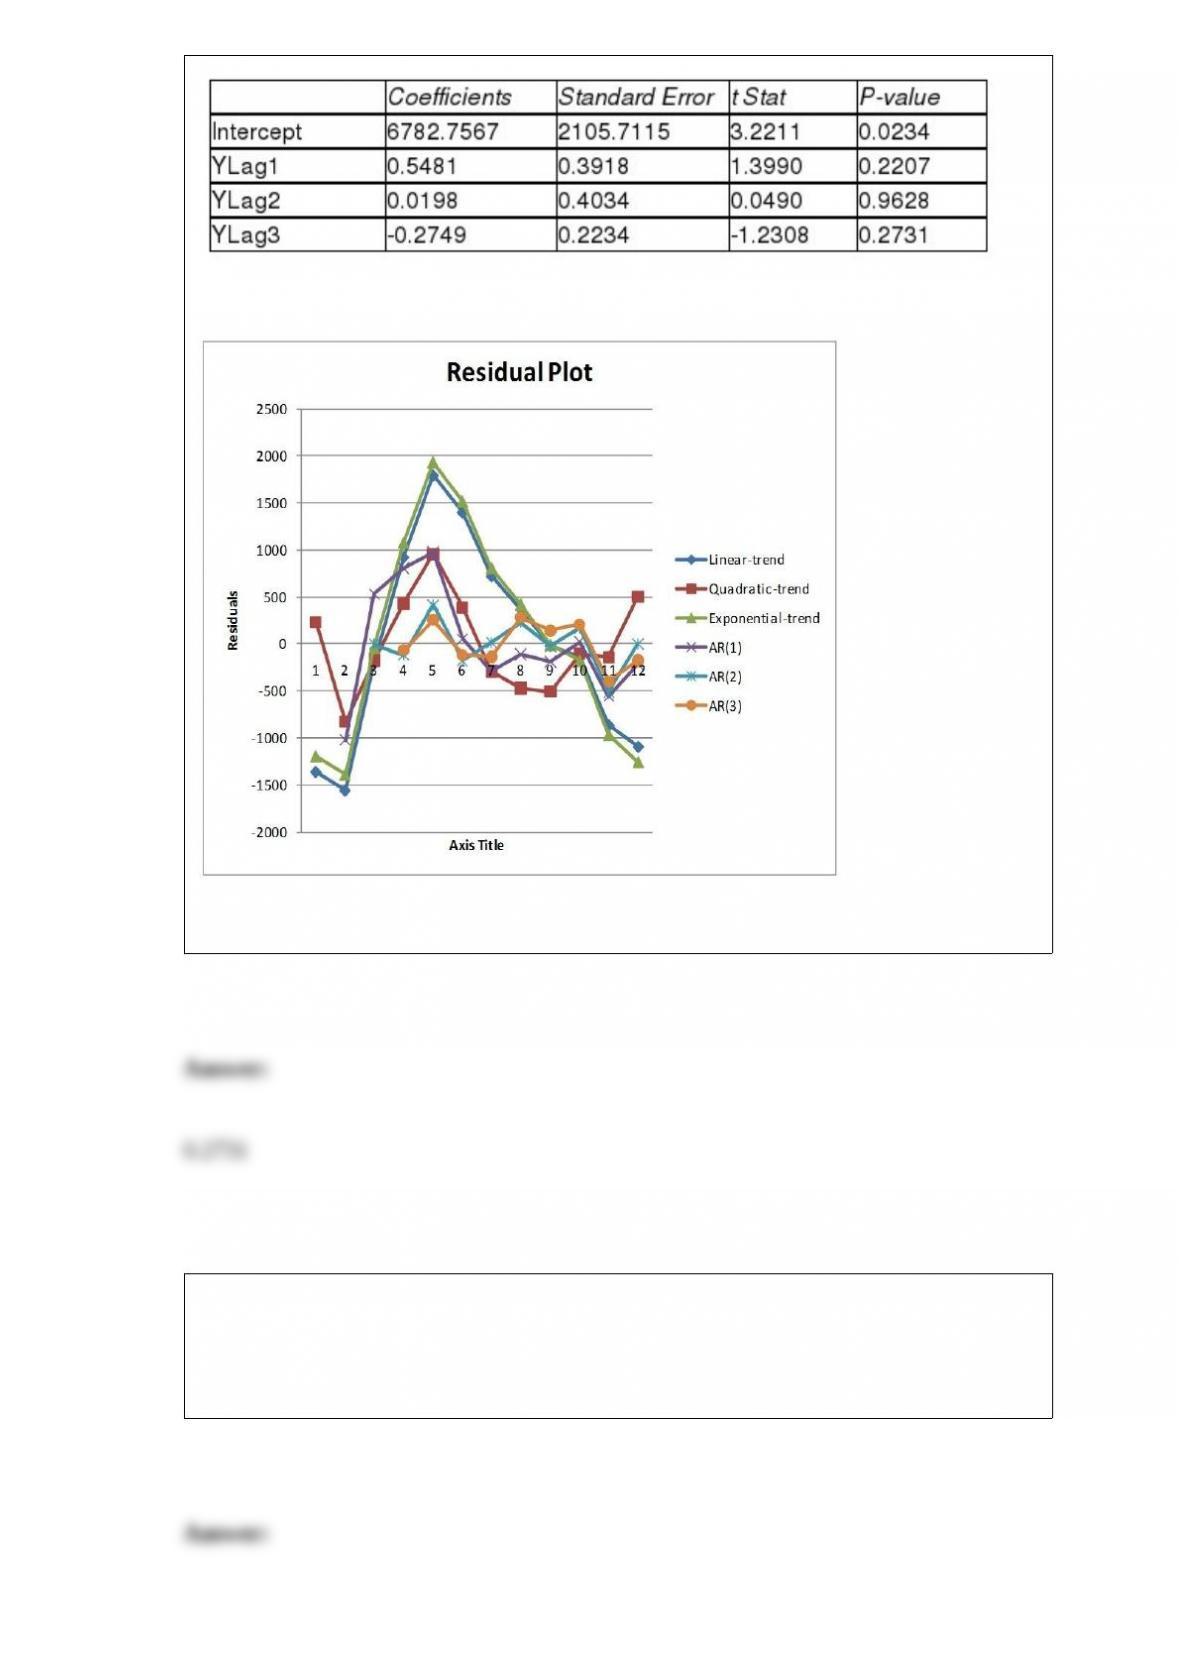
Below is the residual plot of the various models:
Referring to Table 16-13, what is the p-value of the t test statistic for testing the
appropriateness of the third-order autoregressive model?
The county clerk wants to estimate the proportion of voters who will need special
election facilities. The clerk wants to construct a 95% confidence interval for the
population proportion which extends at most 0.07 to either side of the sample
proportion. How large a sample must be taken to assure these conditions are met?
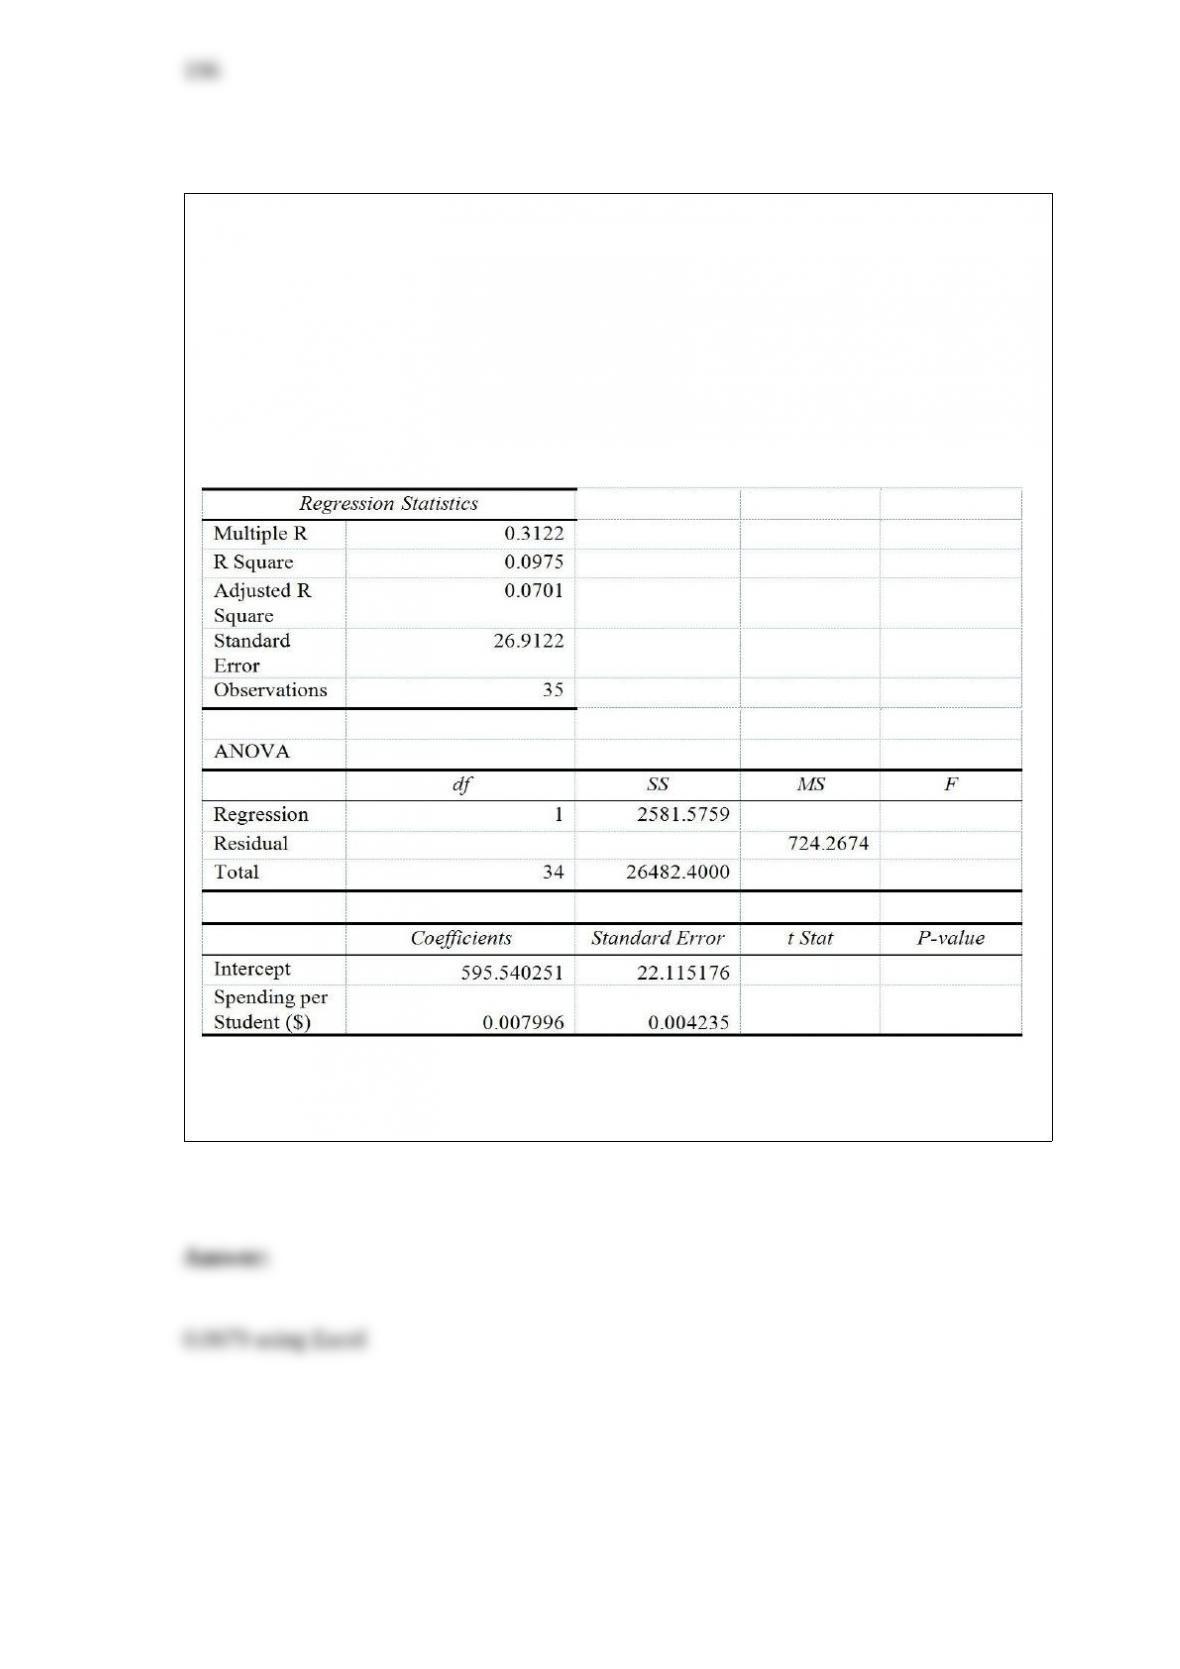
TABLE 13-13
In this era of tough economic conditions, voters increasingly ask the question: “Is the
educational achievement level of students dependent on the amount of money the state
in which they reside spends on education?” The partial computer output below is the
result of using spending per student ($) as the independent variable and composite score
which is the sum of the math, science and reading scores as the dependent variable on
35 states that participated in a study. The table includes only partial results.
Referring to Table 13-13, the p-value of the measured F test statistic to test whether
spending per student affects composite score is ________.