True or False: For a given sample size, the probability of committing a Type II error
will increase when the probability of committing a Type I error is reduced.
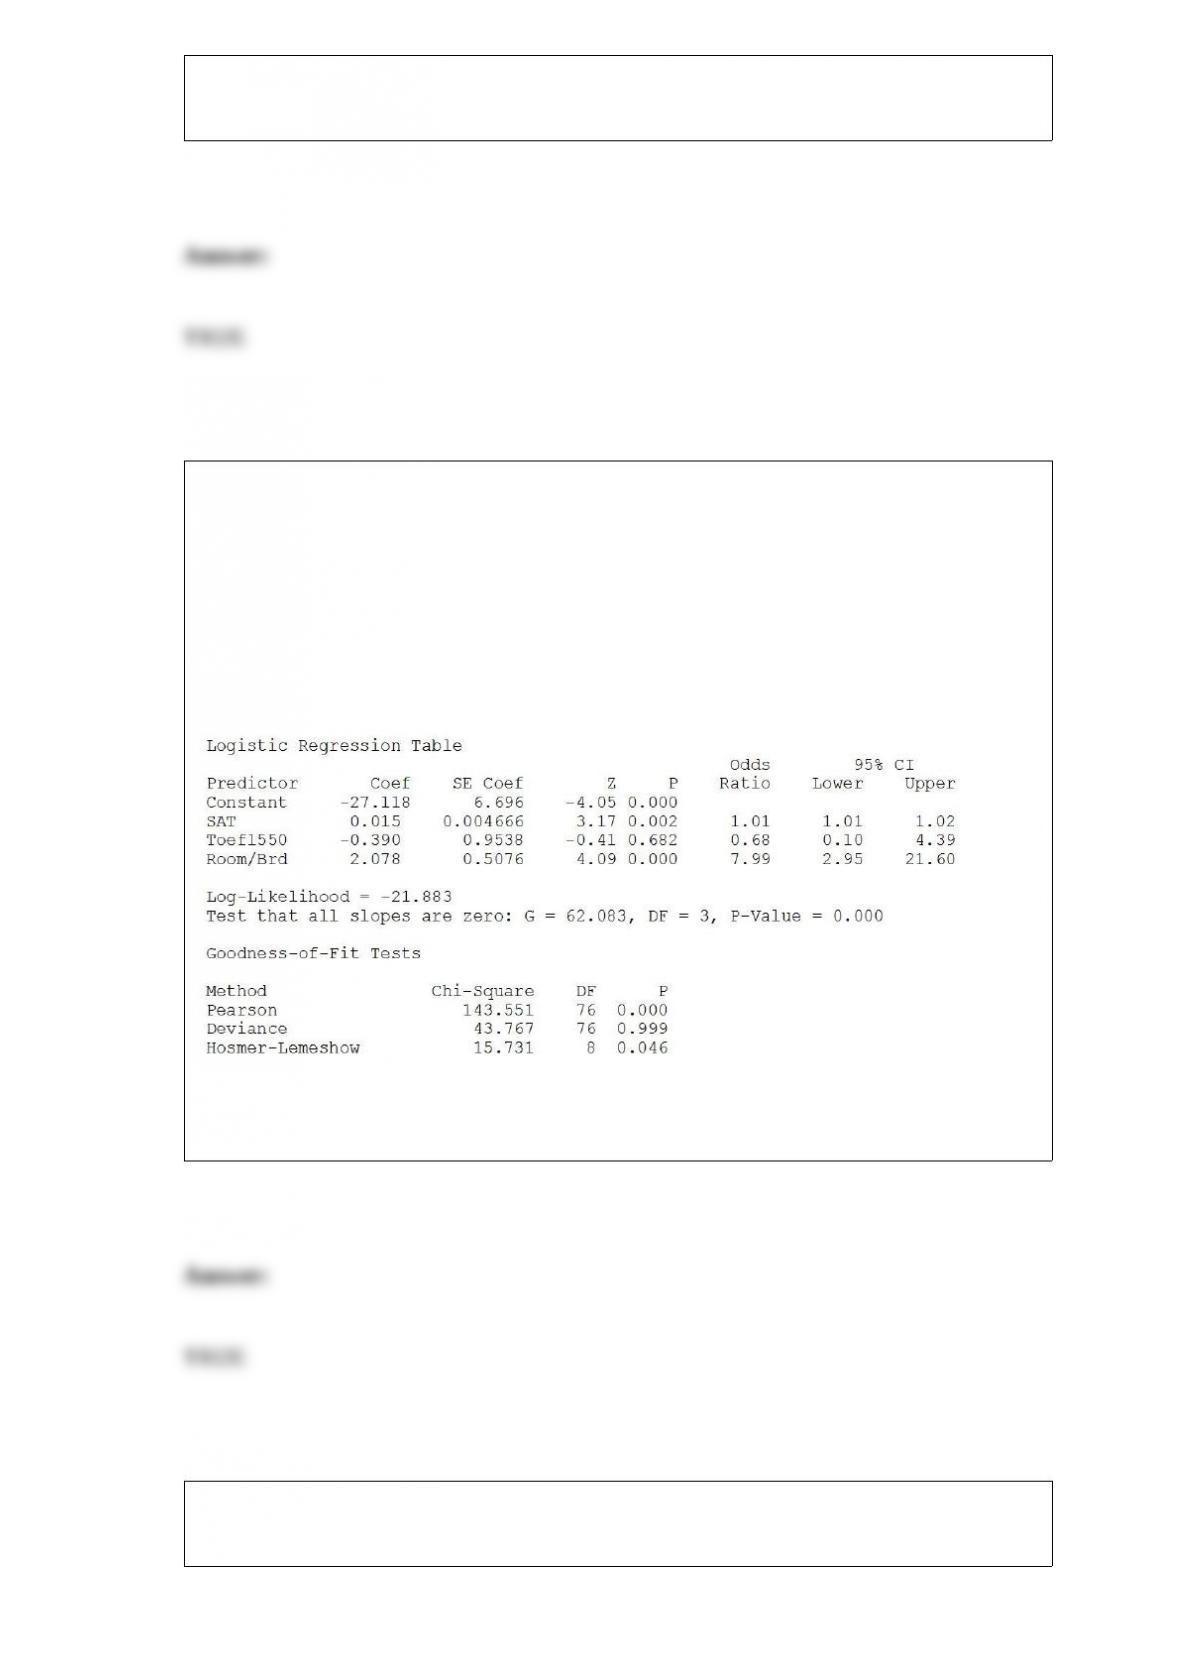
True or False: TABLE 17-11
A logistic regression model was estimated in order to predict the probability that a
randomly chosen university or college would be a private university using information
on mean total Scholastic Aptitude Test score (SAT) at the university or college, the
room and board expense measured in thousands of dollars (Room/Brd), and whether the
TOEFL criterion is at least 550 (Toefl550 = 1 if yes, 0 otherwise.) The dependent
variable, Y, is school type (Type = 1 if private and 0 otherwise).
Referring to Table 17-11, there is not enough evidence to conclude that the model is not
a good-fitting model at a 0.05 level of significance.
True or False: The fact that the sample means are less variable than the population data
can be observed from the standard error of the mean.
True or False: The McNemar test is approximately distributed as a standardized normal
random variable.
True or False: The standardized normal distribution is used to develop a confidence
interval estimate of the population proportion regardless of whether the population
standard deviation is known.
True or False: To ethically advertise a school lottery scheme to try to raise money for
the athletic department, the organizer of the lottery does not need to explicitly specify
the probability of each of the prizes in the lottery.

TABLE 14-15
The superintendent of a school district wanted to predict the
percentage of students passing a sixth-grade proficiency test. She
obtained the data on percentage of students passing the proficiency
test (% Passing), mean teacher salary in thousands of dollars
(Salaries), and instructional spending per pupil in thousands of dollars
(Spending) of 47 schools in the state.
Following is the multiple regression output with Y = % Passing as the
dependent variable, X1 = Salaries and X2 = Spending:
True or False: Referring to Table 14-15, there is suffcient evidence
that at least one of the explanatory variables is related to the
percentage of students passing the proficiency test at a 5% level of
significance.
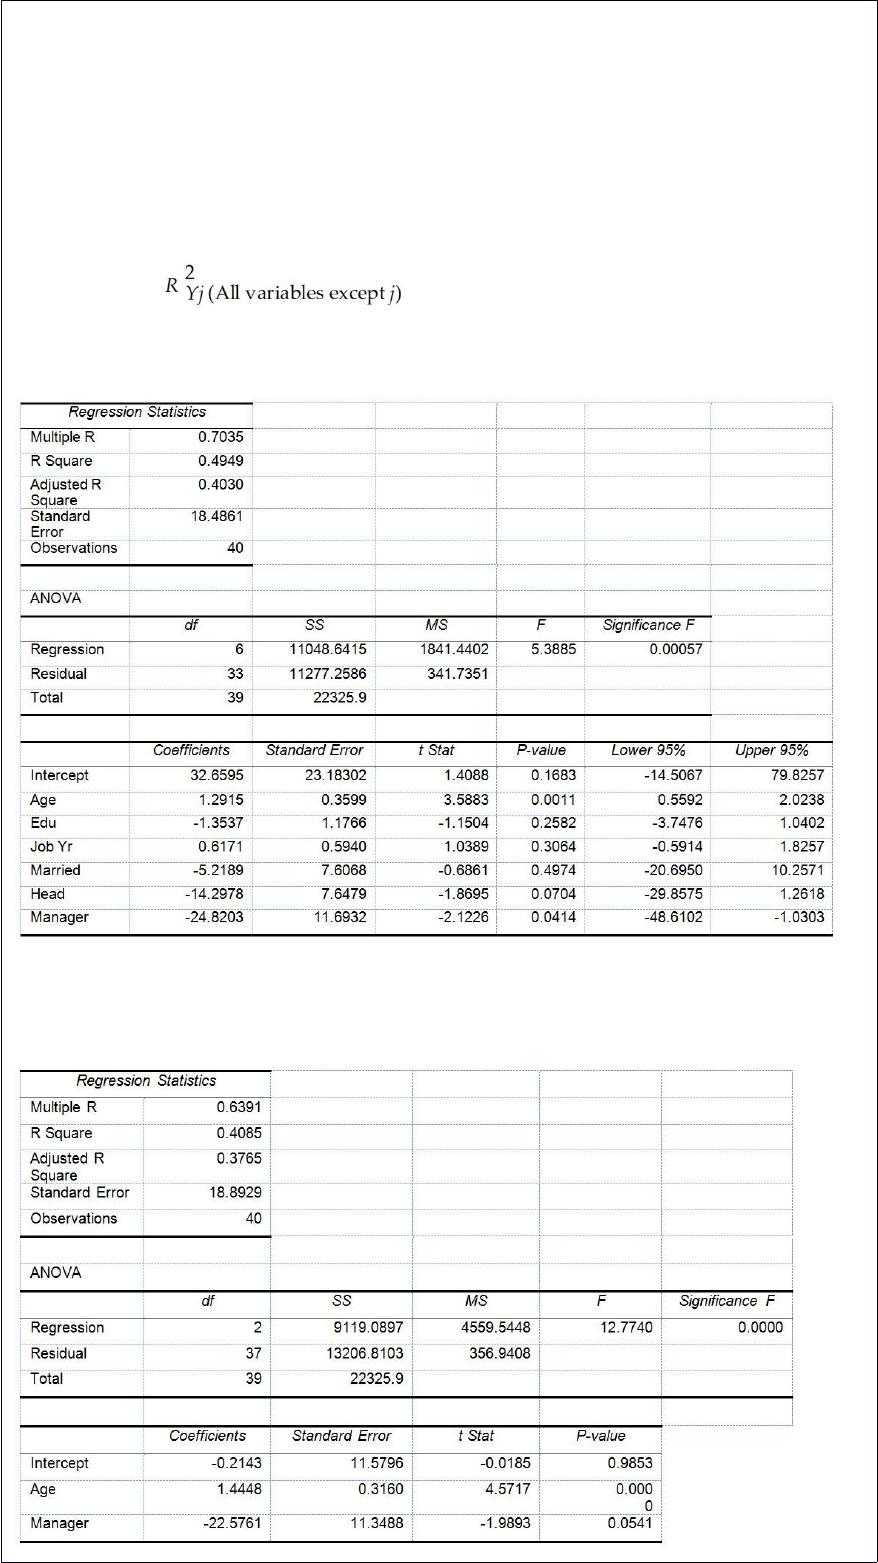
True or False: TABLE 17-10
Given below are results from the regression analysis where the dependent variable is
the number of weeks a worker is unemployed due to a layoff (Unemploy) and the
independent variables are the age of the worker (Age), the number of years of education
received (Edu), the number of years at the previous job (Job Yr), a dummy variable for
marital status (Married: 1 = married, 0 = otherwise), a dummy variable for head of
household (Head: 1 = yes, 0 = no) and a dummy variable for management position
(Manager: 1 = yes, 0 = no). We shall call this Model 1. The coefficient of partial
determination ( ) of each of the 6 predictors are, respectively,
0.2807, 0.0386, 0.0317, 0.0141, 0.0958, and 0.1201.
Model 2 is the regression analysis where the dependent variable is Unemploy and the
independent variables are Age and Manager. The results of the regression analysis are
given below:
Referring to Table 17-10, Model 1, the null hypothesis should be rejected at a 10% level
of significance when testing whether there is a significant relationship between the
number of weeks a worker is unemployed due to a layoff and the entire set of
explanatory variables.
True or False: Some business analytics involve starting with many variables and are
then followed by filtering the data by exploring specific combinations of categorical
values or numerical range. In Excel, this approach is mimicked by using a slicer.
True or False: TABLE 17-8
The superintendent of a school district wanted to predict the percentage of students
passing a sixth-grade proficiency test. She obtained the data on percentage of students
passing the proficiency test (% Passing), daily mean of the percentage of students
attending class (% Attendance), mean teacher salary in dollars (Salaries), and
instructional spending per pupil in dollars (Spending) of 47 schools in the state.
Following is the multiple regression output with Y = % Passing as the dependent
variable, X1 = % Attendance, X2 = Salaries and X3 = Spending:
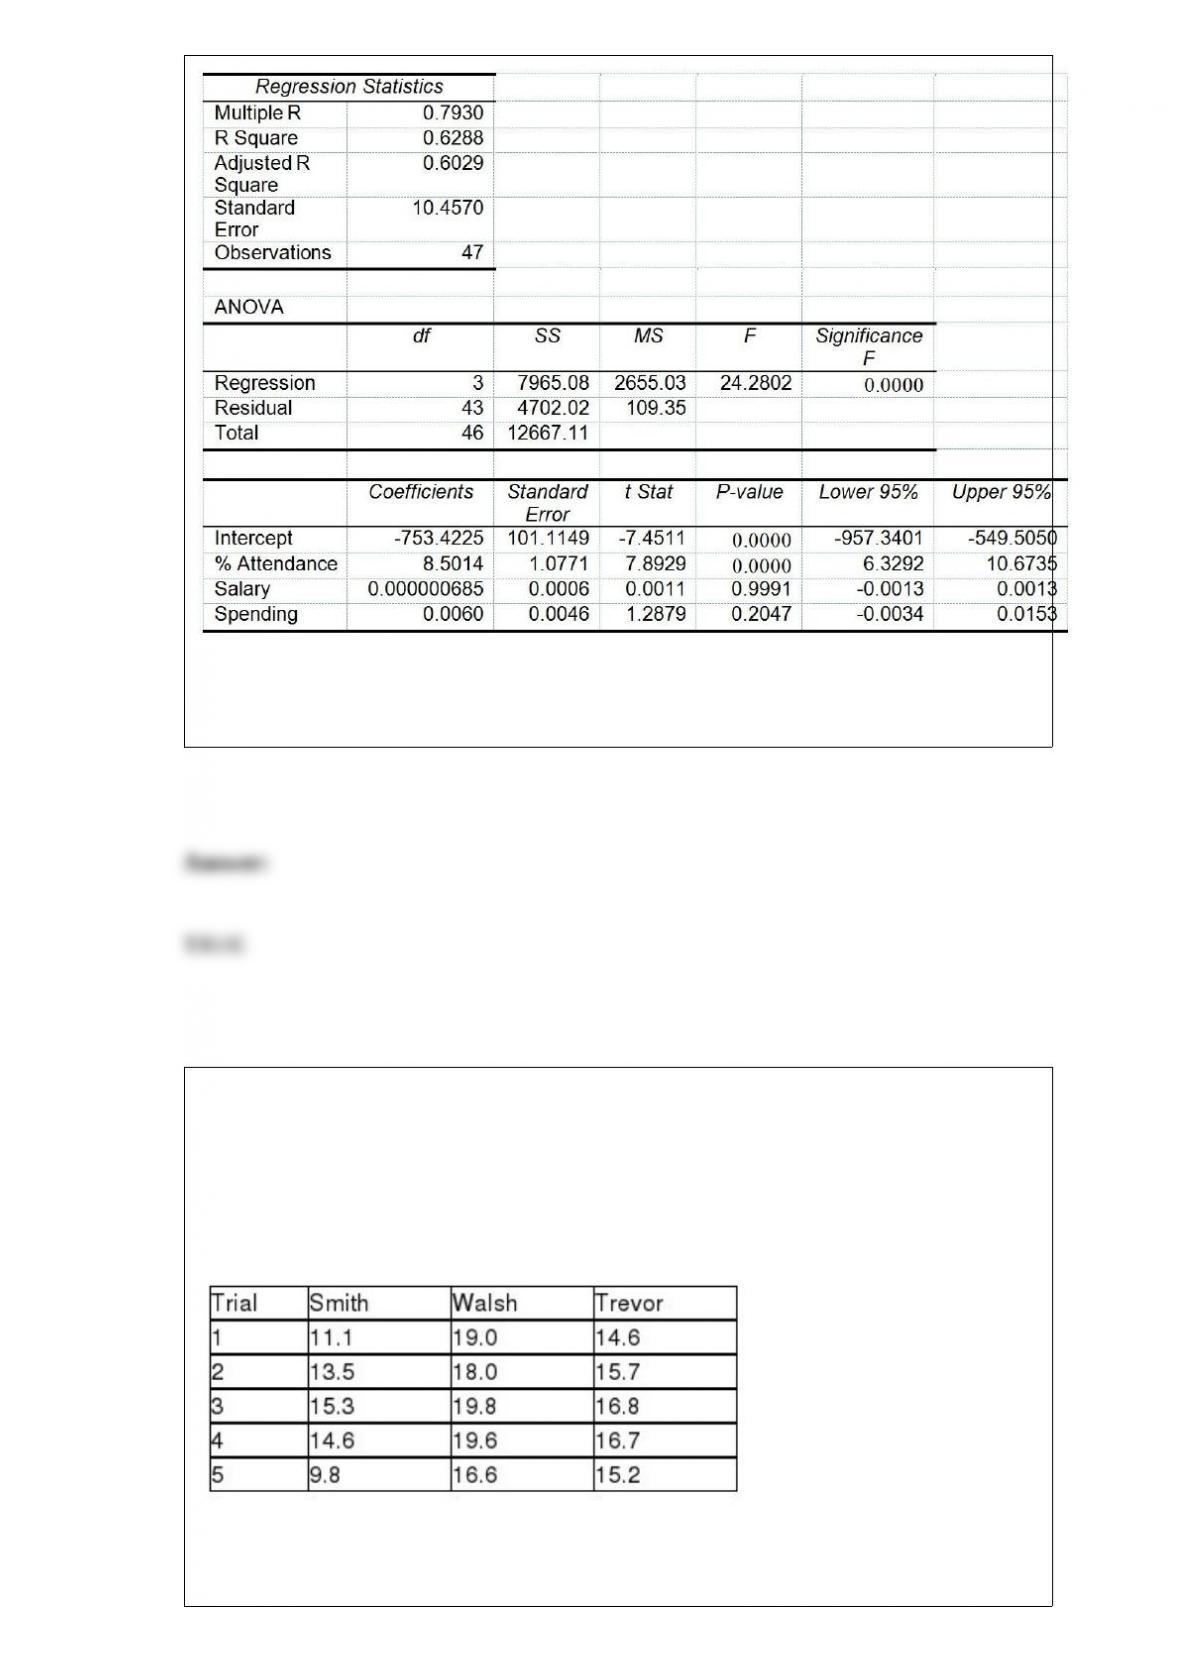
Referring to Table 17-8, the alternative hypothesis H1 : At least one of βj ≠0 for j =
1, 2, 3 implies that the percentage of students passing the proficiency test is related to at
least one of the explanatory variables.
TABLE 11-4
An agronomist wants to compare the crop yield of 3 varieties of chickpea seeds. She
plants 15 fields, 5 with each variety. She then measures the crop yield in bushels per
acre. Treating this as a completely randomized design, the results are presented in the
table that follows.
True or False: Referring to Table 11-4, the test is valid only if the population of crop
yields is normally distributed for the 3 varieties.

TABLE 14-15
The superintendent of a school district wanted to predict the
percentage of students passing a sixth-grade proficiency test. She
obtained the data on percentage of students passing the proficiency
test (% Passing), mean teacher salary in thousands of dollars
(Salaries), and instructional spending per pupil in thousands of dollars
(Spending) of 47 schools in the state.
Following is the multiple regression output with Y = % Passing as the
dependent variable, X1 = Salaries and X2 = Spending:
True or False: Referring to Table 14-15, the null hypothesis H0 : β1 =
β2 = 0 implies that percentage of students passing the proficiency
test is not related to either of the explanatory variables.
True or False: In a two-way ANOVA, it is appropriate to interpret main effects when the
interaction component is not significant.
True or False: In general, a frequency distribution should have at least 8 class groups
but no more than 20.
TABLE 4-12
Jake woke up late in the morning on the day that he has to go to school to take an
important test. He can either take the shuttle bus which is usually running late 20% of
the time or ride his unreliable motorcycle which breaks down 40% of the time. He
decides to toss a fair coin to make his choice.
Referring to Table 4-12, if Jake, in fact, gets to the test on time, what is the probability
that he rode his bike?
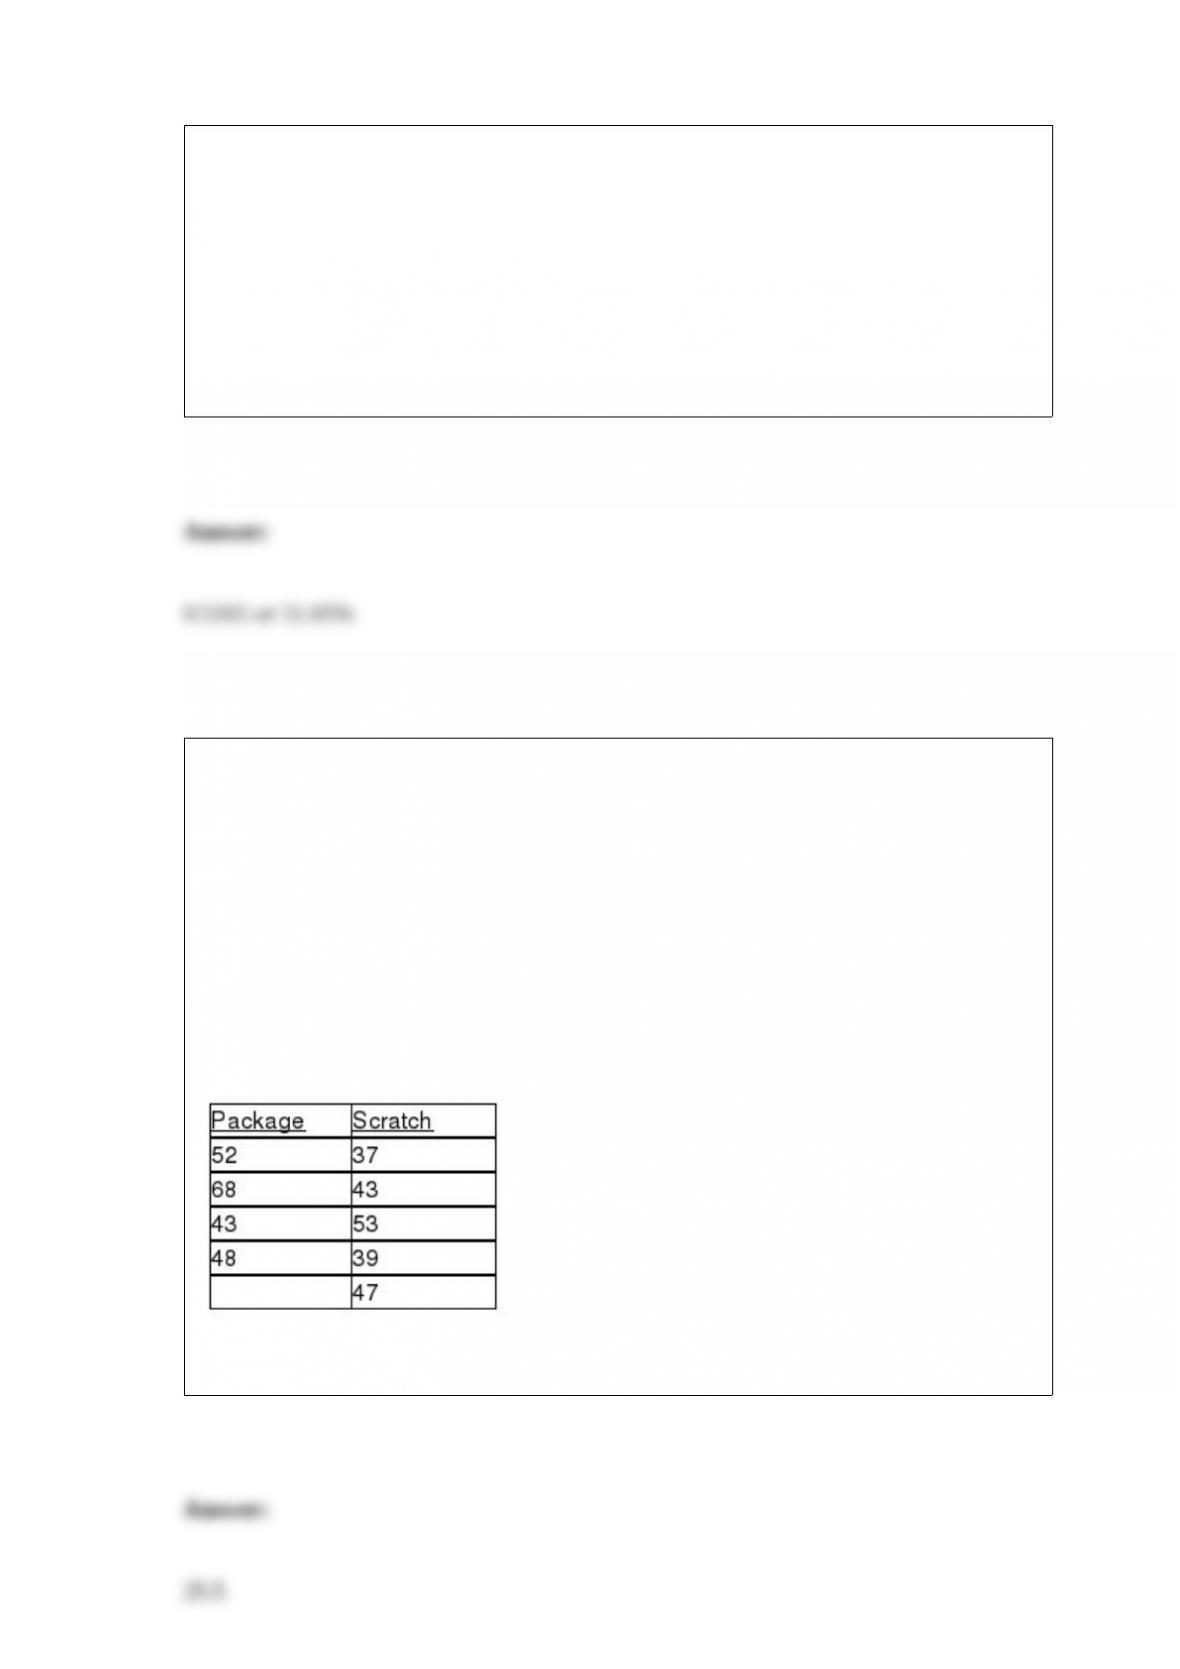
TABLE 5-10
An accounting firm in a college town usually recruits employees from two of the
universities in town. This year, there are fifteen graduates from University A and five
from University B and the firm decides to hire six new employees from the two
universities.
Referring to Table 5-10, what is the probability that no more than two of the new
employees will be from University B?
TABLE 12-14
A perfume manufacturer is trying to choose between 2 magazine advertising layouts.
An expensive layout would include a small package of the perfume. A cheaper layout
would include a ‘scratch-and-sniff” sample of the product. The manufacturer would use
the more expensive layout only if there is evidence that it would lead to a higher
approval rate. The manufacturer presents the more expensive layout to 4 groups and
determines the approval rating for each group. He presents the ‘scratch-and-sniff” layout
to 5 groups and again determines the approval rating of the perfume for each group. The
data are given below. Use this to test the appropriate hypotheses with the Wilcoxon
Rank Sum Test with a level of significance of 0.05.
Referring to Table 12-14, the calculated value of the test statistic is ________.
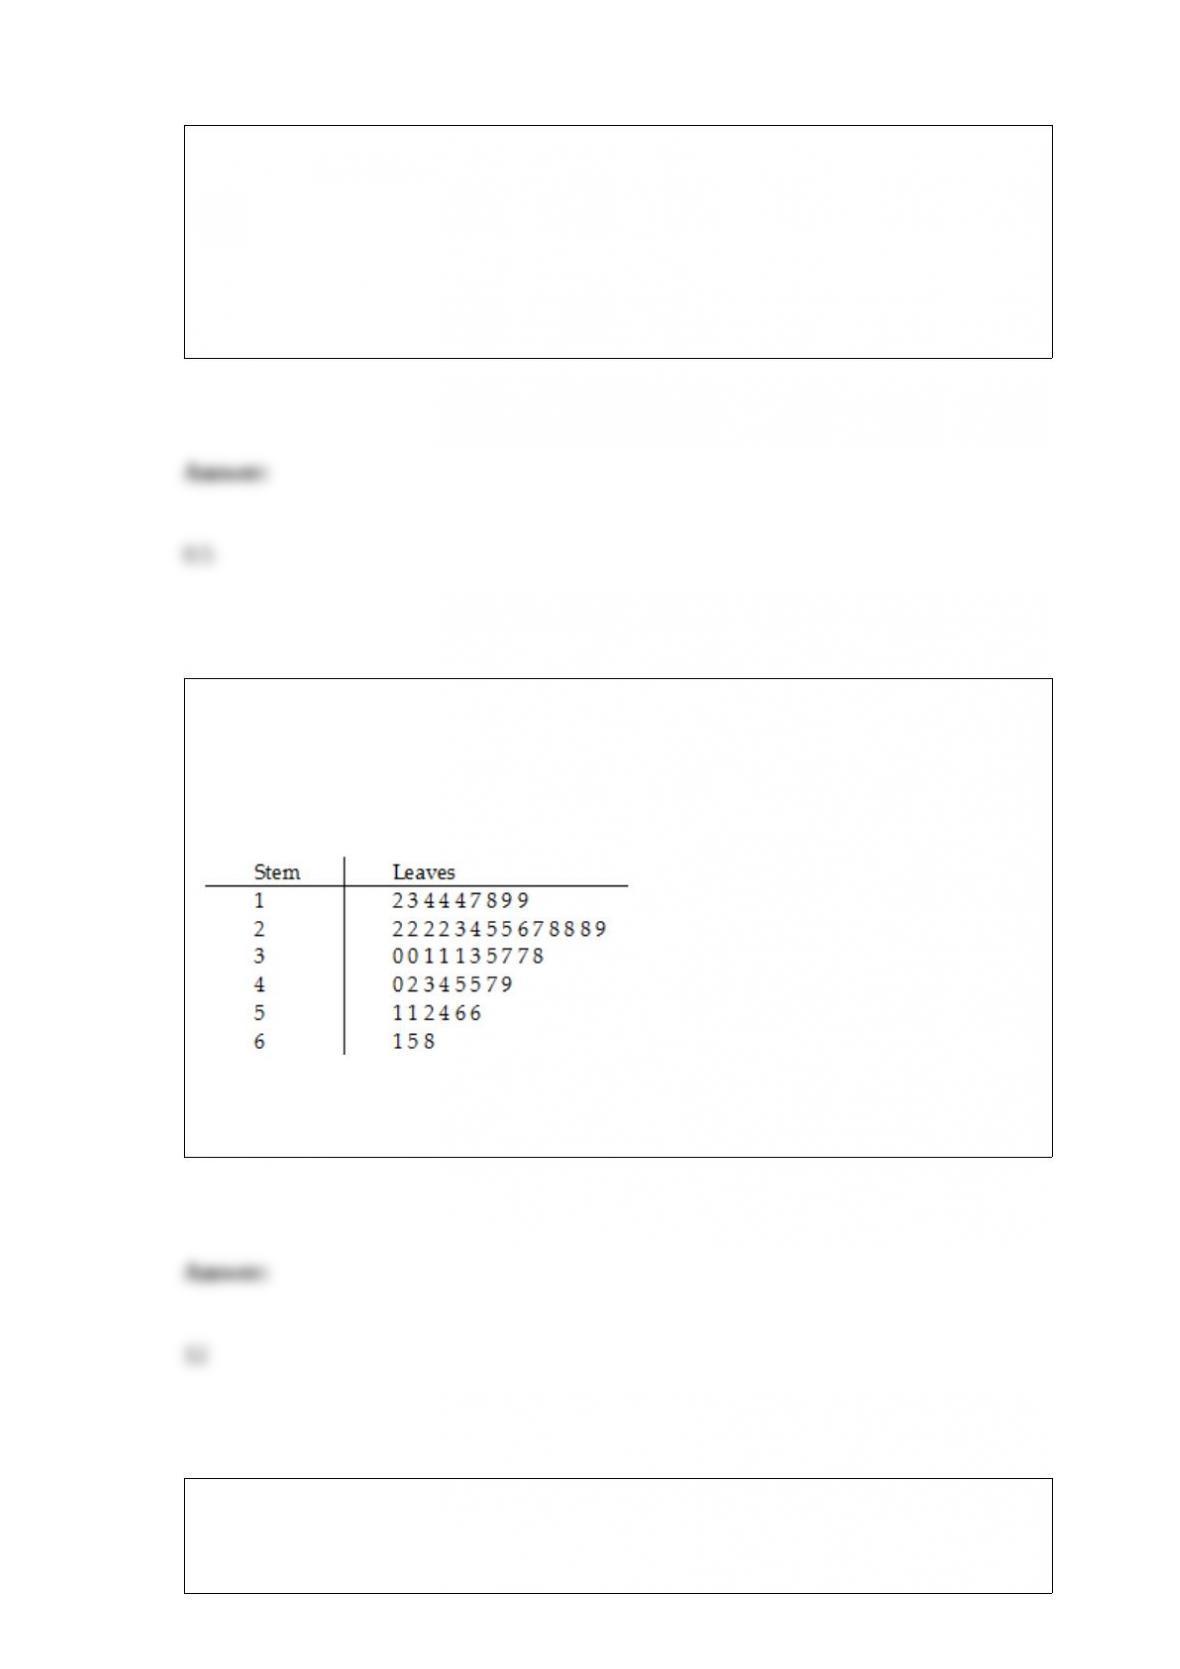
TABLE 7-4
According to a survey, only 15% of customers who visited the website of a major retail
store made a purchase. Random sample sizes of 50 are selected.
Referring to Table 7-4, what proportion of the samples will have less than 15% of
customers who will make a purchase after visiting the website?
TABLE 2-7
The Stem-and-Leaf display below contains data on the number of months between the
date a civil suit is filed and when the case is actually adjudicated for 50 cases heard in
superior court.
Referring to Table 2-7, locate the first leaf, i.e., the lowest valued leaf with the lowest
valued stem. This represents a wait of ________ months.
TABLE 2-7
The Stem-and-Leaf display below contains data on the number of months between the
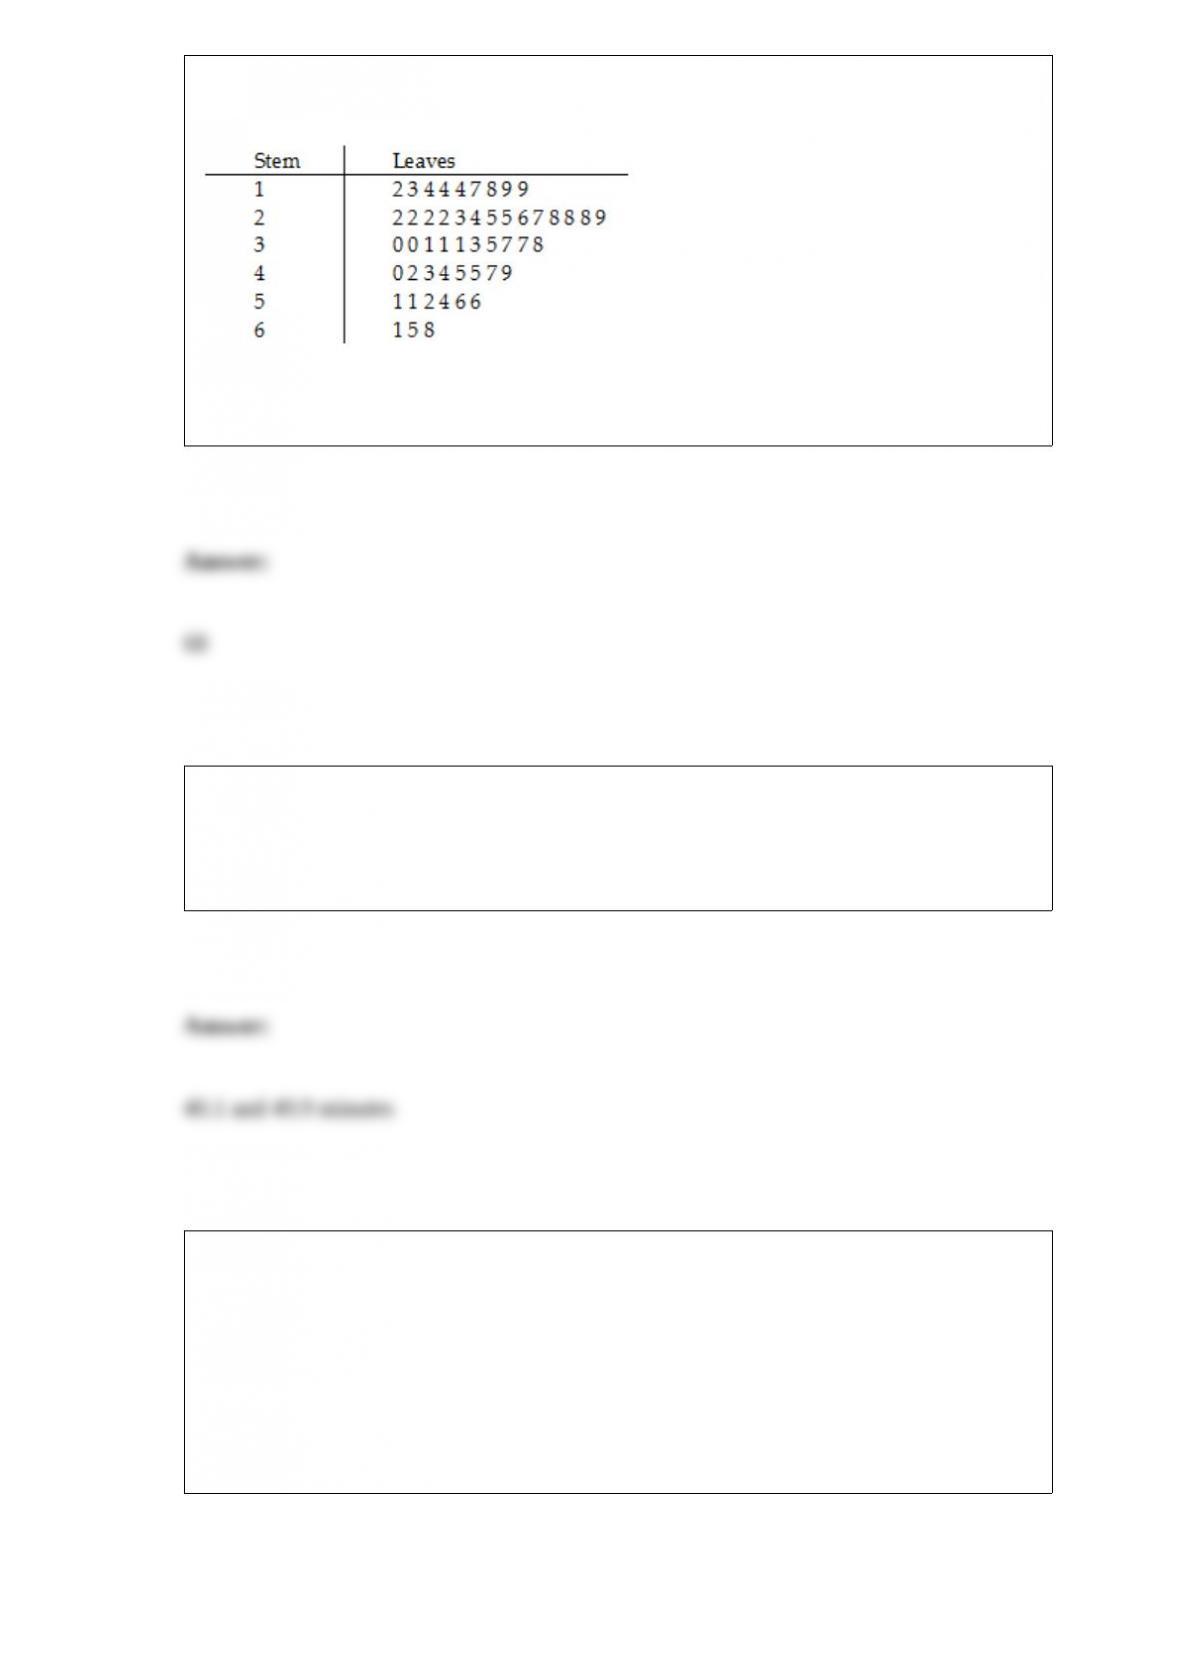
date a civil suit is filed and when the case is actually adjudicated for 50 cases heard in
superior court.
Referring to Table 2-7, the civil suit with the longest wait between when the suit was
filed and when it was adjudicated had a wait of ________ months.
The amount of time required for an oil and filter change on an automobile is normally
distributed with a mean of 45 minutes and a standard deviation of 10 minutes. A
random sample of 16 cars is selected. 95% of all sample means will fall between what
two values?
TABLE 7-3
The lifetimes of a certain brand of light bulbs are known to be normally distributed with
a mean of 1,600 hours and a standard deviation of 400 hours. A random sample of 64 of
these light bulbs is taken.
Referring to Table 7-3, the probability is 0.20 that the sample mean lifetime differs from
the population mean lifetime by at least how many hours?

TABLE 16-5
The number of passengers arriving at San Francisco on the Amtrak cross-country
express on 6 successive Mondays were: 60, 72, 96, 84, 36, and 48.
Referring to Table 16-5, the number of arrivals will be exponentially smoothed with a
smoothing constant of 0.1. The smoothed value for the second Monday will be
________.
TABLE 12-20
A filling machine at a local soft drinks company is calibrated to fill the cans at a mean
amount of 12 fluid ounces and a standard deviation of 0.5 ounces. The company wants
to test whether the standard deviation of the amount filled by the machine is 0.5 ounces.
A random sample of 15 cans filled by the machine reveals a standard deviation of 0.67
ounces.
Referring to Table 12-20, what are the lower and upper critical values of the test when
allowing for 5% probability of committing a type I error?