
TABLE 9-8
One of the biggest issues facing e-retailers is the ability to turn browsers into buyers.
This is measured by the conversion rate, the percentage of browsers who buy something
in their visit to a site. The conversion rate for a company’s website was 10.1%. The
website at the company was redesigned in an attempt to increase its conversion rates. A
sample of 200 browsers at the redesigned site was selected. Suppose that 24 browsers
made a purchase. The company officials would like to know if there is evidence of an
increase in conversion rate at the 5% level of significance.
True or False: Referring to Table 9-8, the null hypothesis would be rejected.
True or False: MAD is the summation of the residuals divided by the sample size.
TABLE 8-17
A random sample of 100 stores from a large chain of 500 garden supply stores was
selected to determine the mean number of lawnmowers sold at an end-of-season
clearance sale. The sample results indicated a mean of 6 and a standard deviation of 2
lawnmowers sold. A 95% confidence interval (5.623 to 6.377) was established based on
these results.
True or False: Referring to Table 8-17, if the population had consisted of 1,000 stores,
the confidence interval estimate of the mean with finite population correction would
have been wider in range.
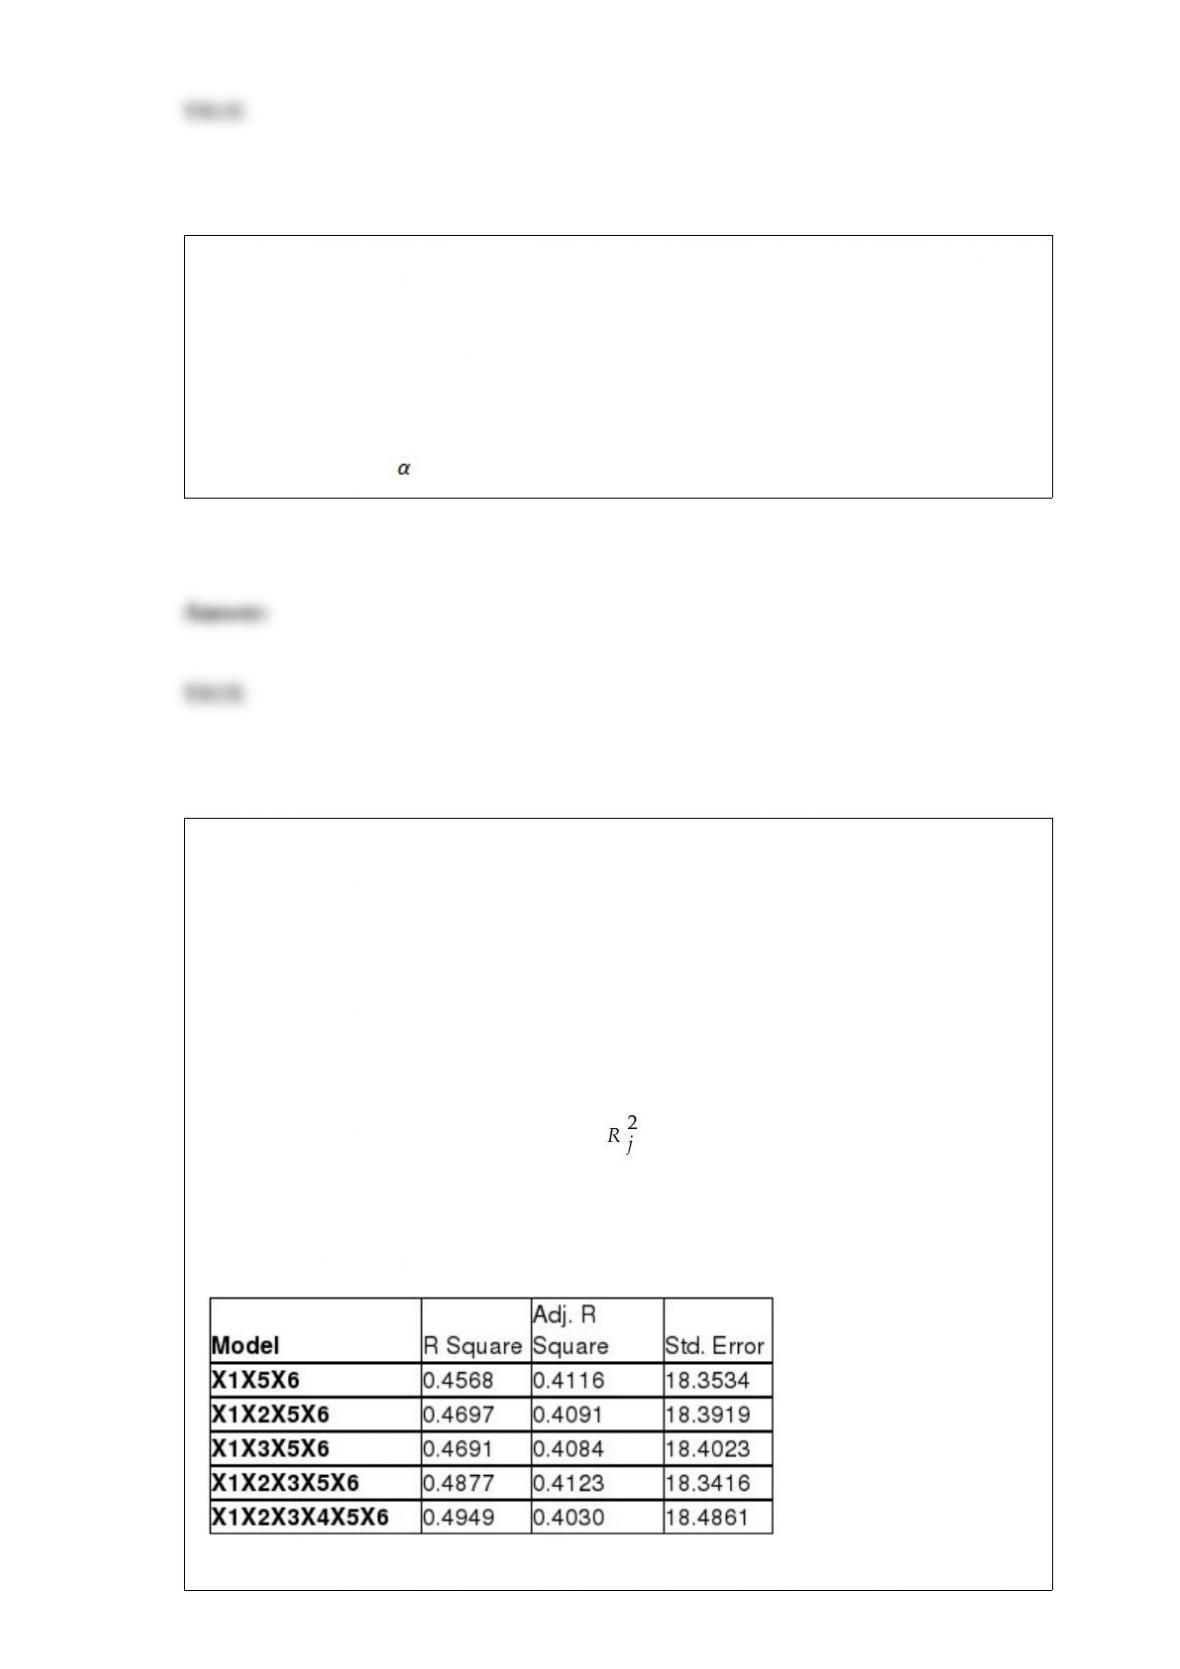
TABLE 9-5
A bank tests the null hypothesis that the mean age of the bank’s mortgage holders is less
than or equal to 45 years, versus an alternative that the mean age is greater than 45
years. They take a sample and calculate a p-value of 0.0202.
True or False: Referring to Table 9-5, the null hypothesis would be rejected at a
significance level of = 0.05.
TABLE 15-6
Given below are results from the regression analysis on 40 observations where the
dependent variable is the number of weeks a worker is unemployed due to a layoff (Y)
and the independent variables are the age of the worker (X1), the number of years of
education received (X2), the number of years at the previous job (X3), a dummy variable
for marital status (X4: 1 = married, 0 = otherwise), a dummy variable for head of
household (X5: 1 = yes, 0 = no) and a dummy variable for management position (X6: 1
= yes, 0 = no).
The coefficient of multiple determination ( ) for the regression model using each of
the 6 variables Xj as the dependent variable and all other X variables as independent
variables are, respectively, 0.2628, 0.1240, 0.2404, 0.3510, 0.3342 and 0.0993.
The partial results from best-subset regression are given below:
True or False: Referring to Table 15-6, the model that includes all the six independent

variablesshould be among the appropriate models using the Mallow’s Cp statistic.
The t distribution approaches the standardized normal distribution when the number of
degrees of freedom increases.
True or False: When you work with many variables, you must be mindful of the limits
of the information technology as well as the limits of the ability of your readers to
perceive and comprehend your results.
True or False: TABLE 17-9
What are the factors that determine the acceleration time (in sec.) from 0 to 60 miles per
hour of a car? Data on the following variables for 171 different vehicle models were
collected:
Accel Time: Acceleration time in sec.
Cargo Vol: Cargo volume in cu. ft.
HP: Horsepower
MPG: Miles per gallon
SUV: 1 if the vehicle model is an SUV with Coupe as the base when SUV and Sedan
are both 0
Sedan: 1 if the vehicle model is a sedan with Coupe as the base when SUV and Sedan
are both 0
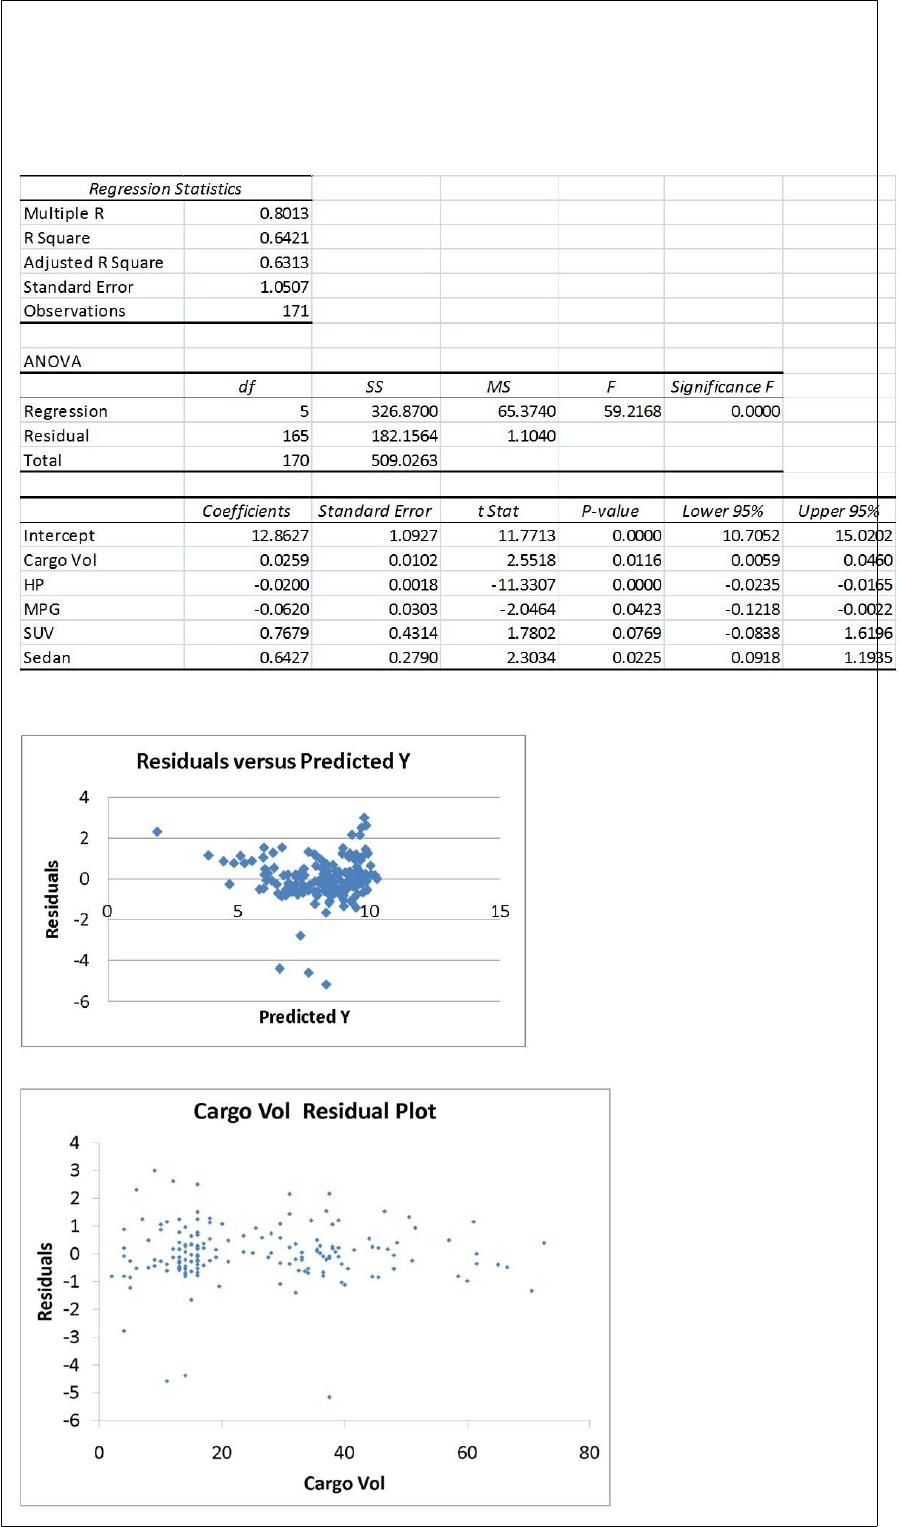
The regression results using acceleration time as the dependent variable and the
remaining variables as the independent variables are presented below.
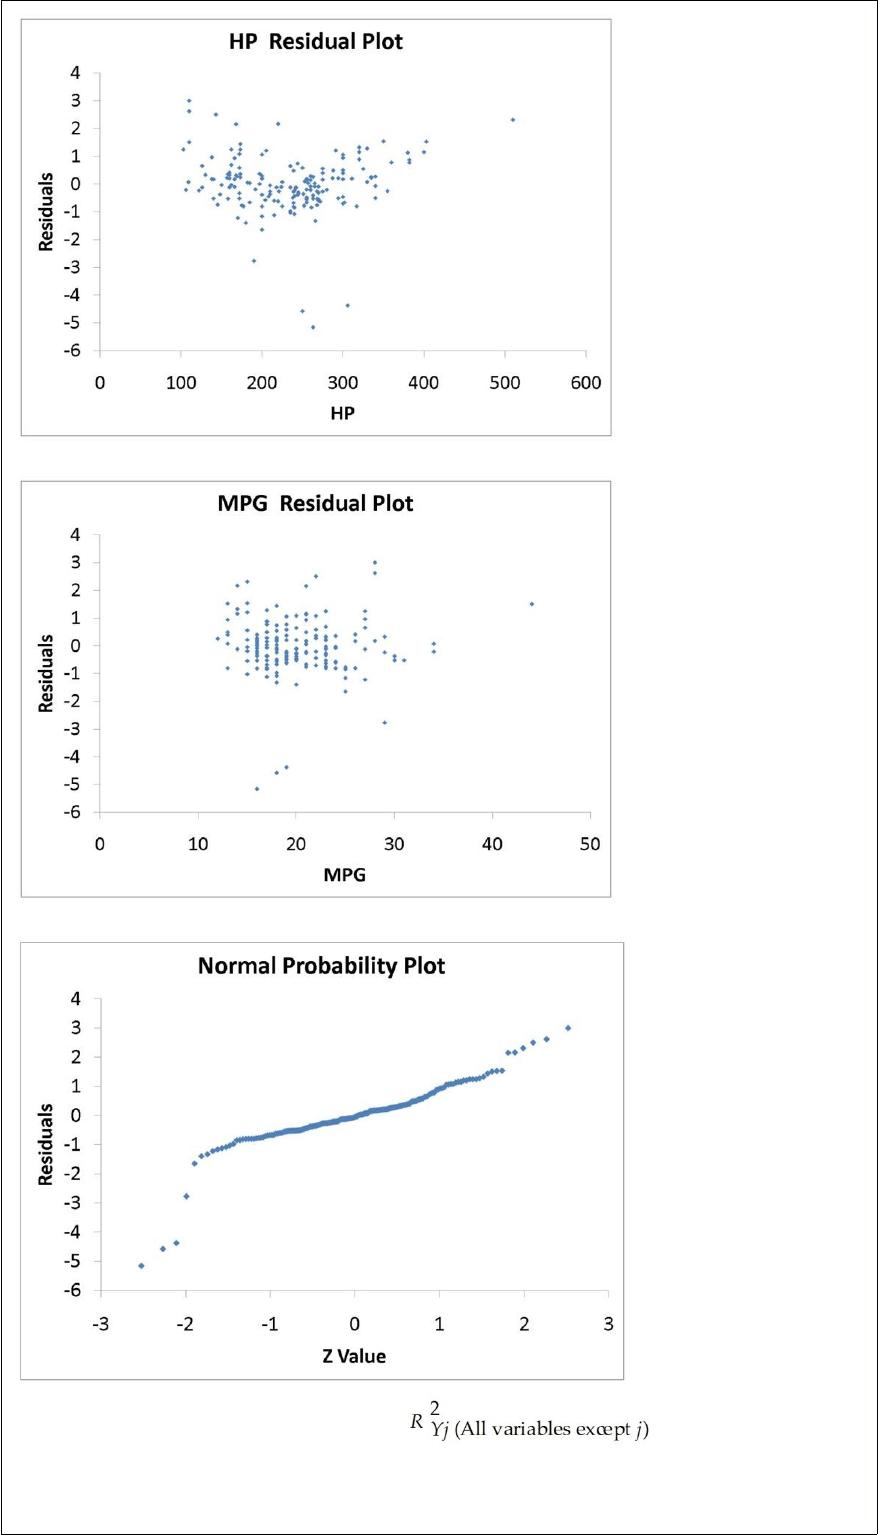
The various residual plots are as shown below.
The coefficient of partial determination ( ) of each of the 5
predictors are, respectively, 0.0380, 0.4376, 0.0248, 0.0188, and 0.0312.
The coefficient of multiple determination for the regression model using each of the 5
variables Xj as the dependent variable and all other X variables as independent variables
( ) are, respectively, 0.7461, 0.5676, 0.6764, 0.8582, 0.6632.
Referring to Table 17-9, there is enough evidence to conclude that SUV makes a
significant contribution to the regression model in the presence of the other independent
variables at a 5% level of significance.
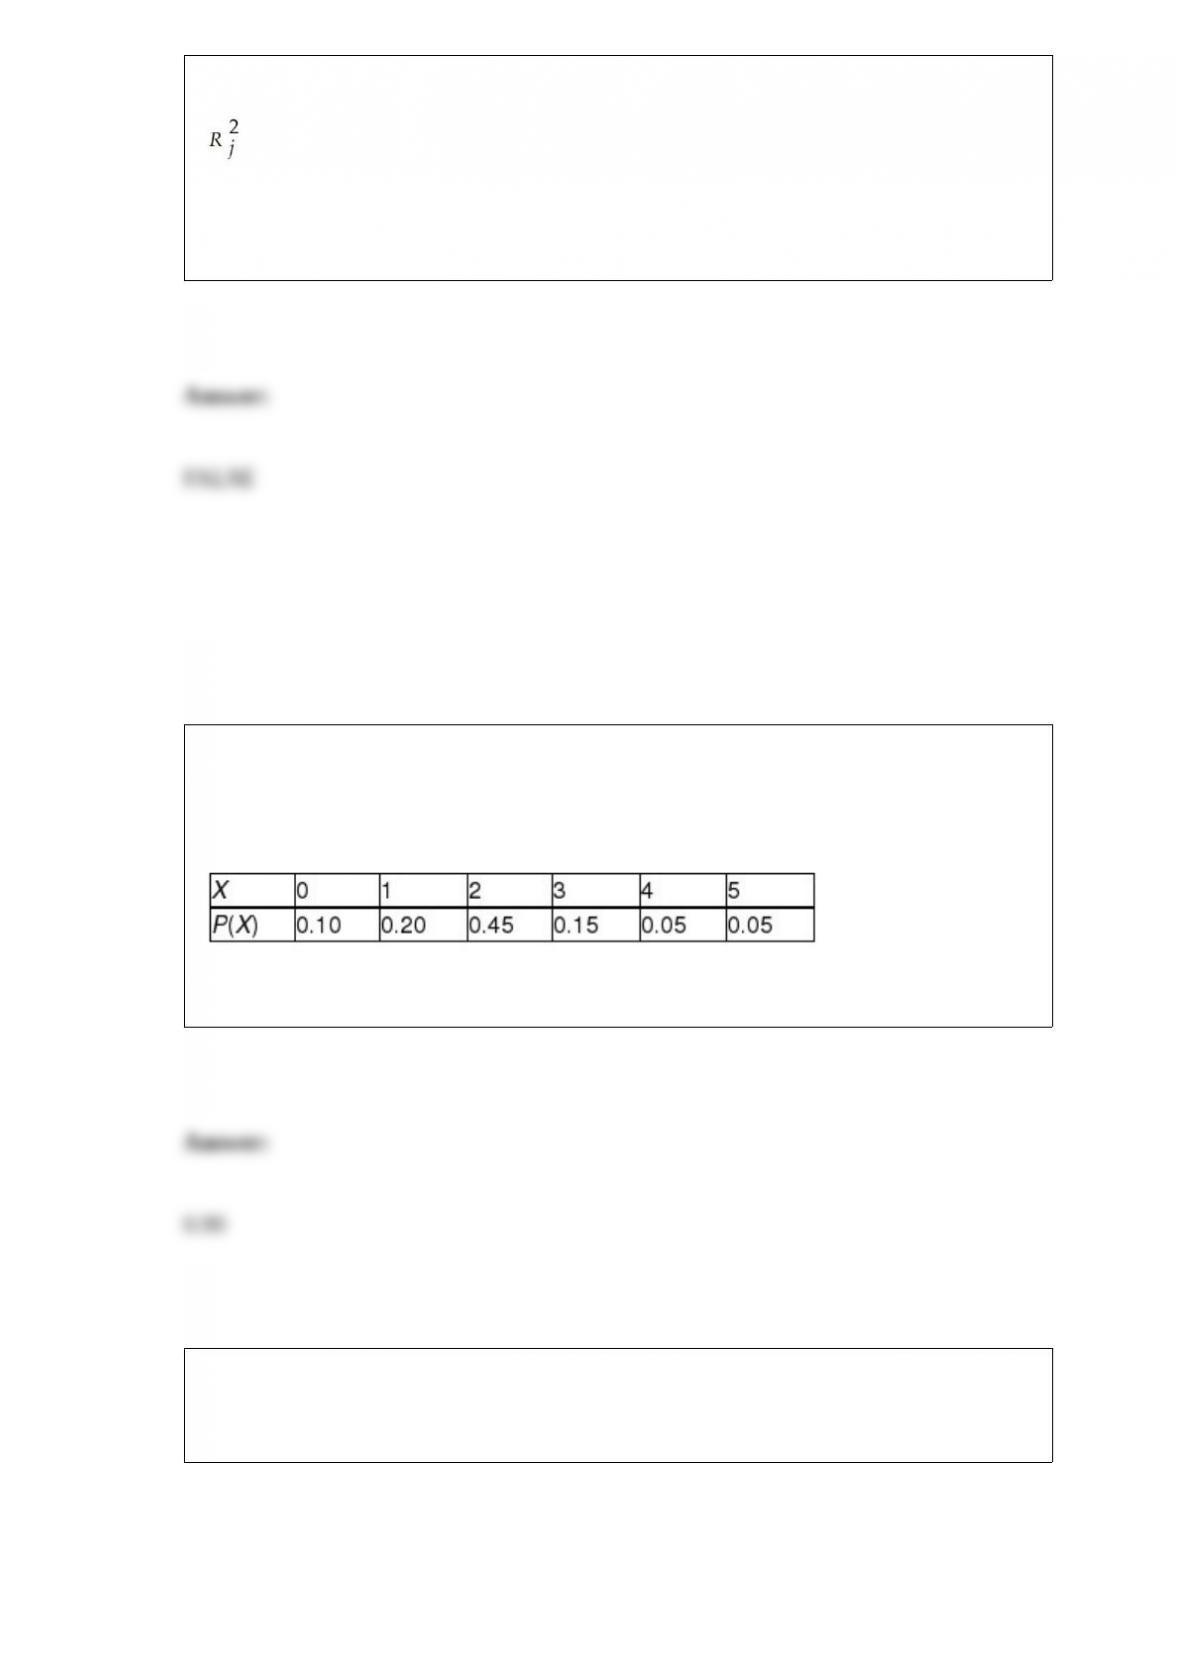
TABLE 5-4
The following table contains the probability distribution for X = the number of traffic
accidents reported in a day in Corvallis, Oregon.
Referring to Table 5-4, the probability of at least 1 accident is ________.
TABLE 16-13
Given below is the monthly time-series data for U.S. retail sales of building materials
over a specific year.
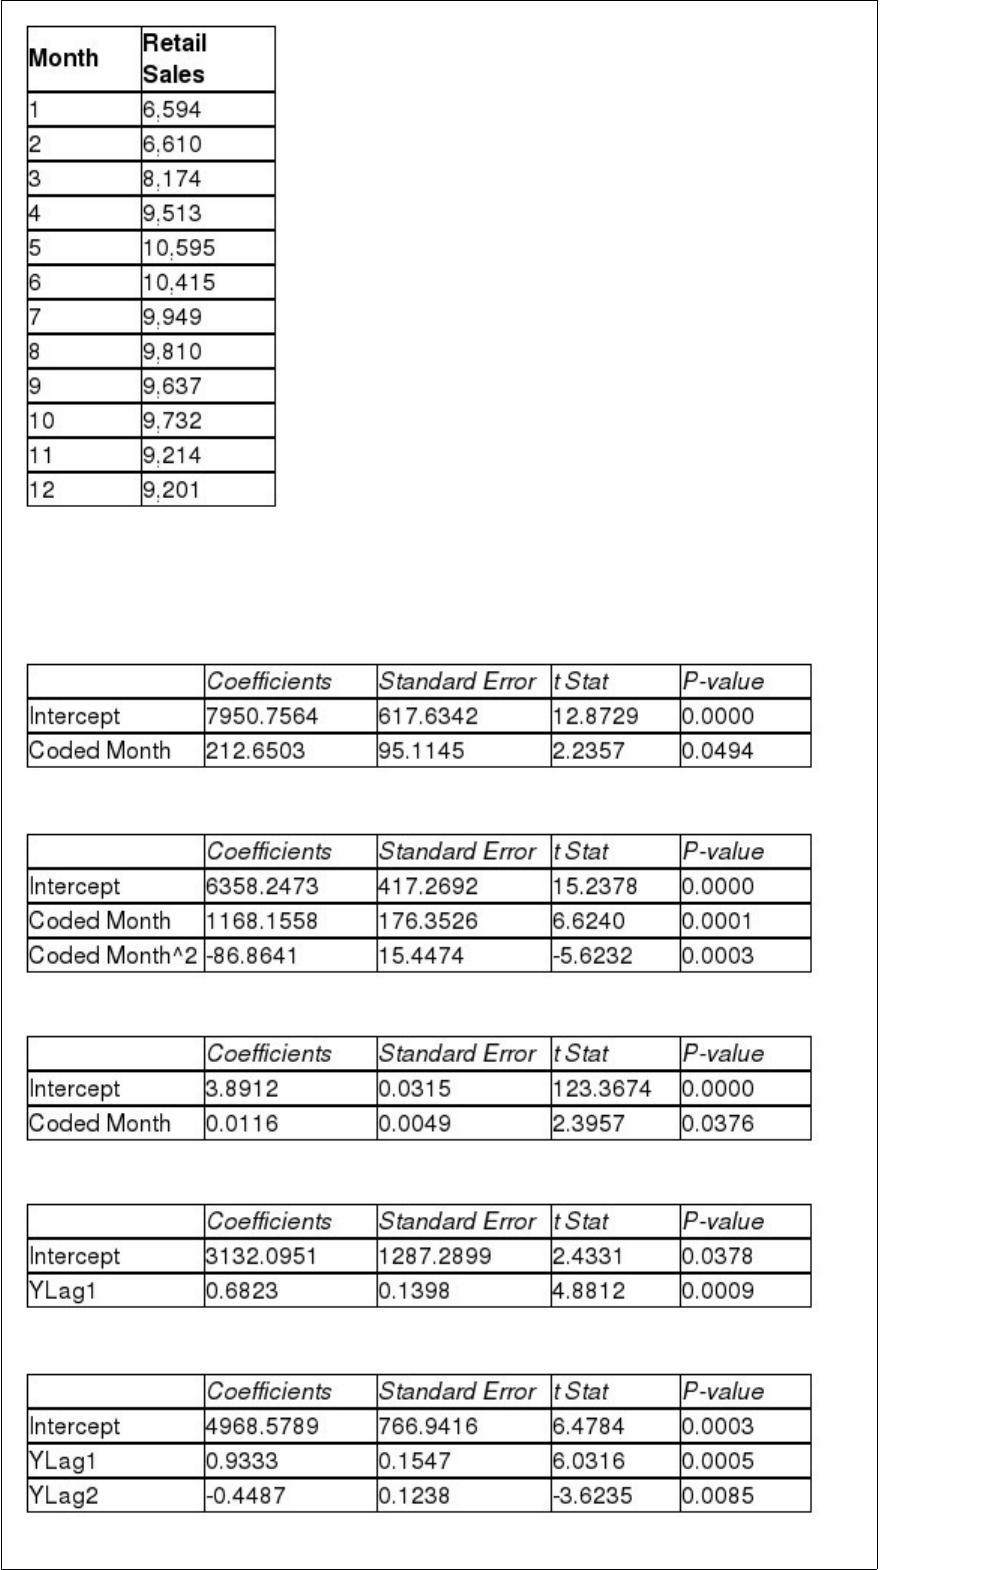
The results of the linear trend, quadratic trend, exponential trend, first-order
autoregressive, second-order autoregressive and third-order autoregressive model are
presented below in which the coded month for the 1st month is 0:
Linear trend model:
Quadratic trend model:
Exponential trend model:
First-order autoregressive:
Second-order autoregressive:
Third-order autoregressive:
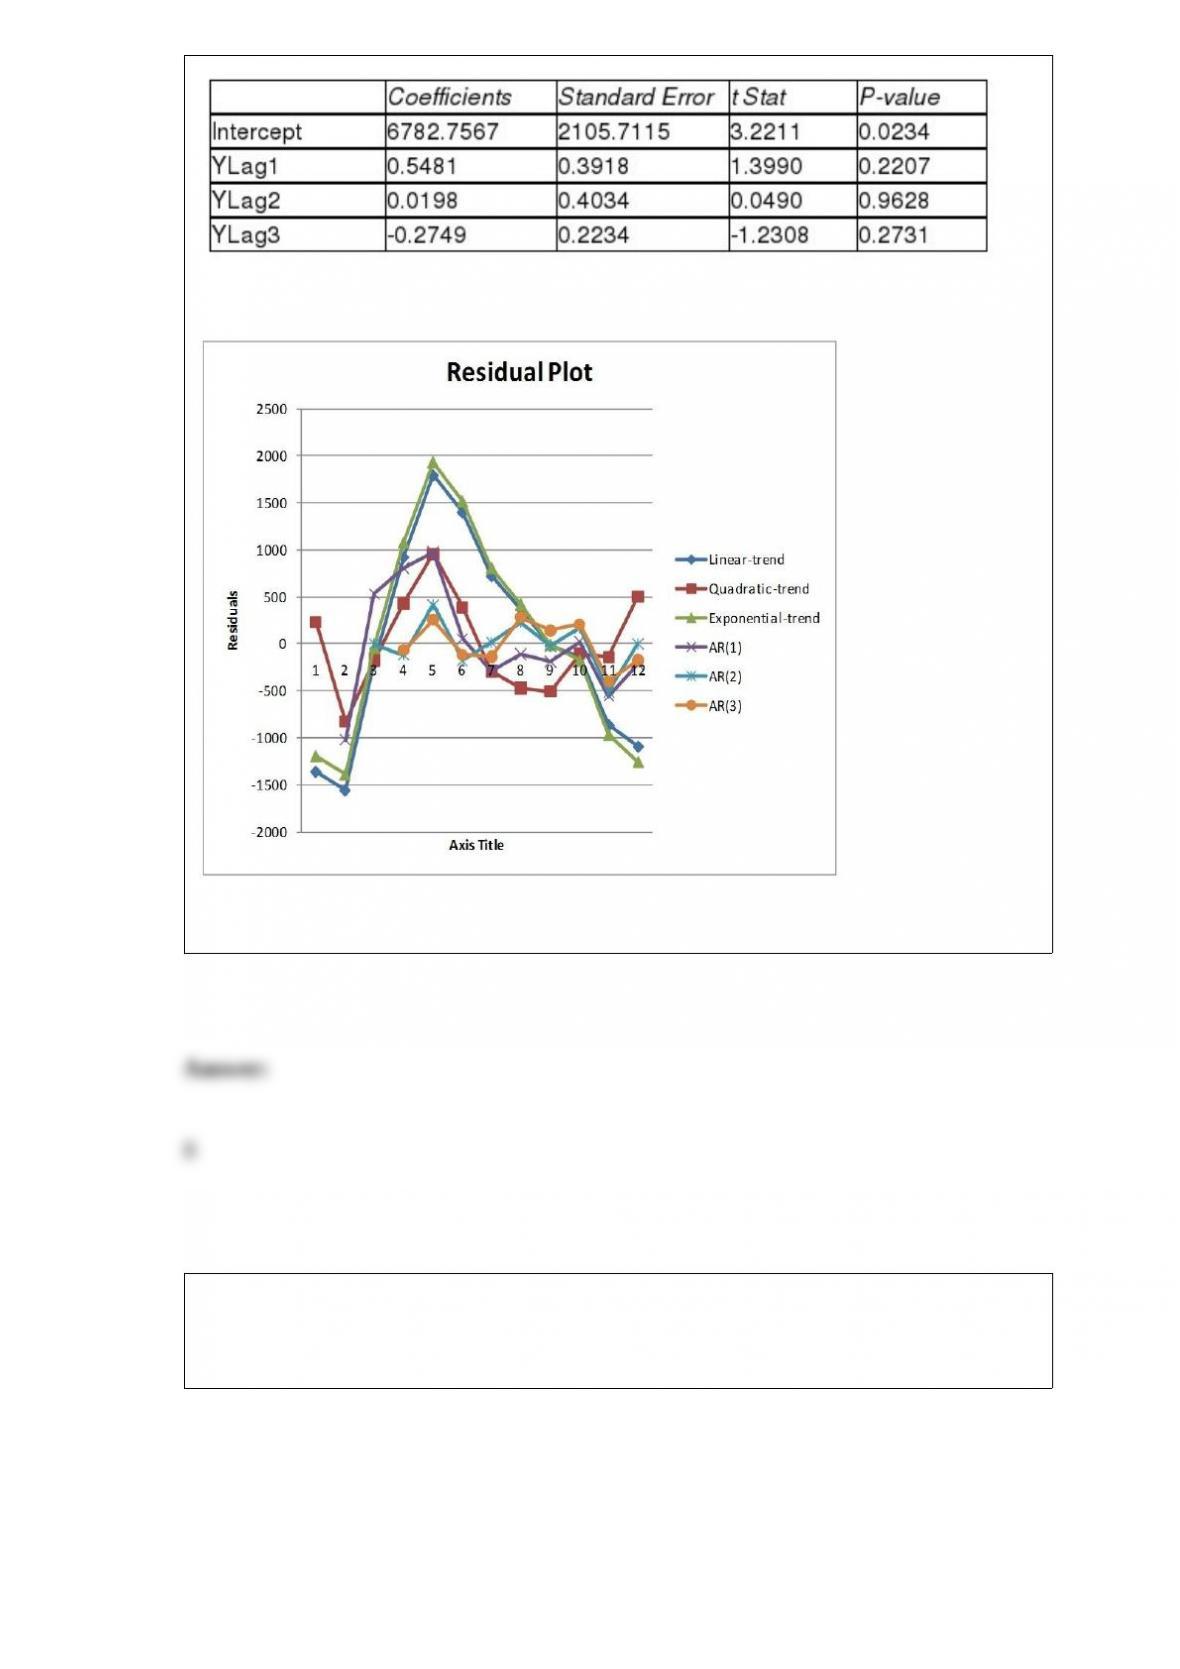
Below is the residual plot of the various models:
Referring to Table 16-13, if a five-month moving average is used to smooth this series,
how many moving averages can you compute?
TABLE 16-15
Given below are the average prices for three types of energy products for five
consecutive years.
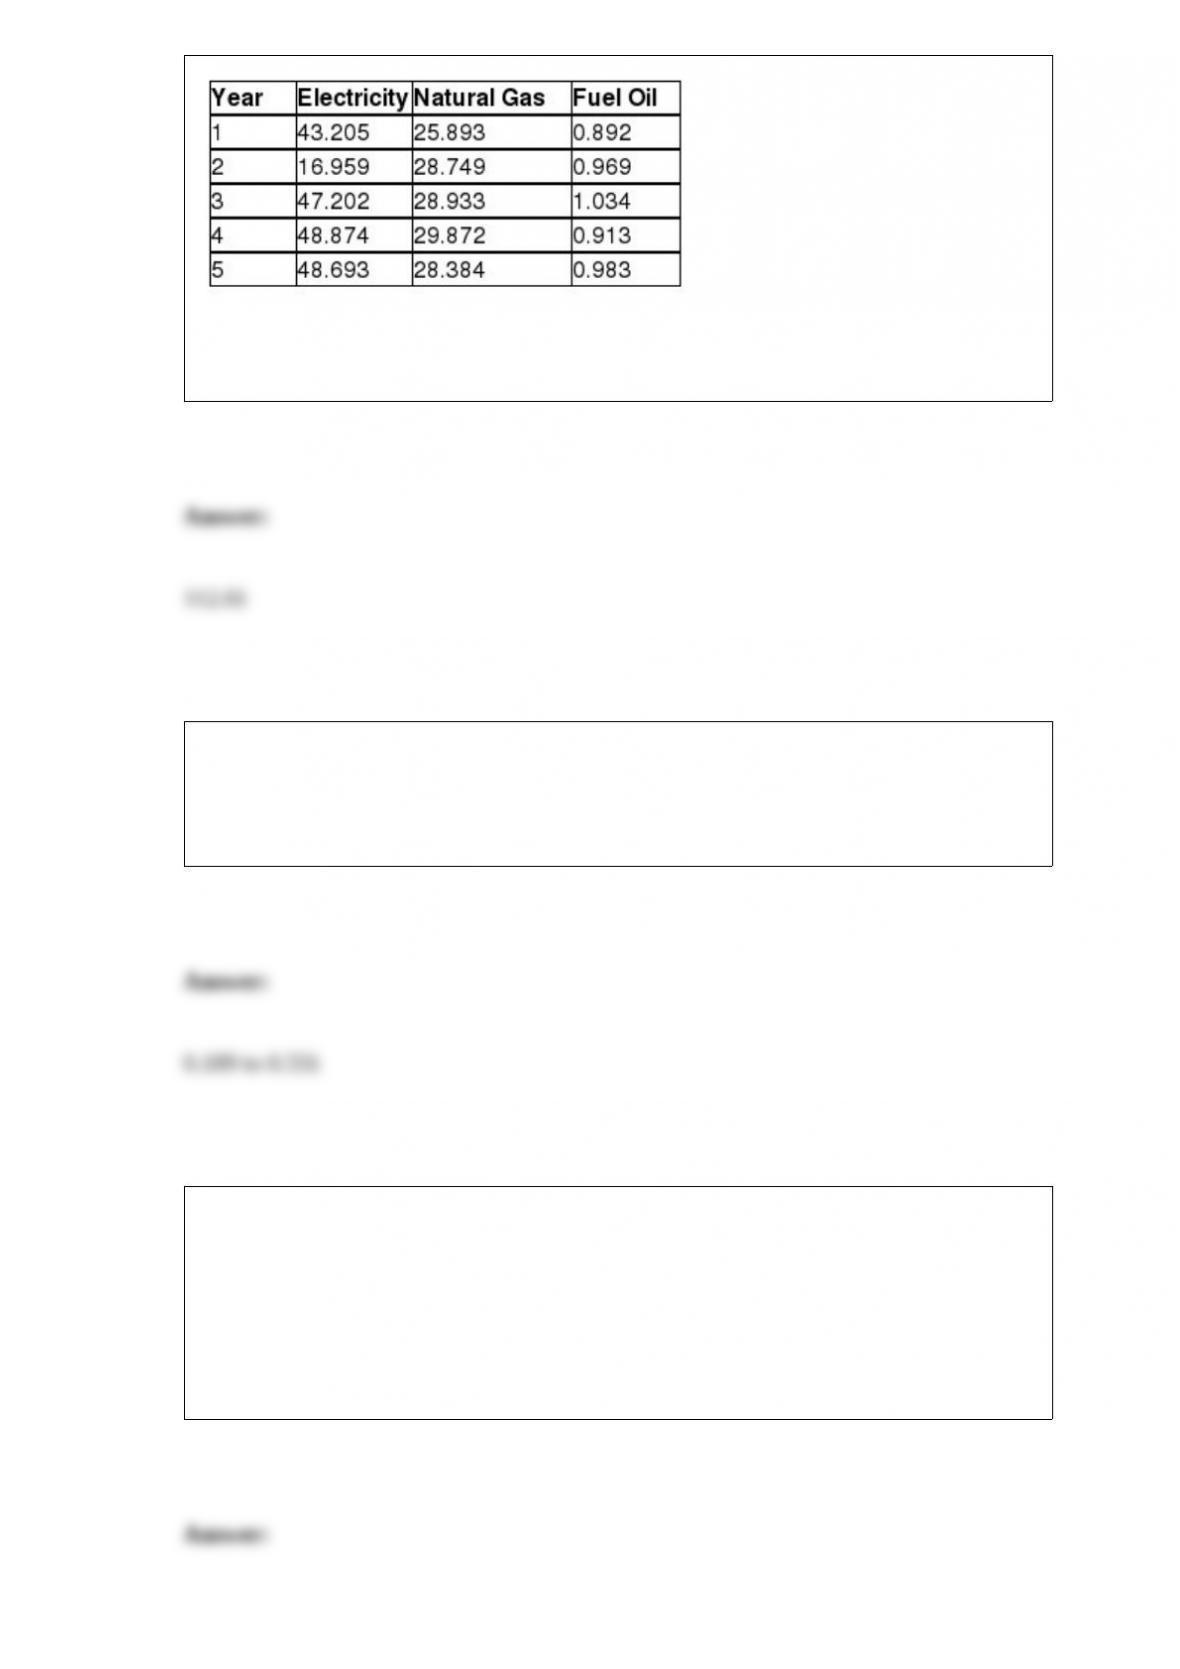
Referring to Table 16-15, what is the Paasche price index for the group of three energy
items in year 4 for a family that consumed 13 units of electricity, 26 units of natural gas
and 235 units of fuel oil in year 4 using year 1 as the base year?
A prison official wants to estimate the proportion of cases of recidivism. Examining the
records of 250 convicts, the official determines that there are 65 cases of recidivism. A
99% confidence interval for the proportion of cases of recidivism would go from
________ to ________.
You were told that the amount of time lapsed between consecutive trades on the New
York Stock Exchange followed a normal distribution with a mean of 15 seconds. You
were also told that the probability that the time lapsed between two consecutive trades
to fall between 16 to 17 seconds was 13%. The probability that the time lapsed between
two consecutive trades would fall below 13 seconds was 7%. What is the probability
that the time lapsed between two consecutive trades will be between 14 and 15
seconds?

TABLE 12-2
The dean of a college is interested in the proportion of graduates from his college who
have a job offer on graduation day. He is particularly interested in seeing if there is a
difference in this proportion for accounting and economics majors. In a random sample
of 100 of each type of major at graduation, he found that 65 accounting majors and 52
economics majors had job offers. If the accounting majors are designated as “Group 1”
and the economics majors are designated as “Group 2,” perform the appropriate
hypothesis test using a level of significance of 0.05.
Referring to Table 12-2, the p-value of the test is ________.