True or False: TABLE 17-9
What are the factors that determine the acceleration time (in sec.)
from 0 to 60 miles per hour of a car? Data on the following variables
for 171 different vehicle models were collected:
Accel Time: Acceleration time in sec.
Cargo Vol: Cargo volume in cu. ft.
HP: Horsepower
MPG: Miles per gallon
SUV: 1 if the vehicle model is an SUV with Coupe as the base when
SUV and Sedan are both 0
Sedan: 1 if the vehicle model is a sedan with Coupe as the base when
SUV and Sedan are both 0
The regression results using acceleration time as the dependent
variable and the remaining variables as the independent variables are
presented below.
The various residual plots are as shown below.

The coefficient of partial determination ( ) of each
of the 5 predictors are, respectively, 0.0380, 0.4376, 0.0248, 0.0188,
and 0.0312.
The coefficient of multiple determination for the regression model
using each of the 5 variables Xj as the dependent variable and all
other X variables as independent variables ( ) are, respectively,
0.7461, 0.5676, 0.6764, 0.8582, 0.6632.
Referring to Table 17-9, the 0 to 60 miles per hour acceleration time
of a sedan is predicted to be 0.6427 seconds higher than that of an
SUV.
TABLE 8-12
A random sample of 100 stores from a large chain of 500 garden supply stores was
selected to determine the mean number of lawnmowers sold at an end-of-season
clearance sale. The sample results indicated a mean of 6 and a standard deviation of 2
lawnmowers sold. A 95% confidence interval (5.623 to 6.377) was established based on
these results.
True or False: Referring to Table 8-12, 95% of the stores have sold between 5.623 and
6.377 lawnmowers.
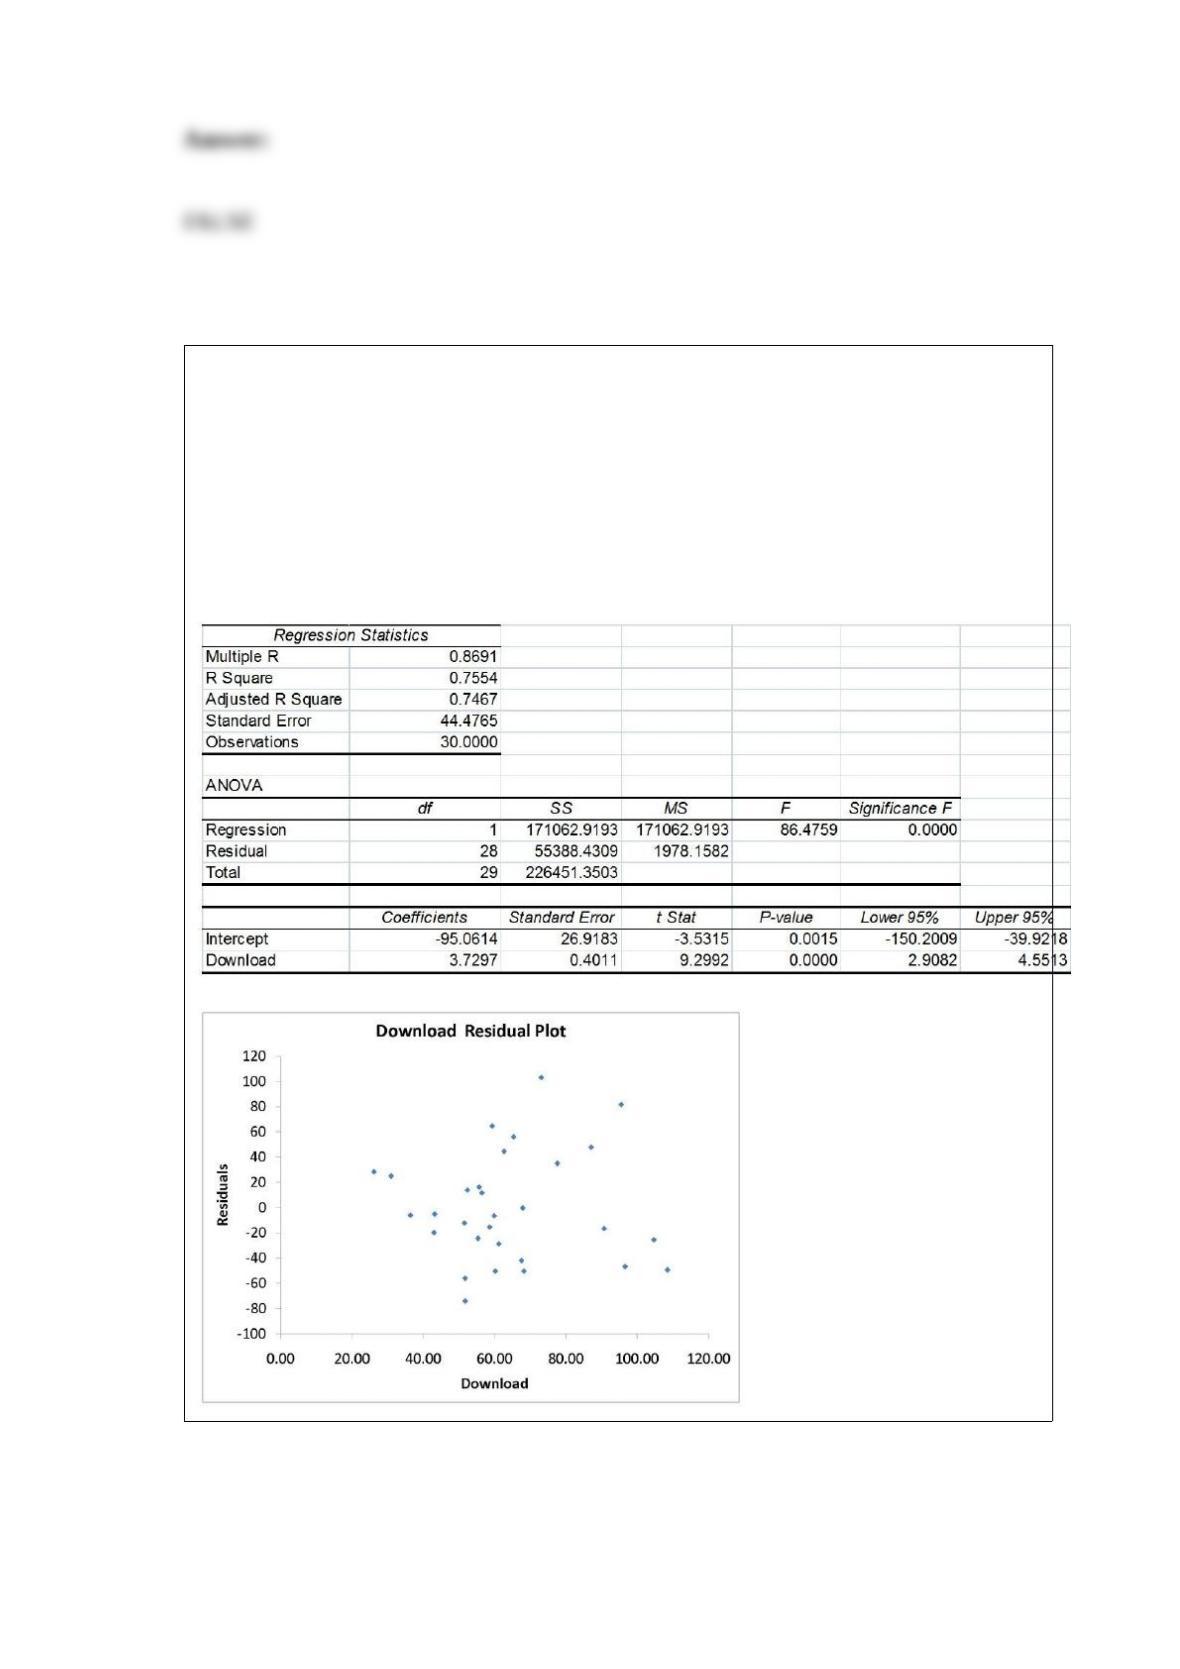
TABLE 13-11
A computer software developer would like to use the number of downloads (in
thousands) for the trial version of his new shareware to predict the amount of revenue
(in thousands of dollars) he can make on the full version of the new shareware.
Following is the output from a simple linear regression along with the residual plot and
normal probability plot obtained from a data set of 30 different sharewares that he has
developed:
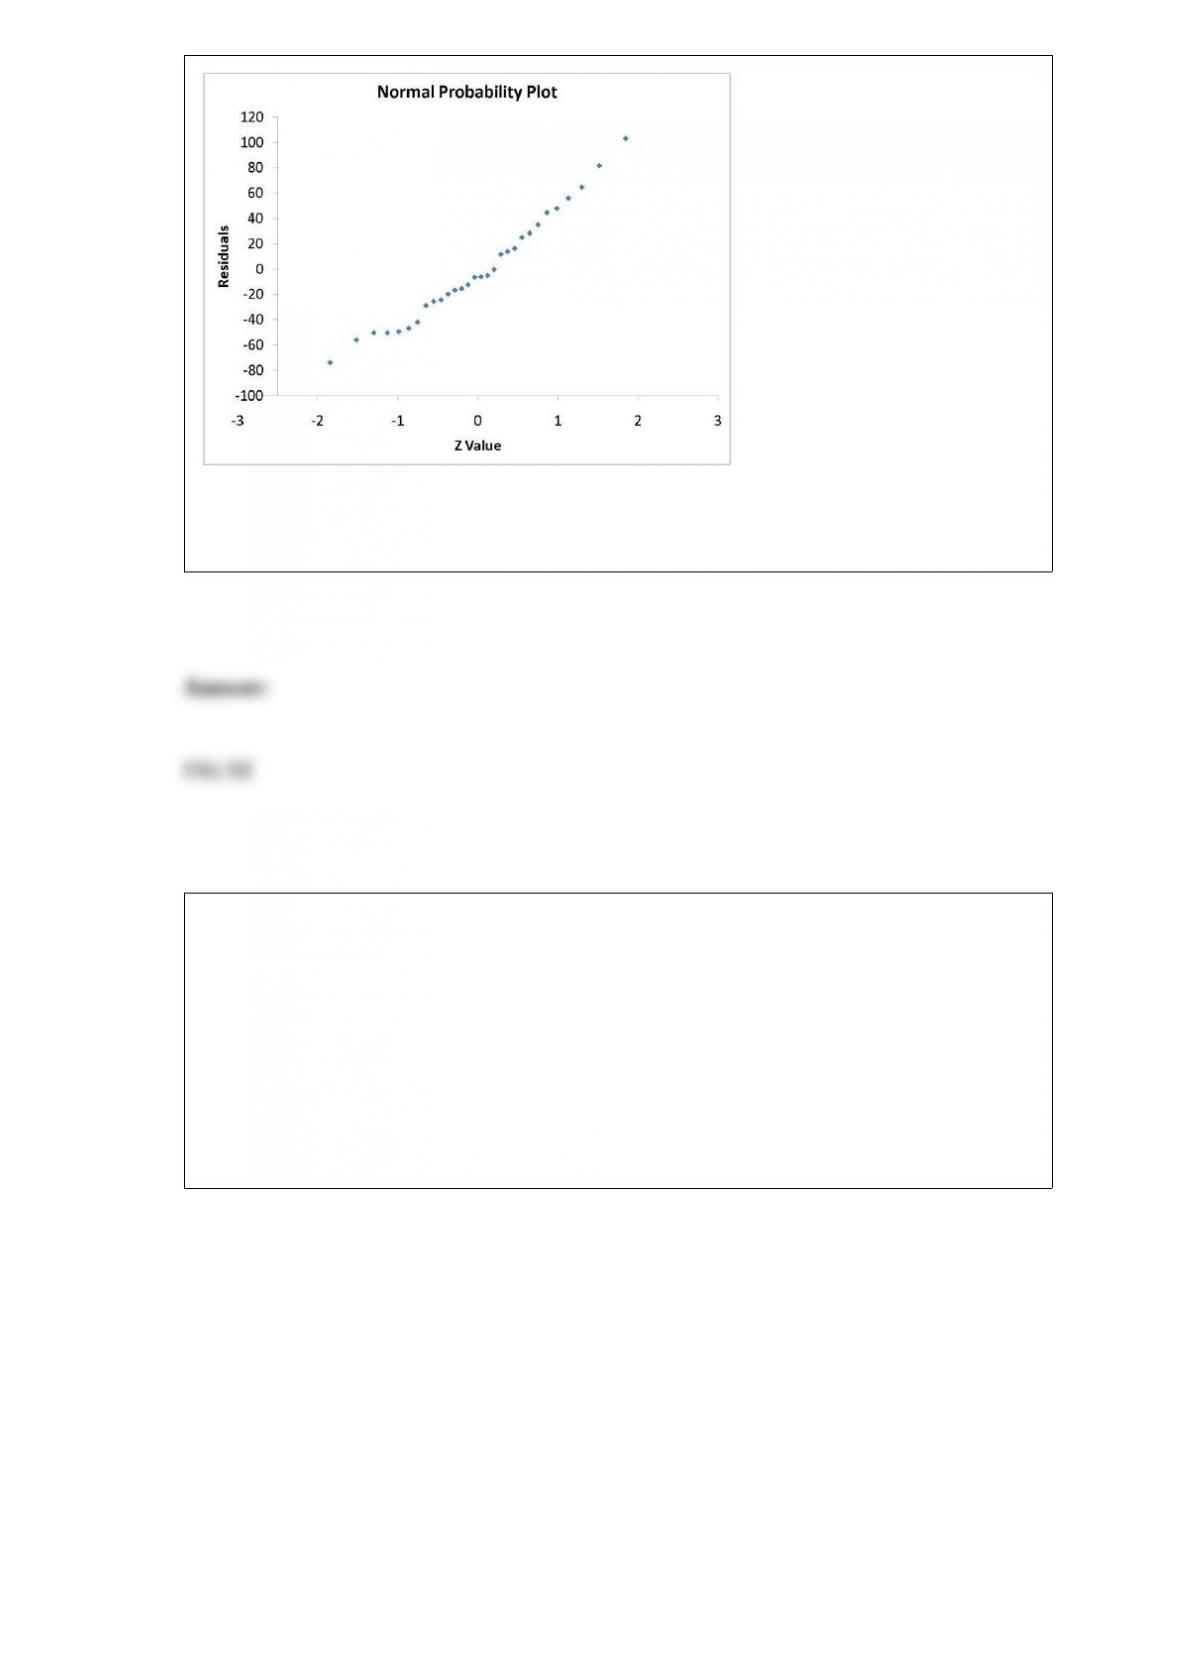
True or False: Referring to Table 13-11, the homoscedasticity of error assumption
appears to have been violated.
TABLE 14-17
Given below are results from the regression analysis where the
dependent variable is the number of weeks a worker is unemployed
due to a layo) (Unemploy) and the independent variables are the age
of the worker (Age) and a dummy variable for management position
(Manager: 1 = yes, 0 = no).
The results of the regression analysis are given below:

True or False: Referring to Table 14-17, there is suffcient evidence
that the number of weeks a worker is unemployed due to a layo)
depends on at least one of the explanatory variables at a 10% level of
signi?cance.
TABLE 14-17
Given below are results from the regression analysis where the
dependent variable is the number of weeks a worker is unemployed
due to a layo) (Unemploy) and the independent variables are the age
of the worker (Age) and a dummy variable for management position
(Manager: 1 = yes, 0 = no).
The results of the regression analysis are given below:

True or False: Referring to Table 14-17, the null hypothesis H0 : β1 =
β2 = 0 implies that the number of weeks a worker is unemployed due
to a layo) is not related to any of the explanatory variables.
True or False: The sum of cumulative frequencies in a distribution always equals 1.
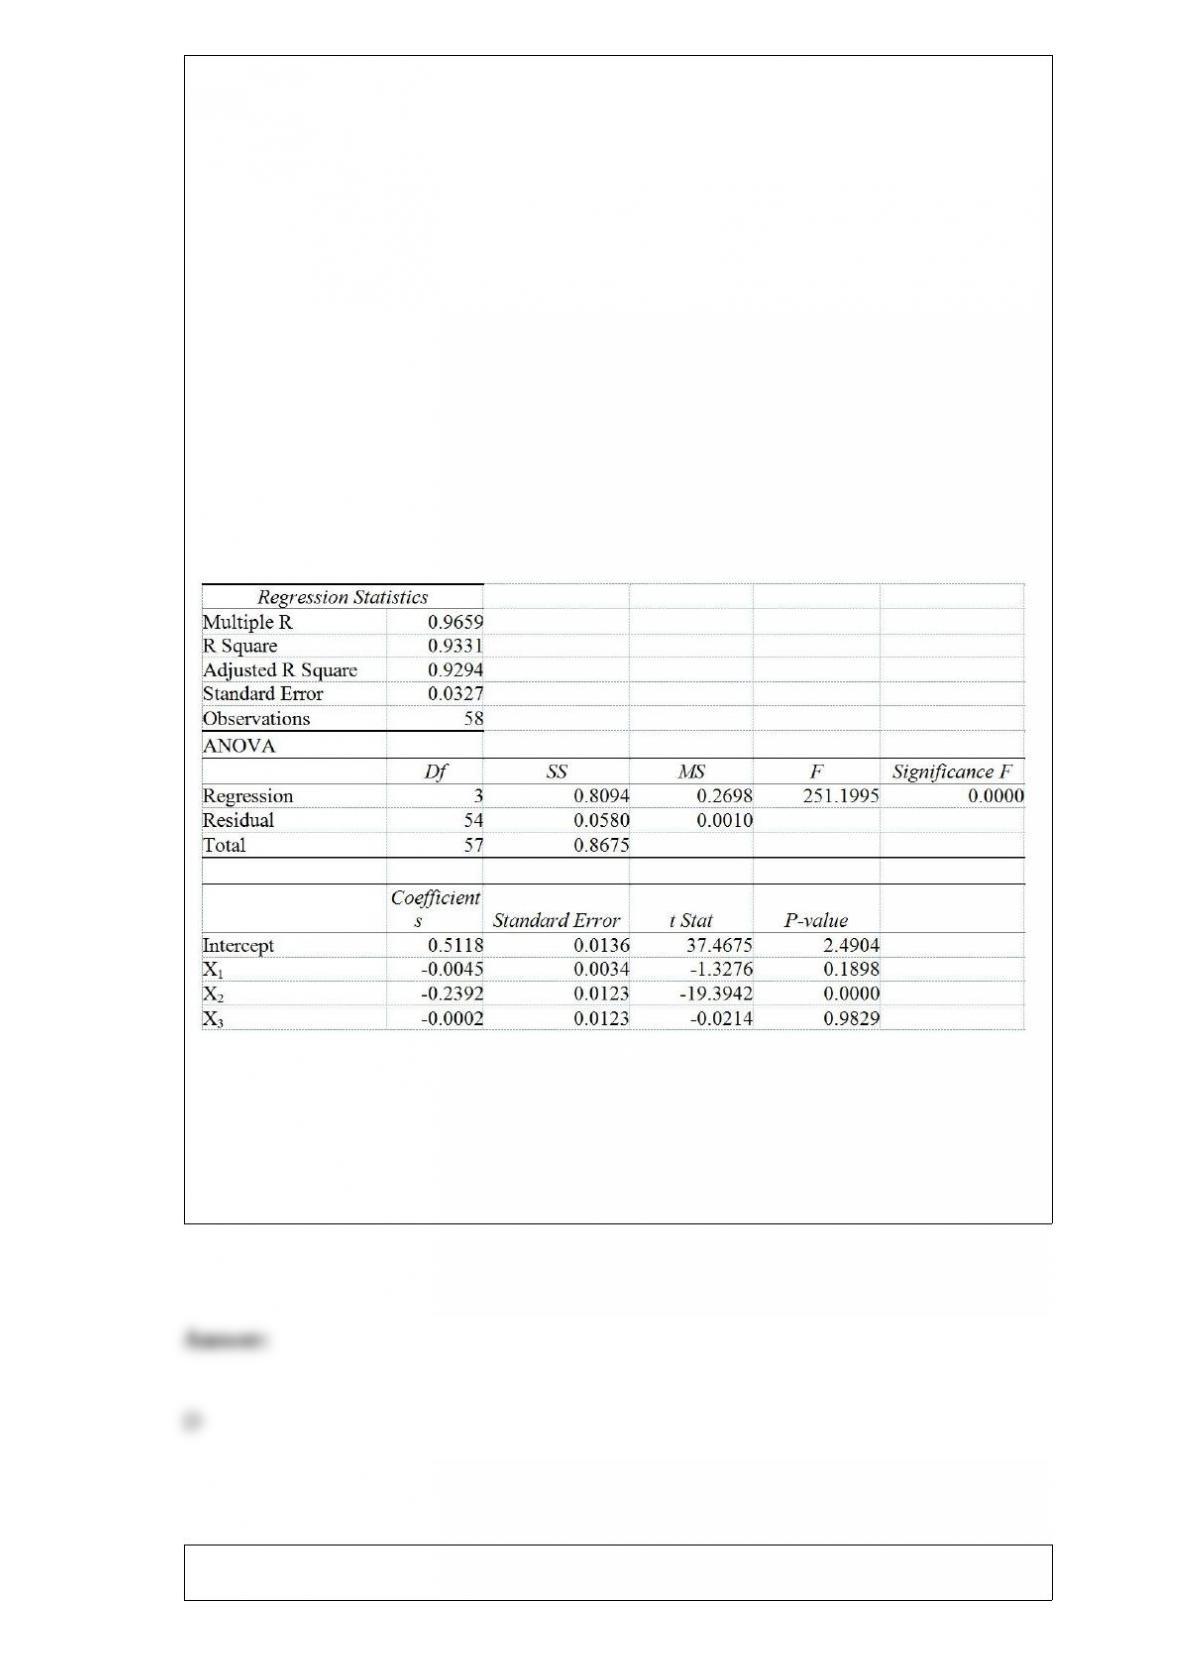
TABLE 17-7
As a project for his business statistics class, a student examined the factors that
determined parking meter rates throughout the campus area. Data were collected for the
price per hour of parking, blocks to the quadrangle, and one of the three jurisdictions:
on campus, in downtown and off campus, or outside of downtown and off campus. The
population regression model hypothesized is
Yi= α + β1X1i + β2X2i + β3X3i + ε
where
Y is the meter price
X1 is the number of blocks to the quad
X2 is a dummy variable that takes the value 1 if the meter is located in downtown and
off campus and the value 0 otherwise
X3 is a dummy variable that takes the value 1 if the meter is located outside of
downtown and off campus, and the value 0 otherwise
The following Excel results are obtained.
Referring to Table 17-7, predict the meter rate per hour if one parks outside of
downtown and off campus 3 blocks from the quad.
A) -$0.0139
B) $0.2589
C) $0.2604
D) $0.4981
TABLE 19-1
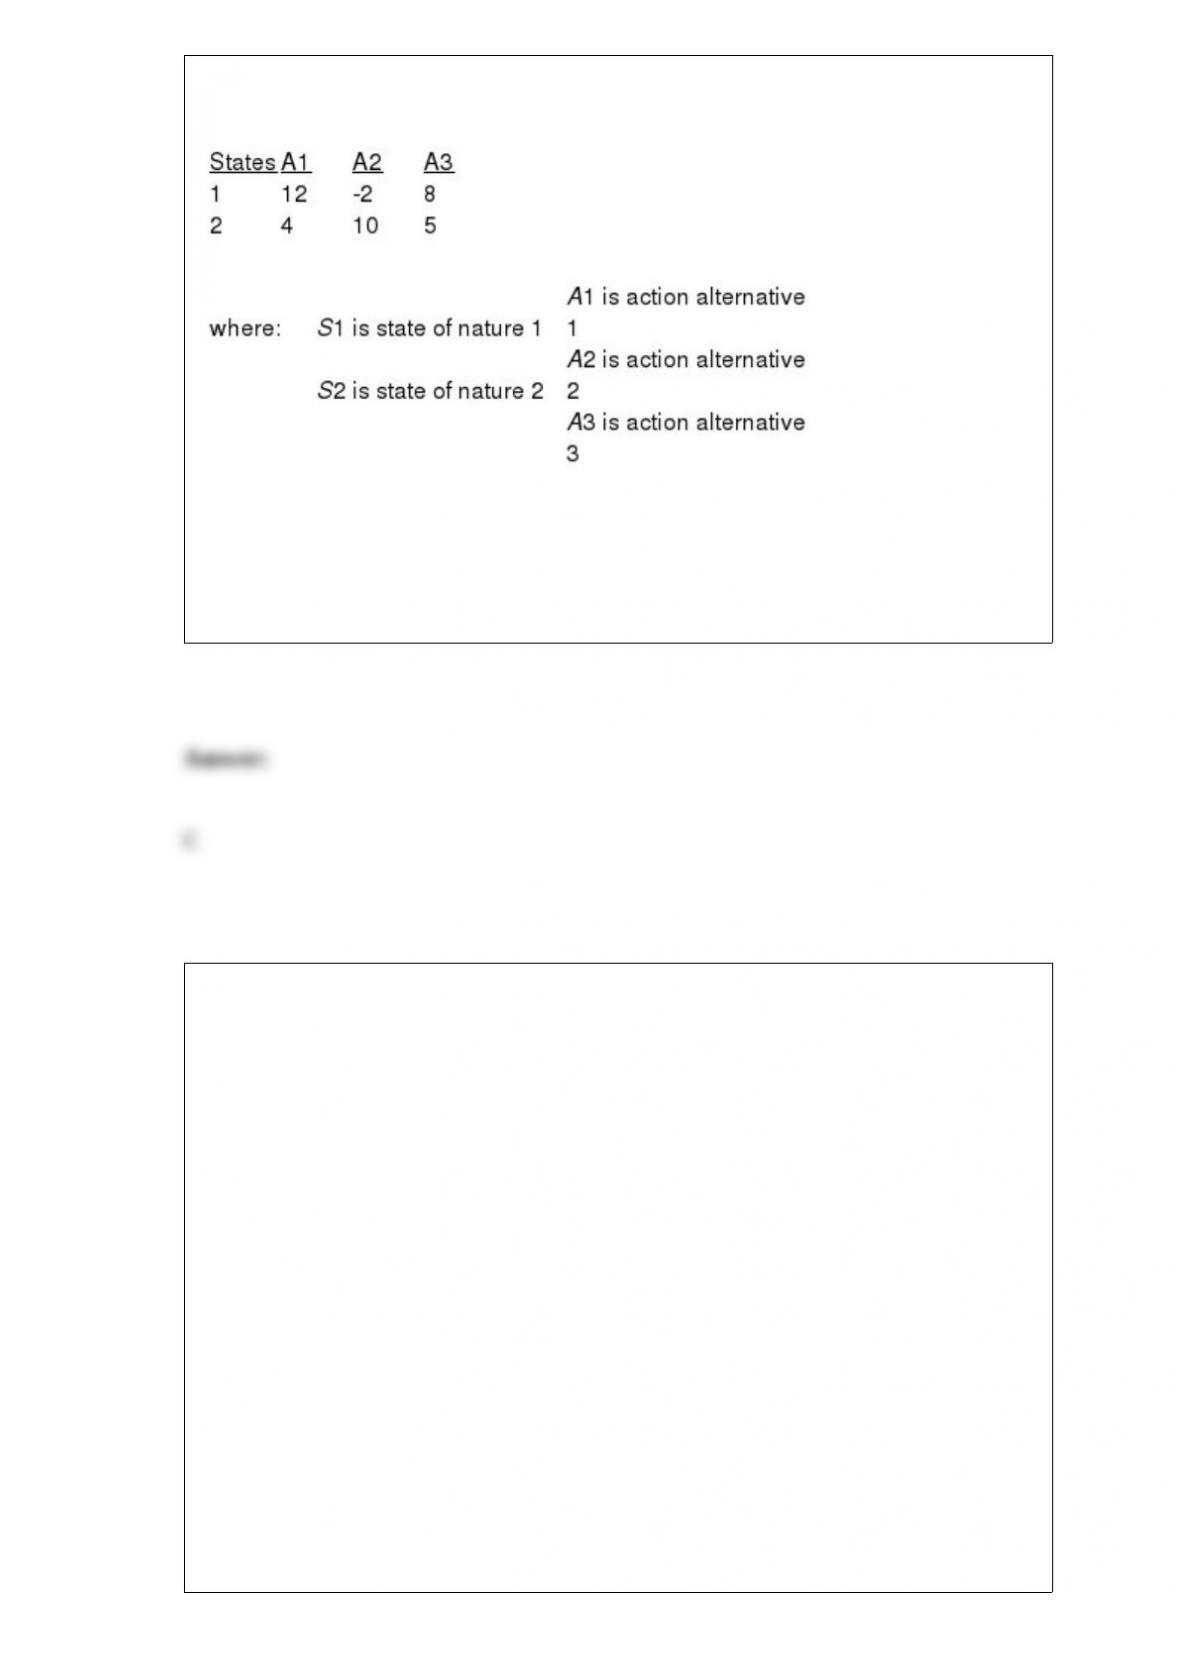
The following payoff table shows profits associated with a set of 3 alternatives under 2
possible states of nature
Referring to Table 19-1, what is the best action using the maximin criterion?
A) Action A1
B) Action A2
C) Action A3
D) It cannot be determined.
Referring to Table 14-12, what is the correct interpretation for the
estimated coefficient for X2?
TABLE 14-12
As a project for his business statistics class, a student examined the
factors that determined parking meter rates throughout the campus
area. Data were collected for the price ($) per hour of parking, blocks
to the quadrangle, and whether the parking is on or o) campus. The
population regression model hypothesized is Yi = α + β1X1i + β2X2i
+ ε
where
Y is the meter price per hour.
X1 is the number of blocks to the quad.
X2 is a dummy variable that takes the value 1 if the meter is located
on campus and 0 otherwise.
The following Excel results are obtained.

A) Holding the effect of the distance from the quad constant, the
estimated mean costs for parking on campus is $0.16 per hour more
than parking o) campus.
B) Holding the effect of the distance from the quad constant, the
estimated mean costs for parking o) campus is $0.16 per hour more
than parking on campus.
C) Holding the effect of the distance from the quad constant, the
estimated mean costs for parking on campus is $0.16 per hour more
than parking o) campus for each additional block away from the
quad.
D) Holding the effect of the distance from the quad constant, the
estimated mean costs for parking o) campus is $0.16 per hour more
than parking on campus for each additional block away from the
quad.
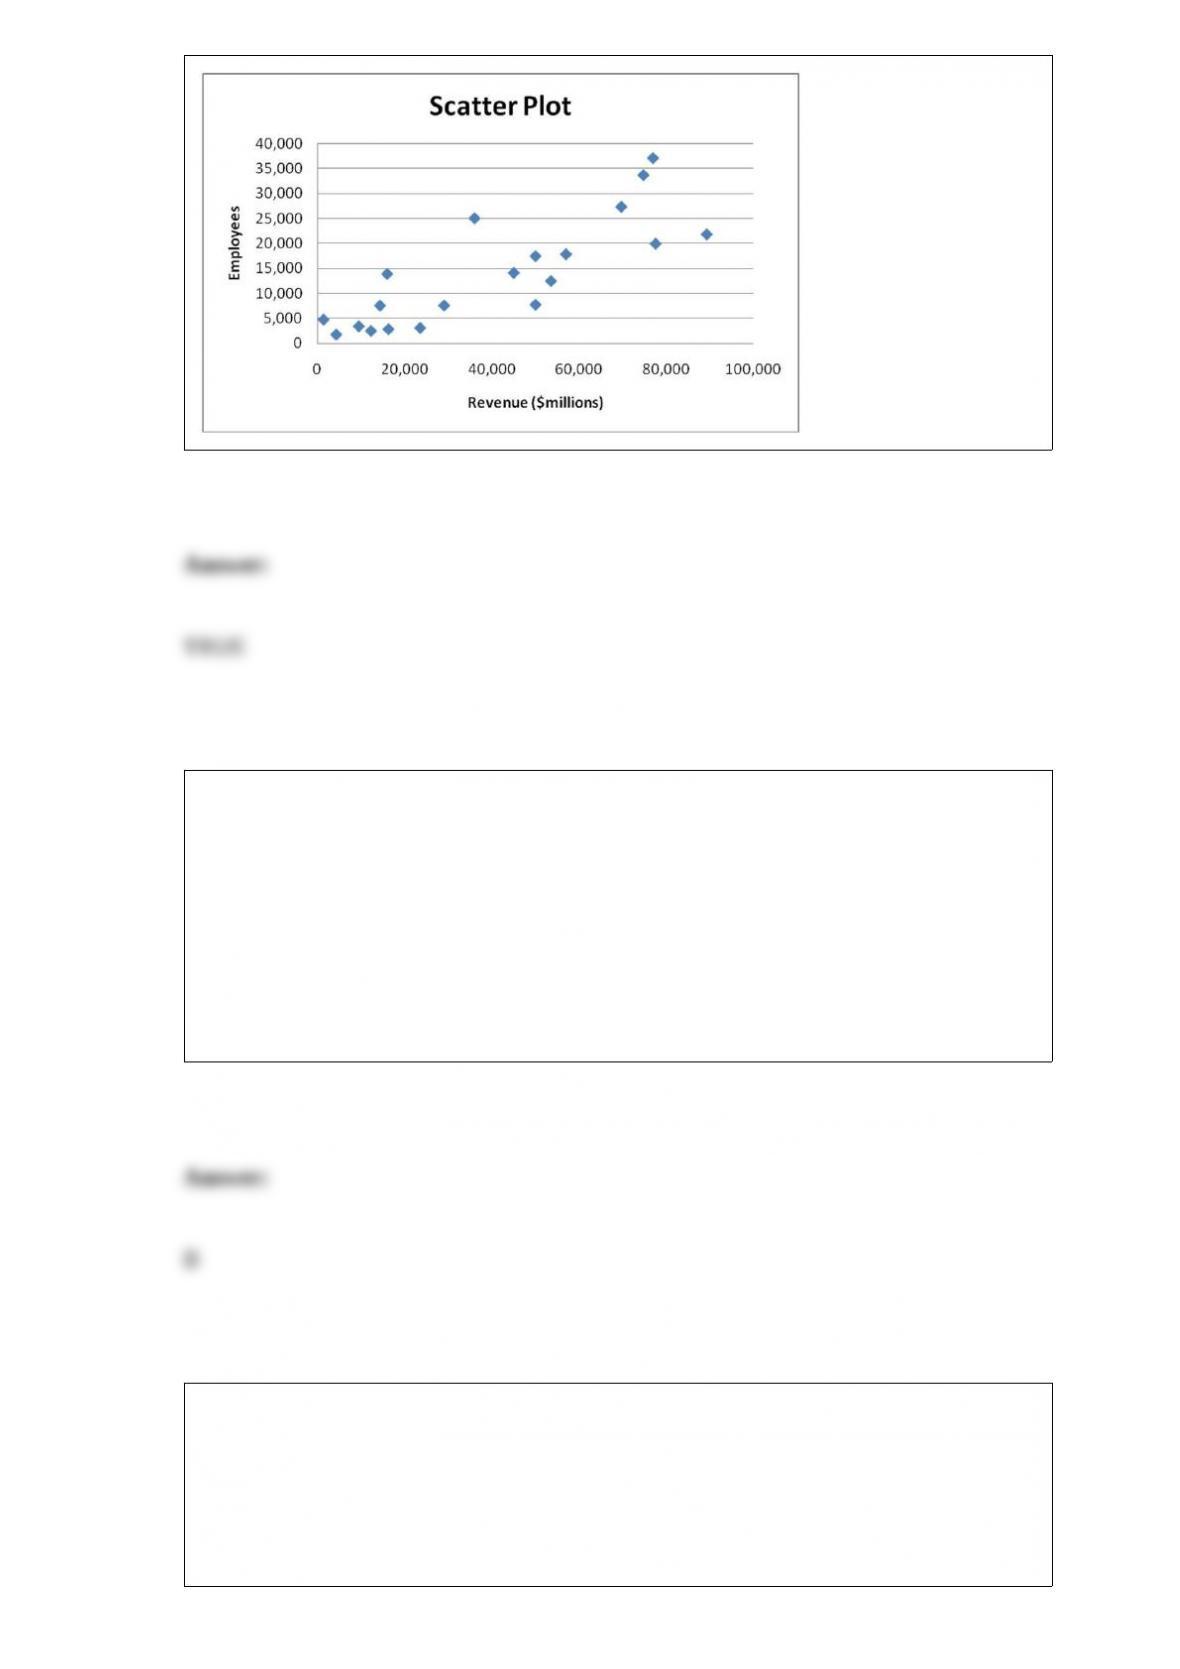
True or False: Given below is the scatter plot of the number of employees and the total
revenue (millions$) of 20 U.S. companies. There appears to be a positive relationship
between total revenue and the number of employees.
If the Durbin-Watson statistic has a value close to 4, which assumption is violated?
A) Normality of the errors
B) Independence of errors
C) Homoscedasticity
D) None of the above
TABLE 1-2
A Wall Street Journal poll asked 2,150 adults in the United States a series of questions
to find out their view on the U.S. economy.
Referring to Table 1-2, the possible responses to the question “How many people in
your household are unemployed currently?” result in
A) a nominal scale variable.
B) an ordinal scale variable.
C) an interval scale variable.
D) a ratio scale variable.
Referring to Table 14-4, which of the following values for the level of significance is
the smallest for which at most one explanatory variable is significant individually?
A) 0.001
B) 0.010
C) 0.025
D) 0.050
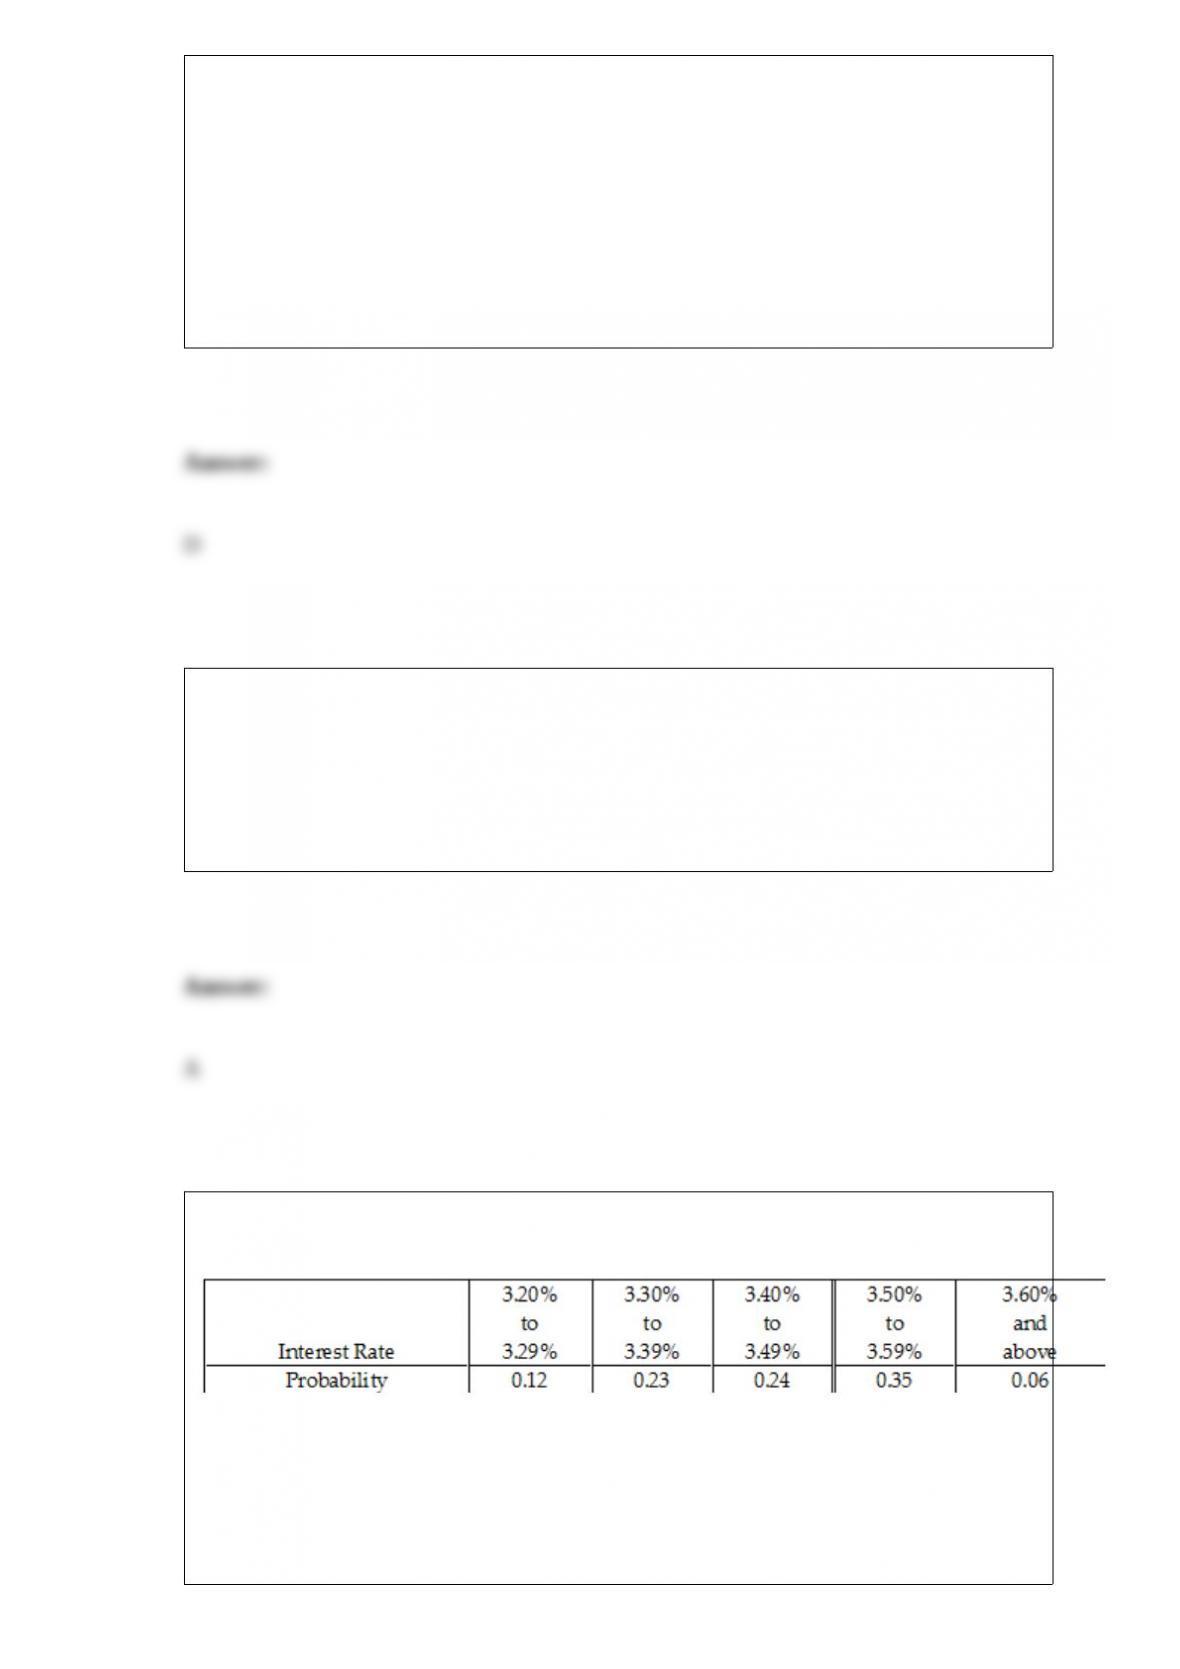
A survey of banks revealed the following distribution for the interest rate being charged
on a home loan (based on a 30-year mortgage with a 10% down payment).
If a bank is selected at random from this distribution, what is the chance that the interest
rate charged on a home loan will exceed 3.49%?
A) 0.06
B) 0.41
C) 0.59
D) 1.00
Data on the amount of time spent studying for a particular exam at a high school were
collected for 150 students. You want to know if half of the students spent at least how
much time studying for that exam. Which of the following would you compute?
A) Arithmetic mean
B) Median
C) Coefficient of variation
D) Coefficient of correlation
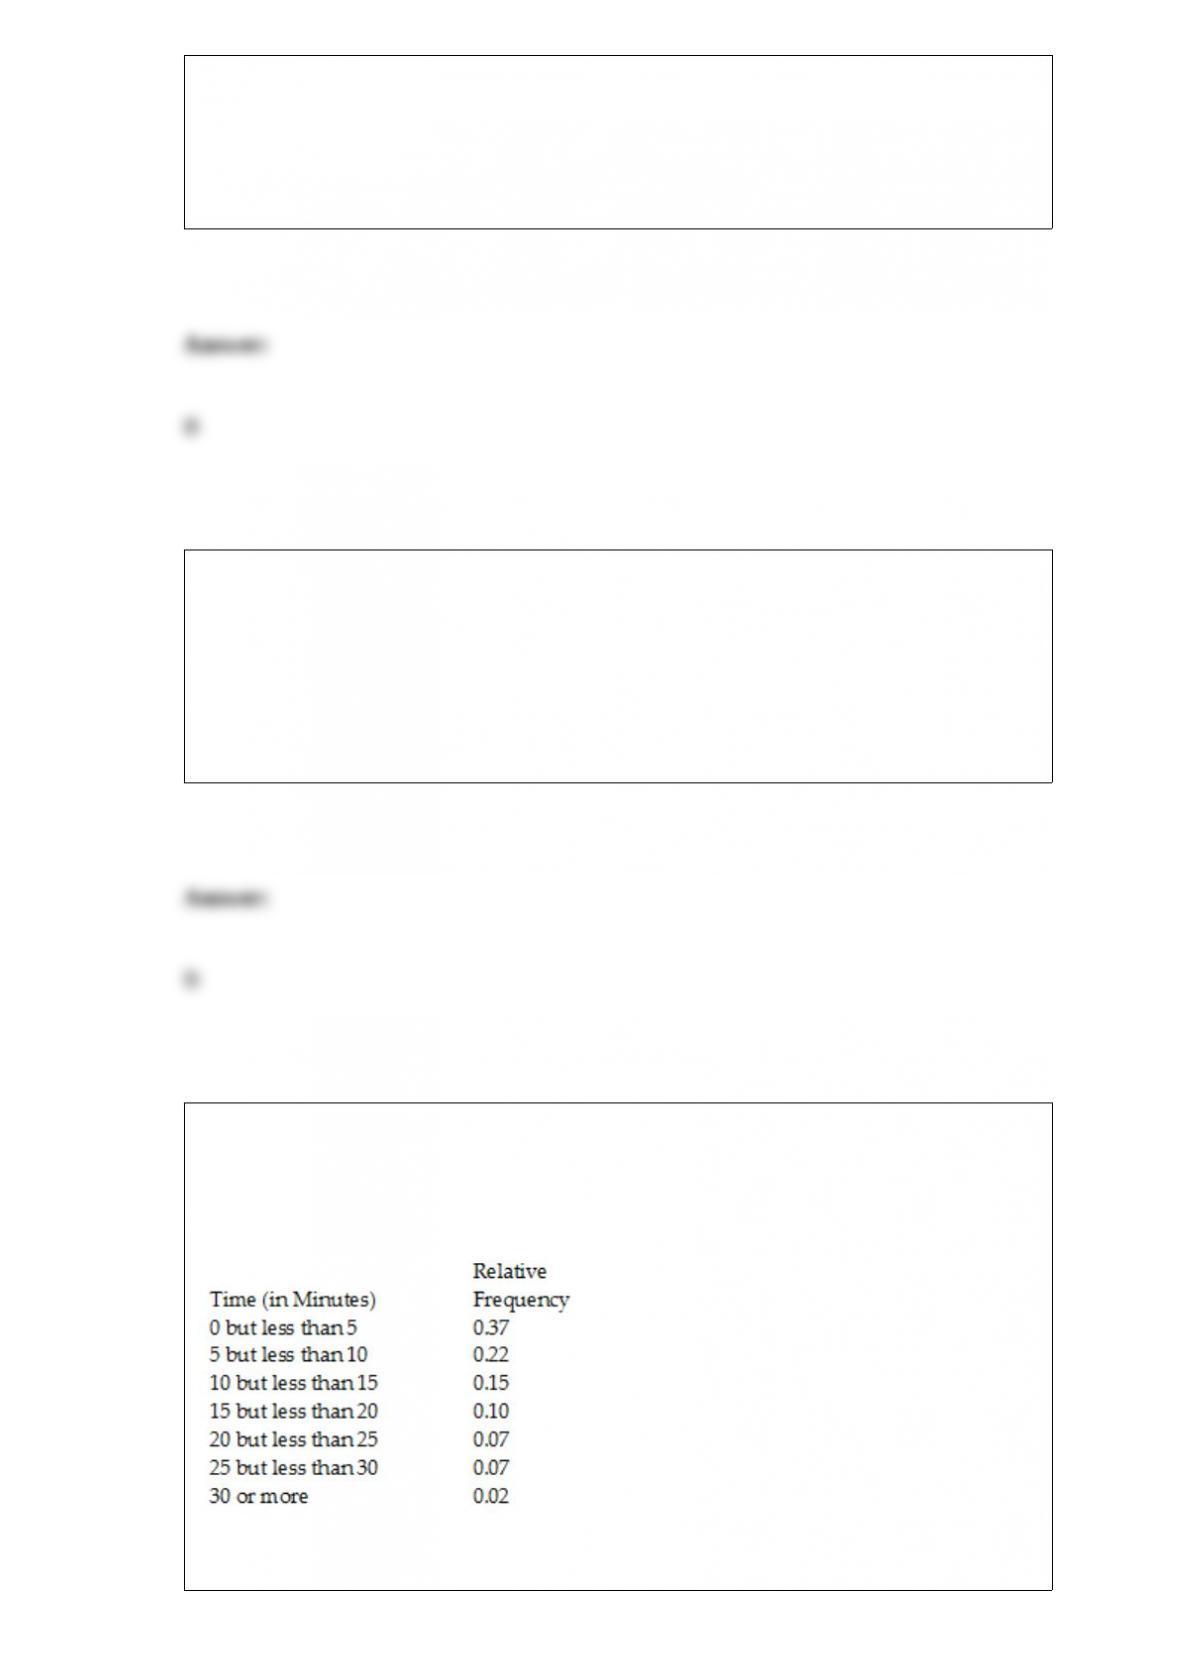
TABLE 2-5
The following are the duration in minutes of a sample of long-distance phone calls
made within the continental United States reported by one long-distance carrier.
Referring to Table 2-5, what is the cumulative relative frequency for the percentage of
calls that lasted 10 minutes or more?
A) 0.16
B) 0.24
C) 0.41
D) 0.90
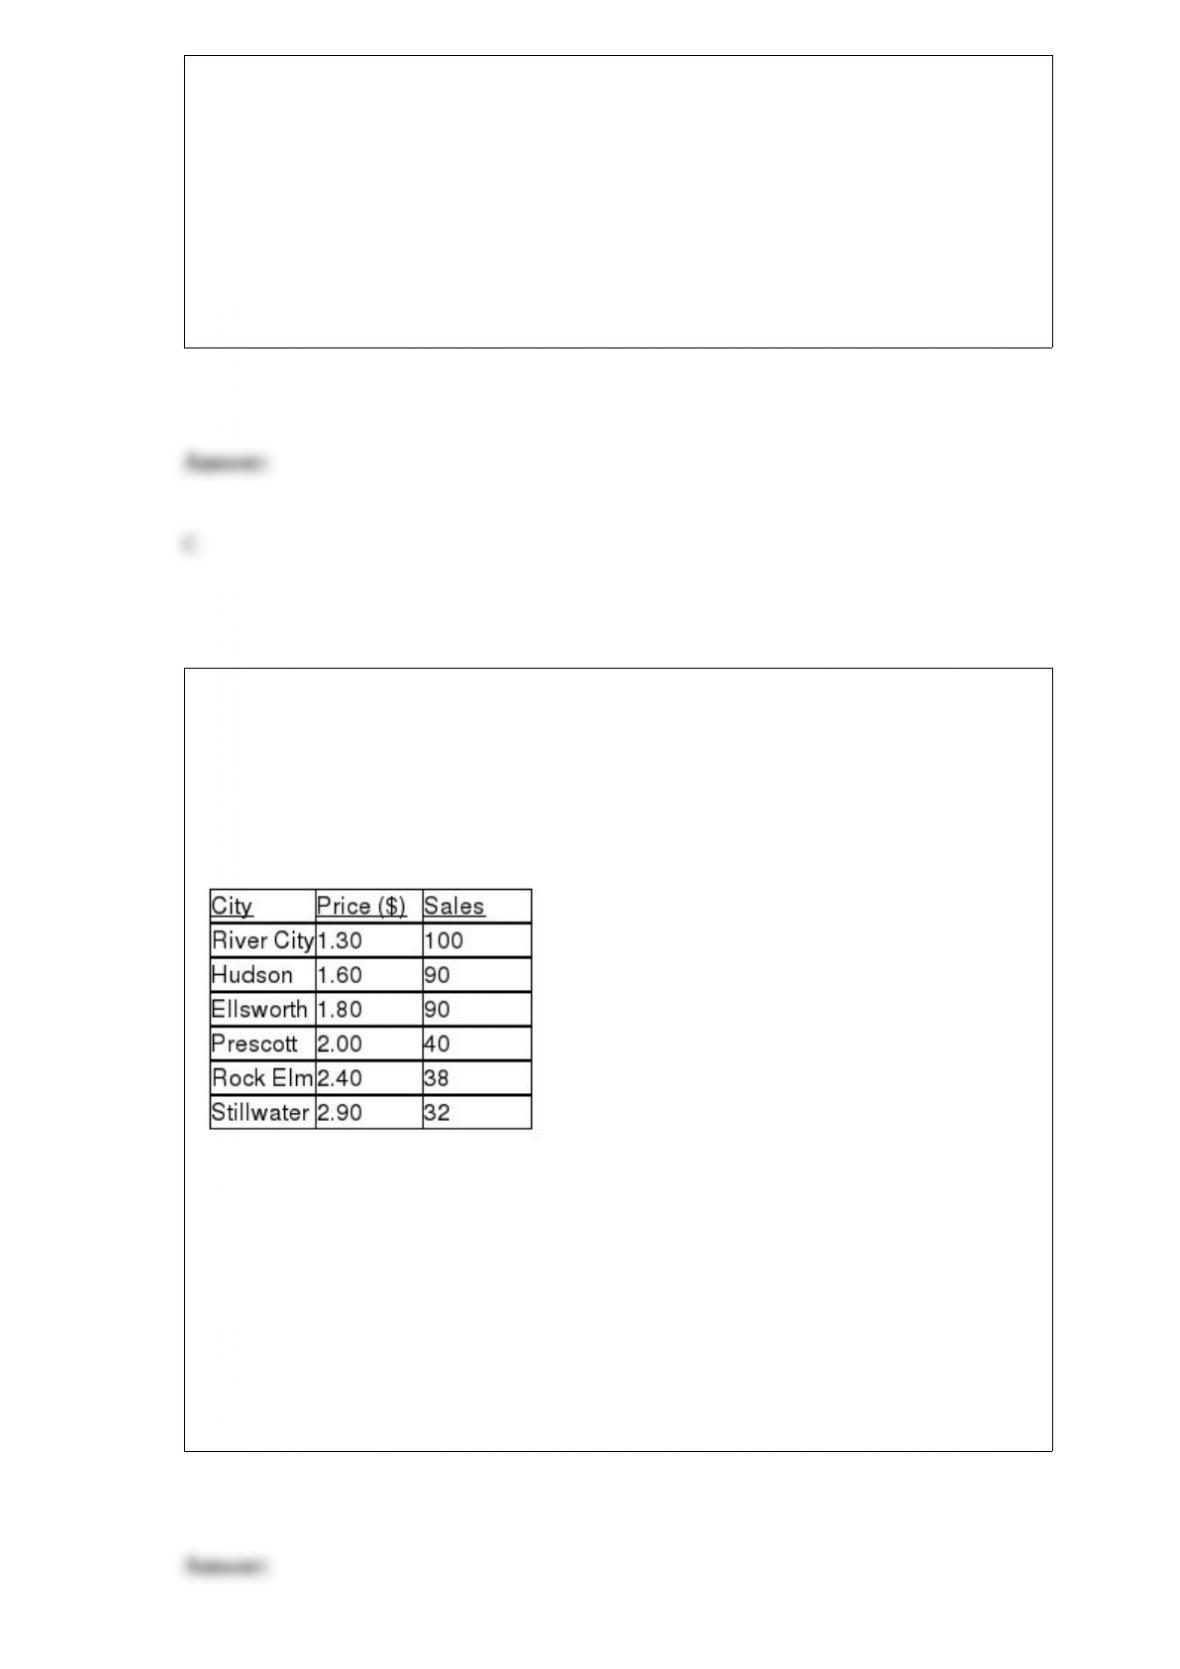
TABLE 13-2
A candy bar manufacturer is interested in trying to estimate how sales are influenced by
the price of their product. To do this, the company randomly chooses 6 small cities and
offers the candy bar at different prices. Using candy bar sales as the dependent variable,
the company will conduct a simple linear regression on the data below:
Referring to Table 13-2, what is the coefficient of correlation for these data?
A) -0.8854
B) -0.7839
C) 0.7839
D) 0.8854

A national trend predicts that women will account for half of all business travelers in
the next 3 years. To attract these women business travelers, hotels are providing more
amenities that women particularly like. A recent survey of American hotels found that
70% offer hairdryers in the bathrooms. Consider a random and independent sample of
20 hotels. Find the probability that at least 9 of the hotels in the sample do not offer
hairdryers in the bathrooms.
TABLE 6-2
John has two jobs. For daytime work at a jewelry store he is paid $15,000 per month,
plus a commission. His monthly commission is normally distributed with a mean of
$10,000 and a standard deviation of $2,000. At night he works occasionally as a waiter,
for which his monthly income is normally distributed with a mean of $1,000 and a
standard deviation of $300. John’s income levels from these two sources are
independent of each other.
Referring to Table 6-2, for a given month, what is the probability that John’s
commission from the jewelry store is between $9,000 and $11,000?
A study at a college in the west coast reveals that, historically, 45% of the students are
minority students. If random sample sizes of 75 are selected, 95% of the samples will
have more than ________% of minority students.
There are 47 contestants at a national dog show. How many different ways can
contestants fill the first place, second place, and third place positions?
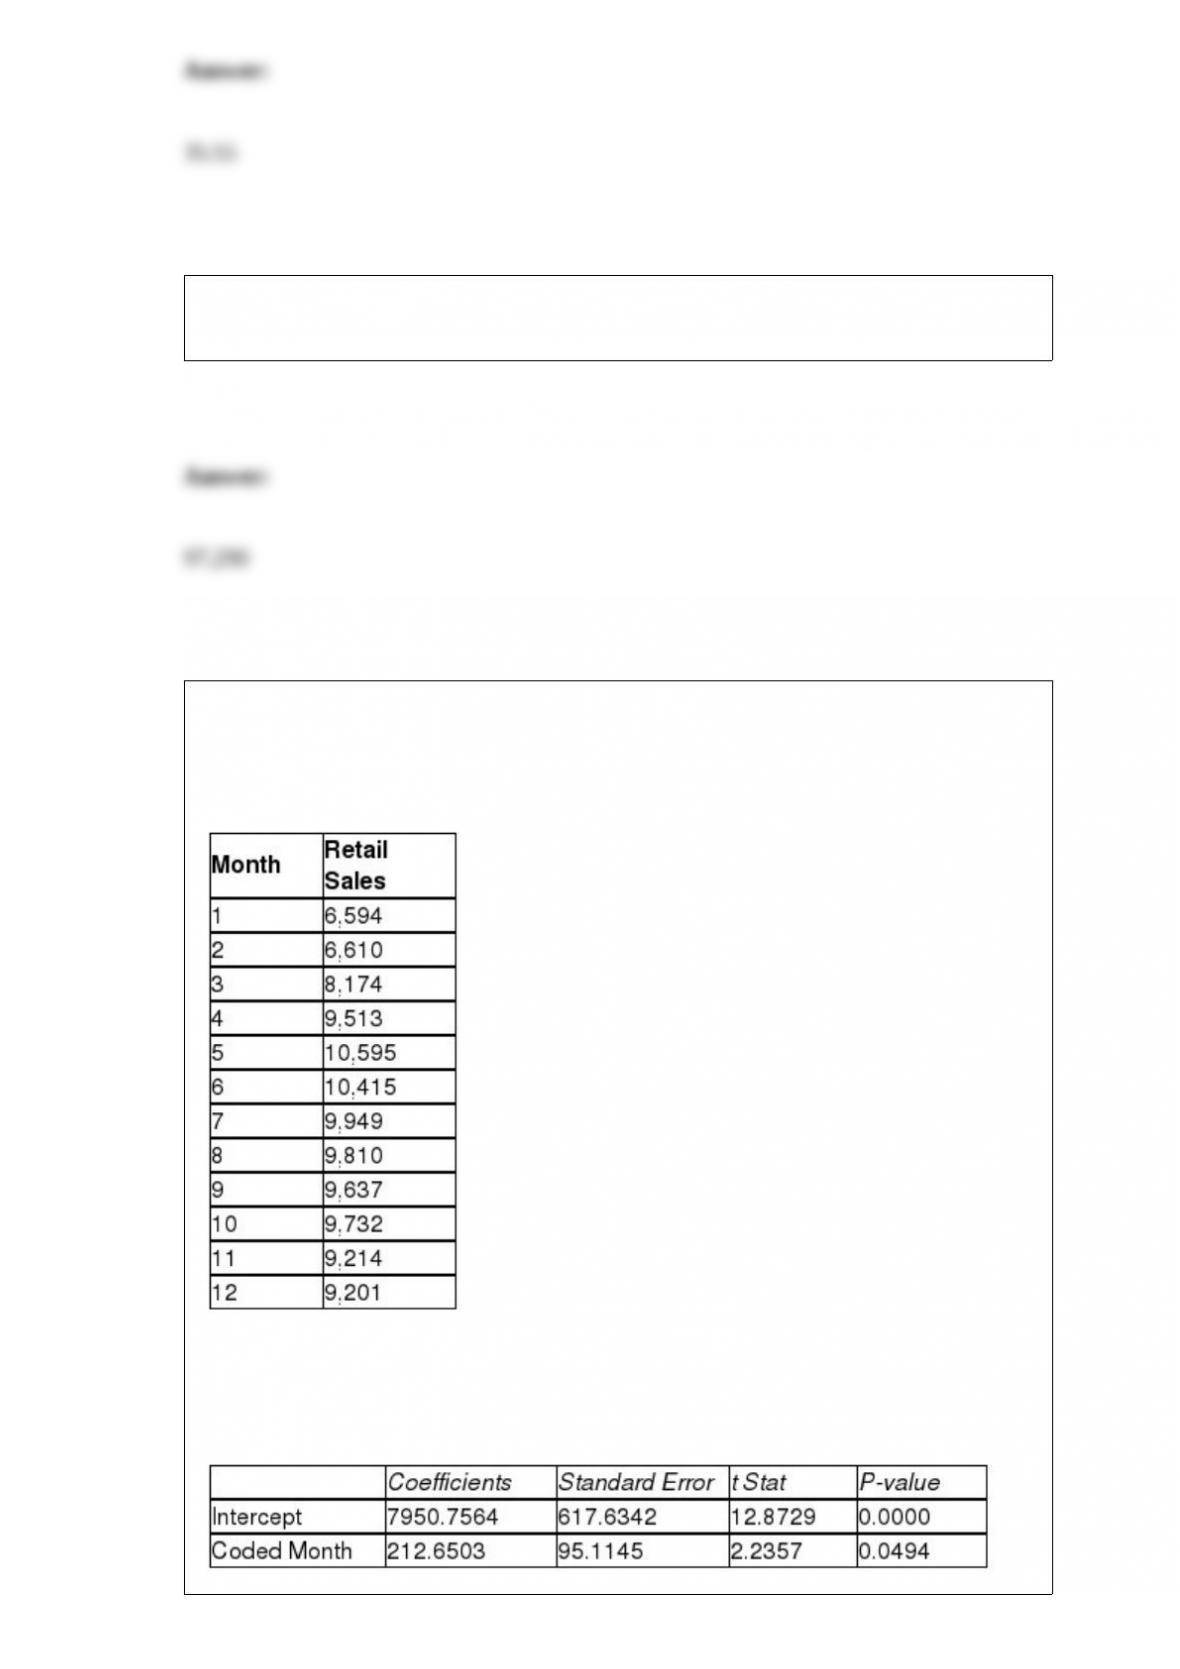
TABLE 16-13
Given below is the monthly time-series data for U.S. retail sales of building materials
over a specific year.
The results of the linear trend, quadratic trend, exponential trend, first-order
autoregressive, second-order autoregressive and third-order autoregressive model are
presented below in which the coded month for the 1st month is 0:
Linear trend model:
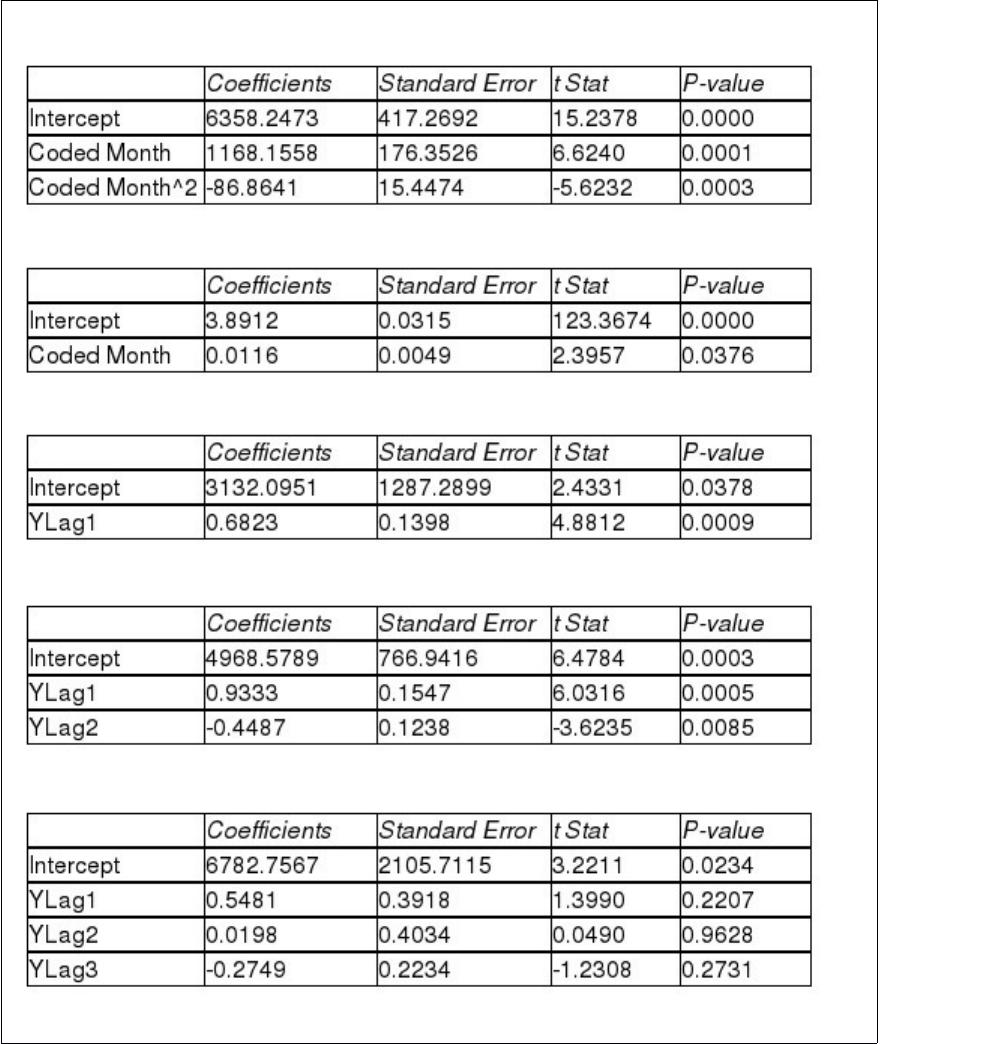
Quadratic trend model:
Exponential trend model:
First-order autoregressive:
Second-order autoregressive:
Third-order autoregressive:
Below is the residual plot of the various models:
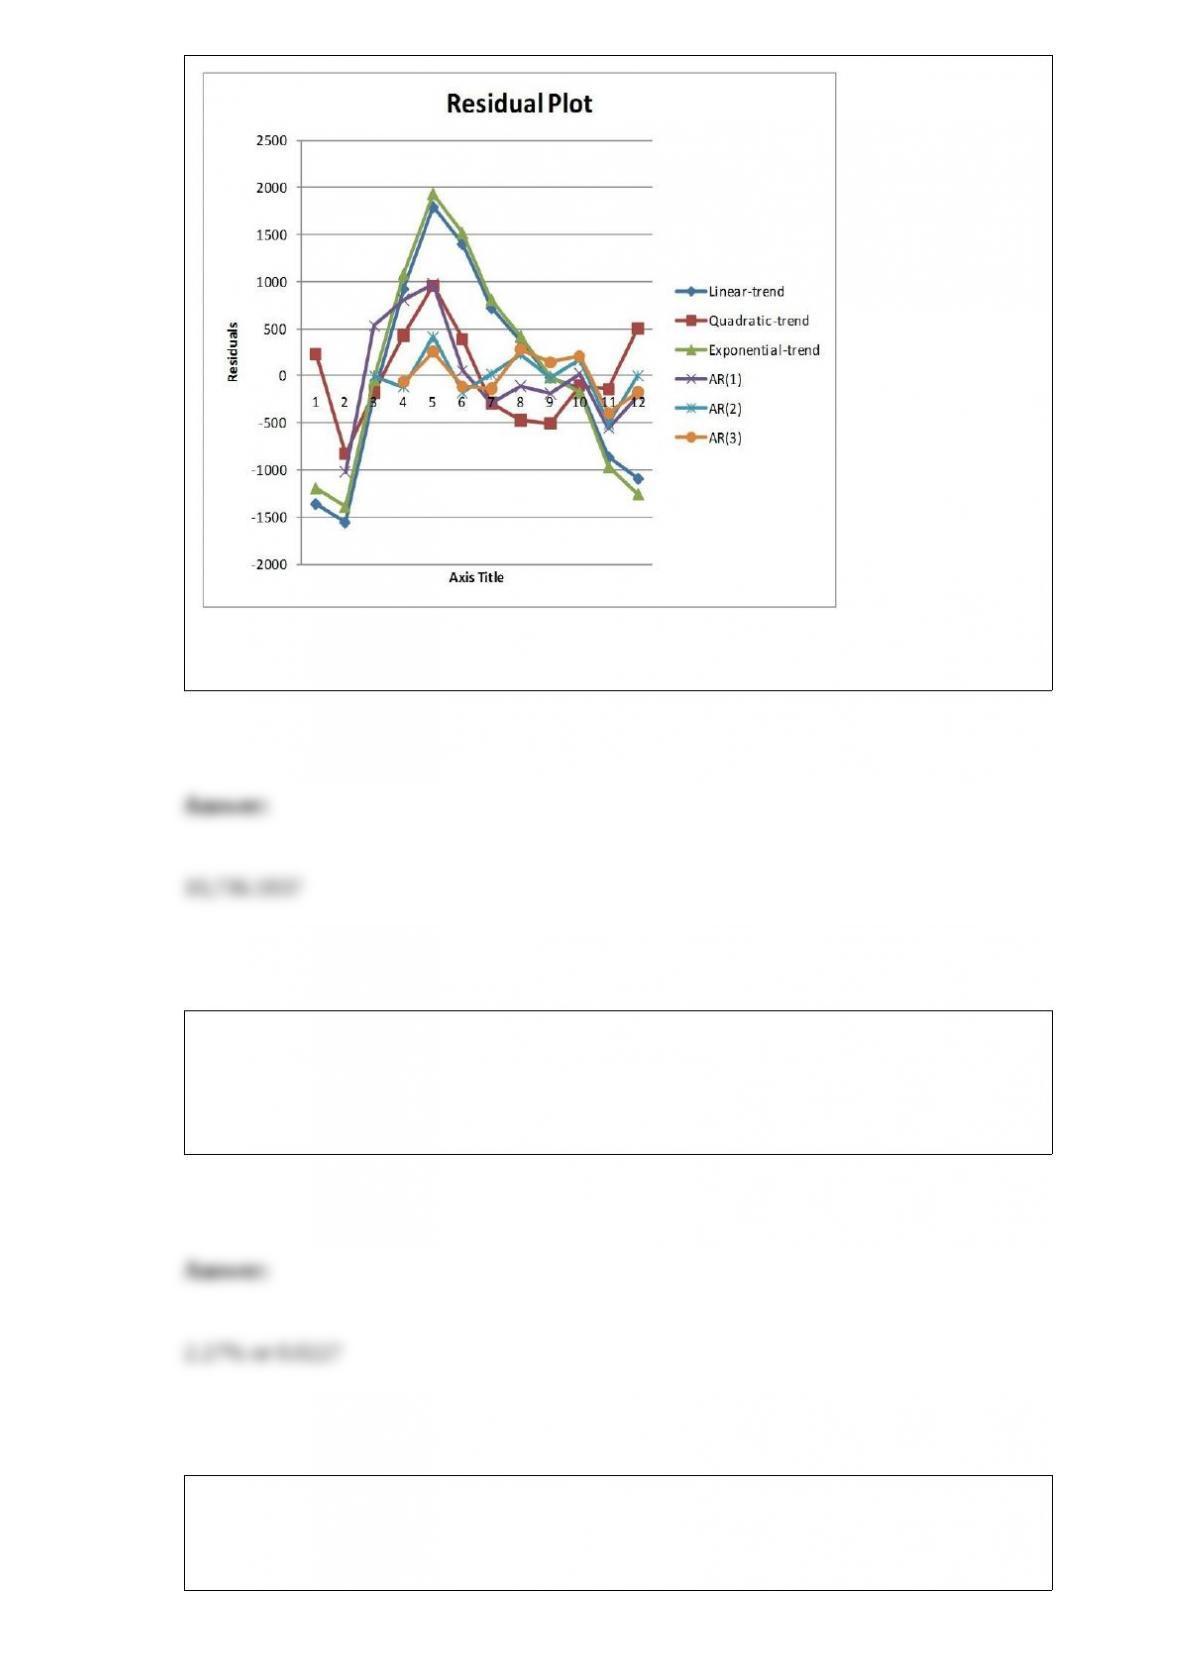
Referring to Table 16-13, what is your forecast for the 13th month using the
exponential-trend model?
You were told that the mean score on a statistics exam is 75 with the scores normally
distributed. In addition, you know the probability of a score between 55 and 60 is
4.41% and that the probability of a score greater than 90 is 6.68%. What is the
probability of a score greater than 95?
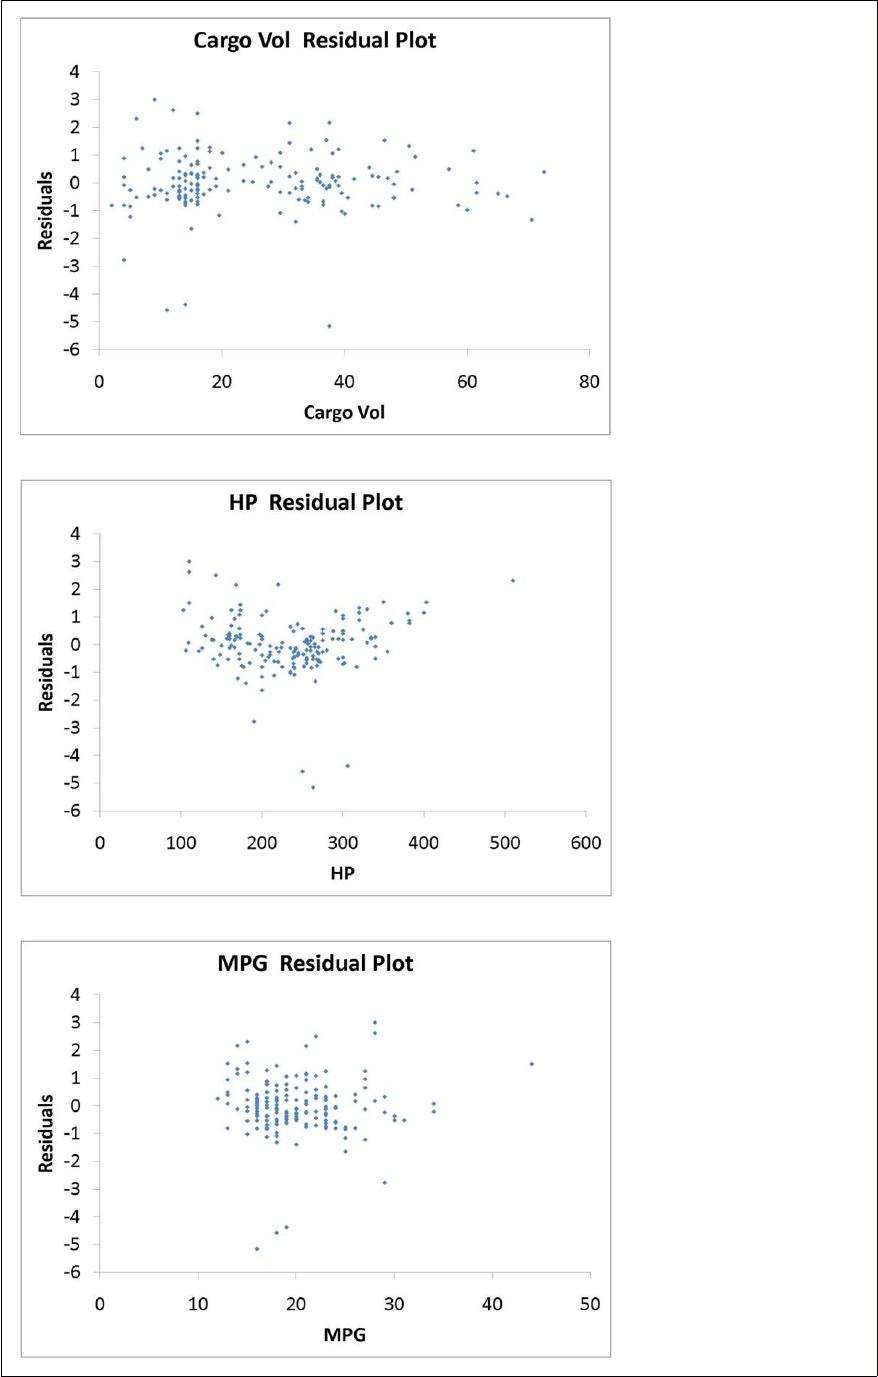
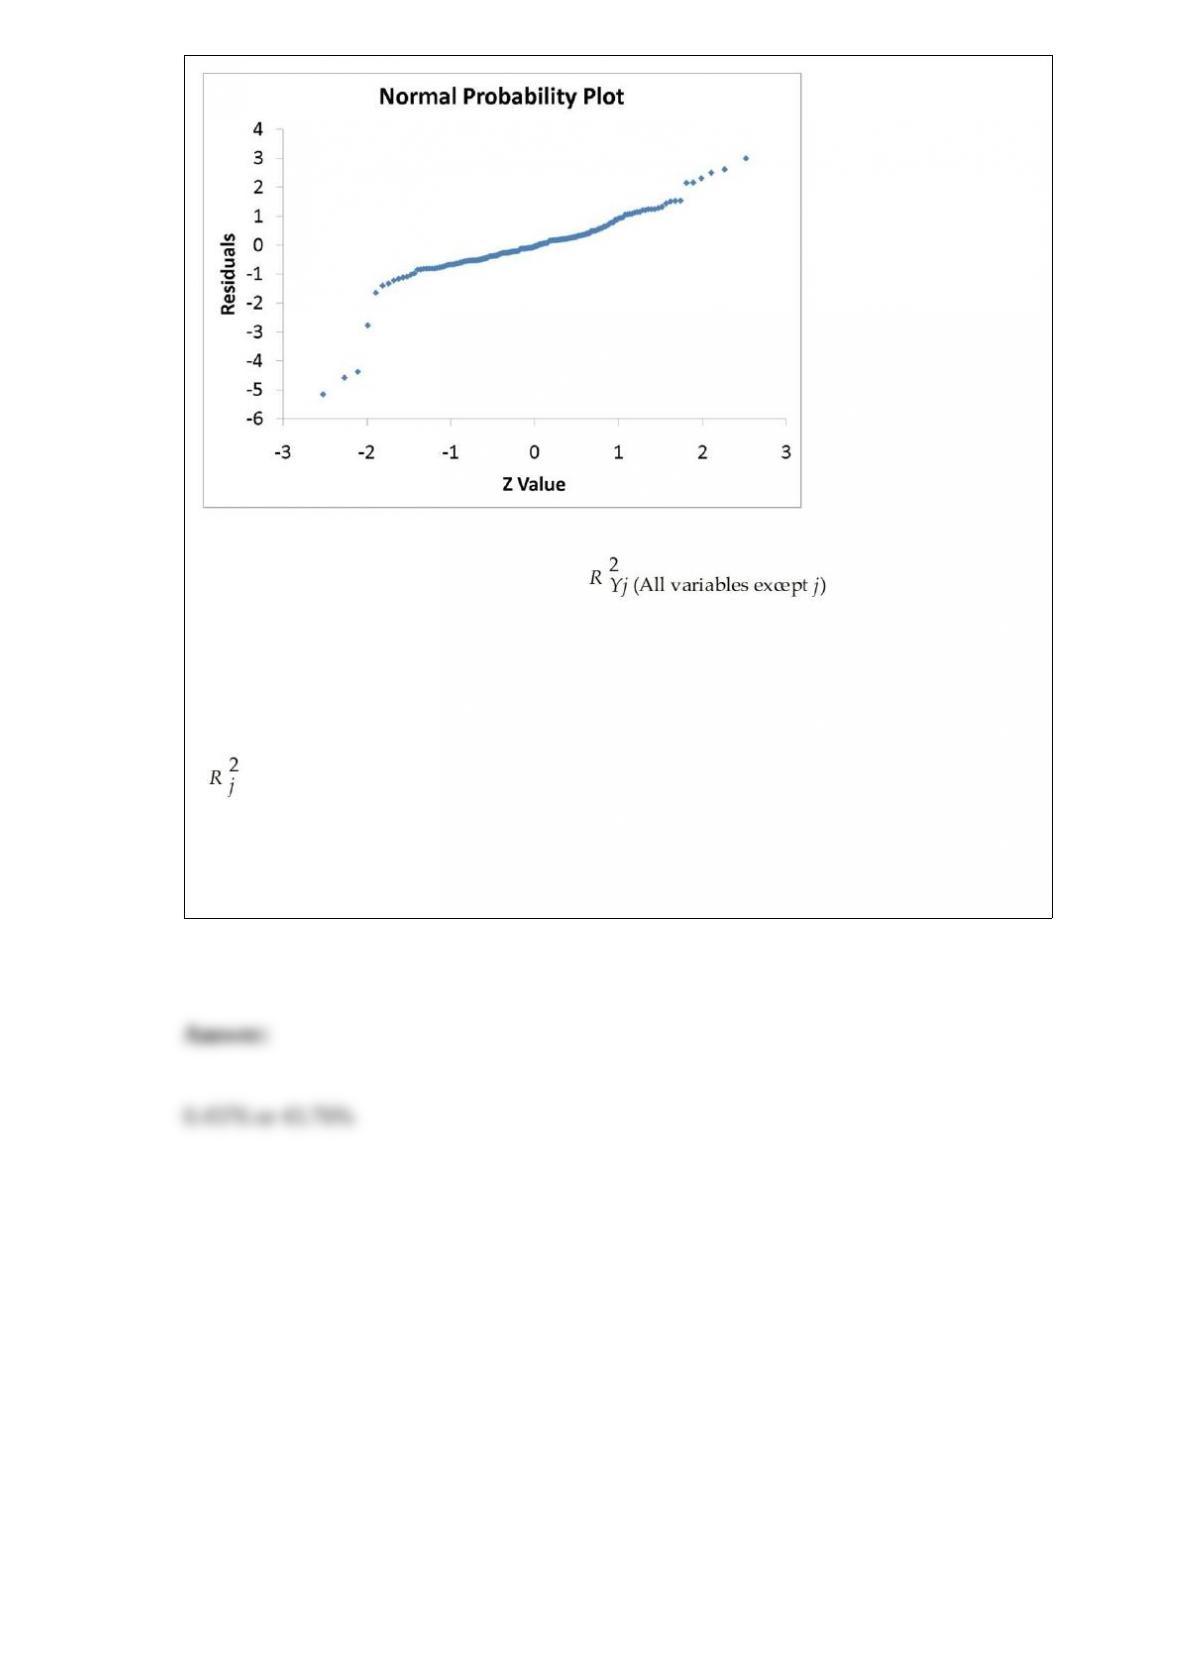
TABLE 17-9
What are the factors that determine the acceleration time (in sec.) from 0 to 60 miles per
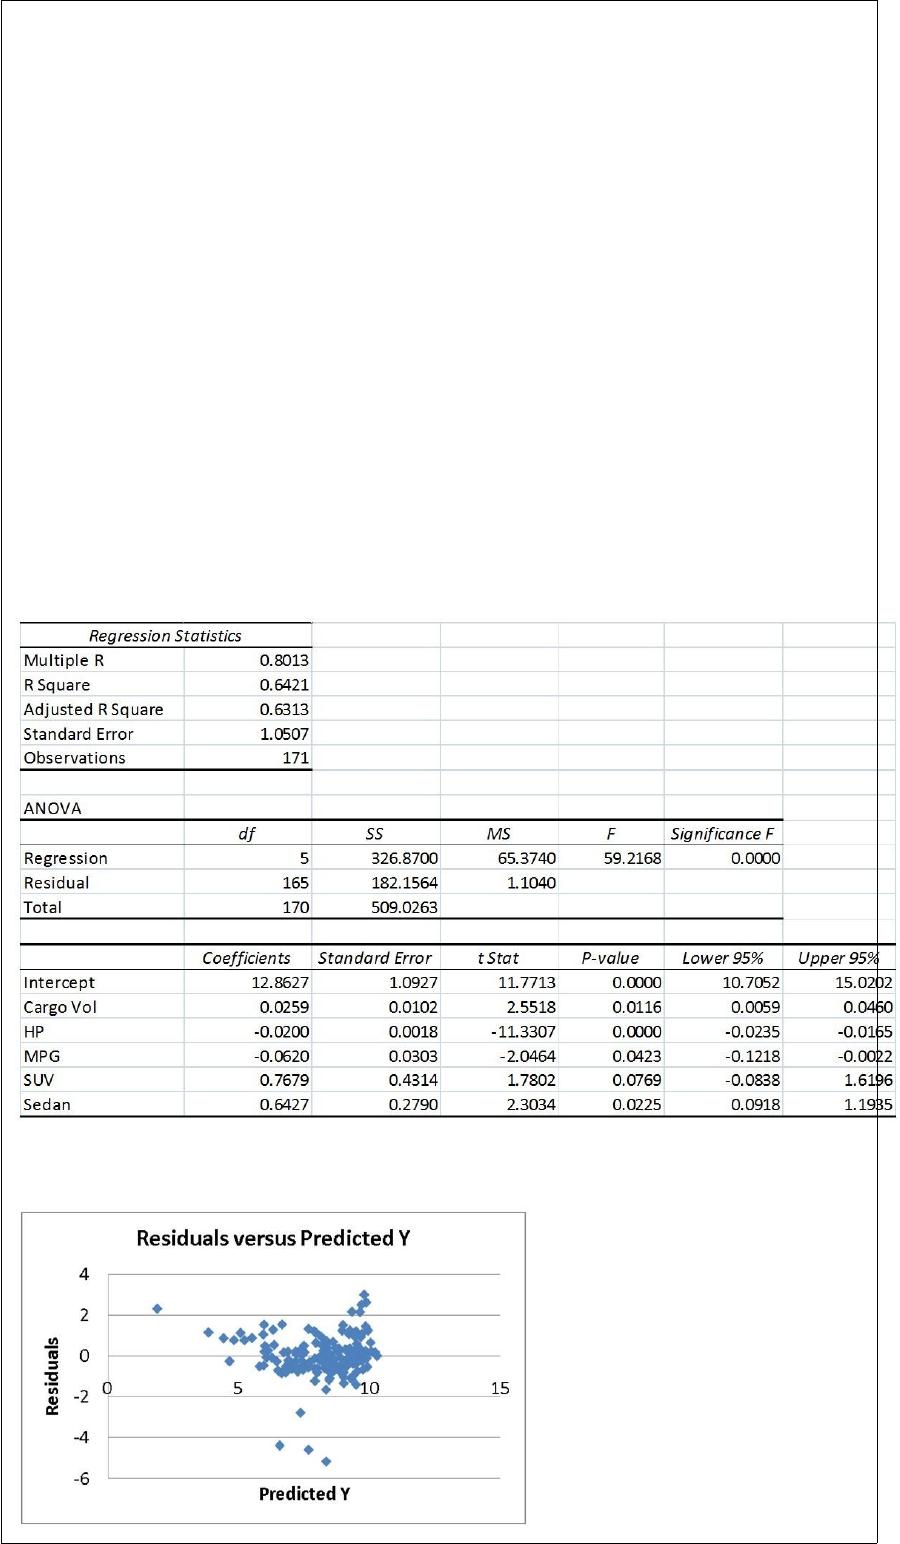
hour of a car? Data on the following variables for 171 different vehicle models were
collected:
Accel Time: Acceleration time in sec.
Cargo Vol: Cargo volume in cu. ft.
HP: Horsepower
MPG: Miles per gallon
SUV: 1 if the vehicle model is an SUV with Coupe as the base when SUV and Sedan
are both 0
Sedan: 1 if the vehicle model is a sedan with Coupe as the base when SUV and Sedan
are both 0
The regression results using acceleration time as the dependent variable and the
remaining variables as the independent variables are presented below.
The various residual plots are as shown below.
The coefficient of partial determination ( ) of each of the 5
predictors are, respectively, 0.0380, 0.4376, 0.0248, 0.0188, and 0.0312.
The coefficient of multiple determination for the regression model using each of the 5
variables Xj as the dependent variable and all other X variables as independent variables
( ) are, respectively, 0.7461, 0.5676, 0.6764, 0.8582, 0.6632.
Referring to Table 17-9, ________ of the variation in Accel Time can be explained by
HP while controlling for the other independent variables.