At the International Pancakes Hut, there are 4 different ways to have an egg cooked, 7
different choices of pancakes, 5 different types of syrups and 8 different beverages.
How many different ways are there to order an egg, a pancake with a choice of syrup
and a beverage?
The Department of Commerce in a particular state has determined that the number of
small businesses that declare bankruptcy per month is approximately a Poisson
distribution with a mean of 6.4. Find the probability that more than 3 bankruptcies
occur next month.
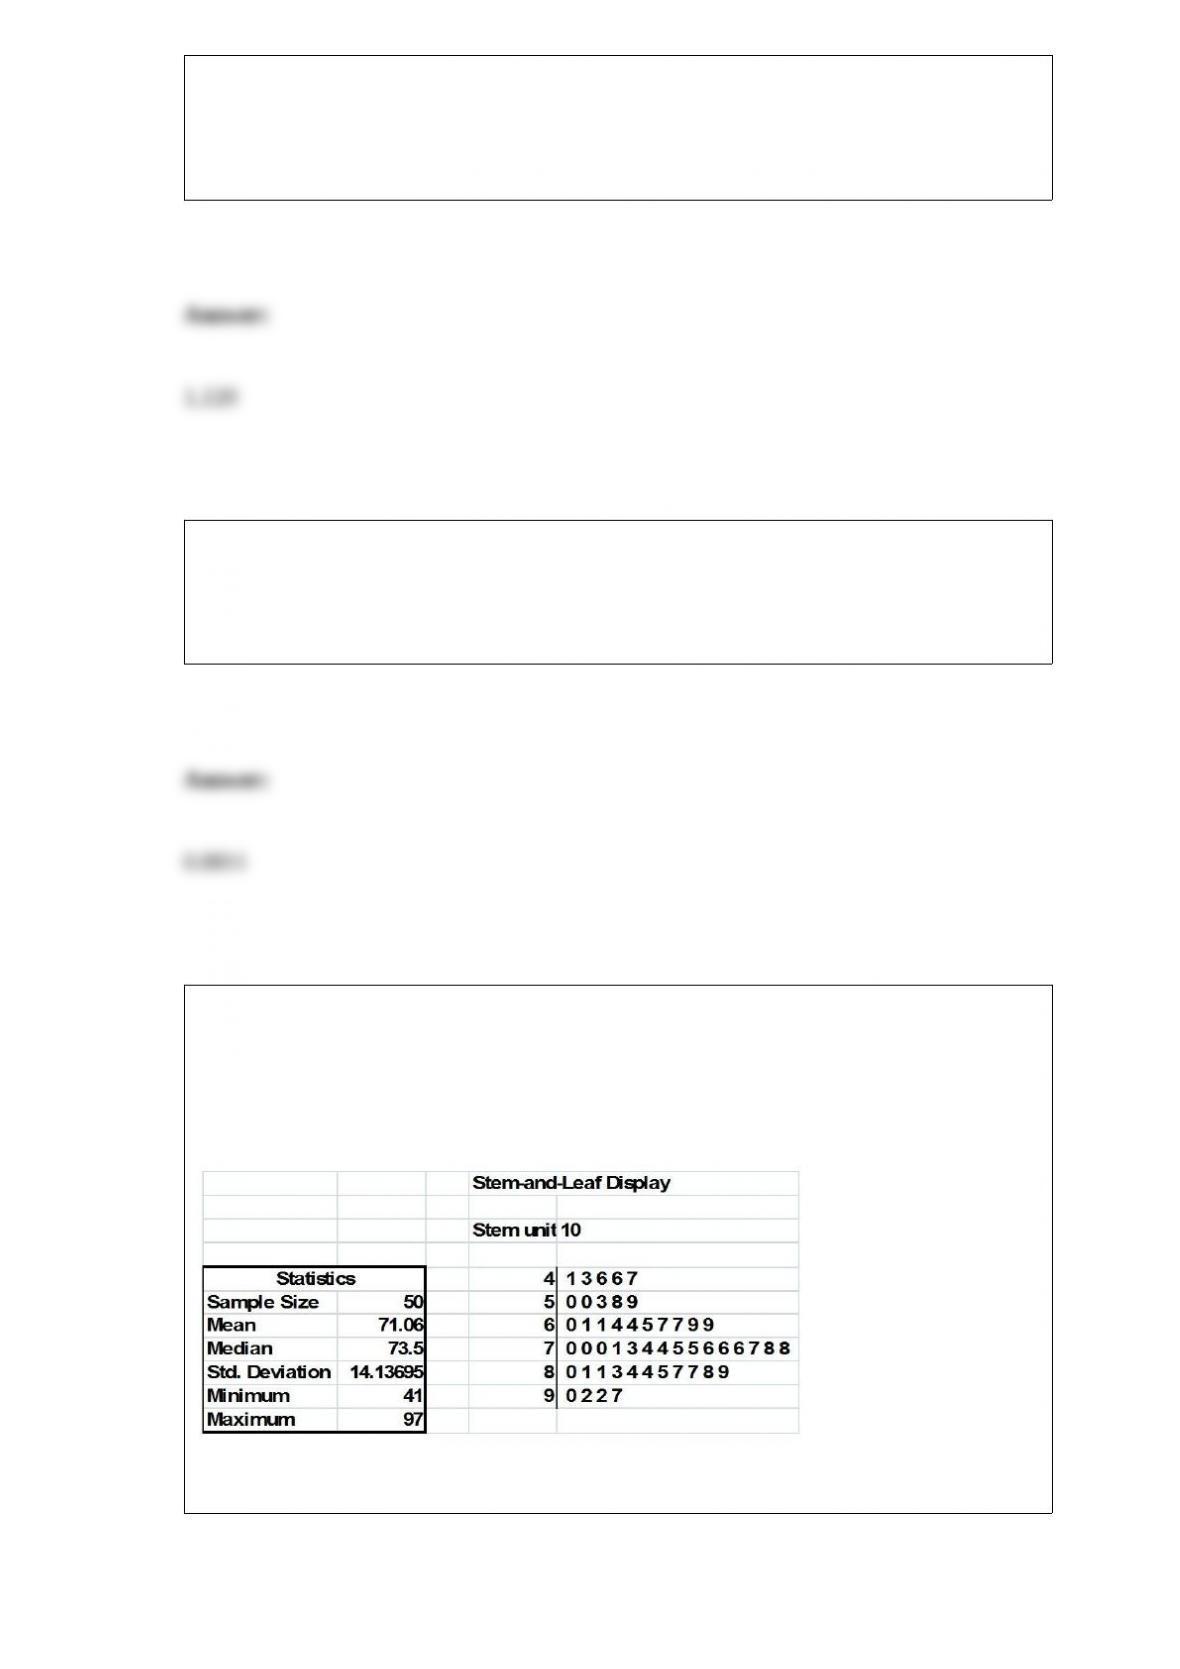
TABLE 2-18
The stem-and-leaf display below shows the result of a survey of 50 students on their
satisfaction with their school, with the higher scores representing a higher level of
satisfaction.
Referring to Table 2-18, what was the highest level of satisfaction?
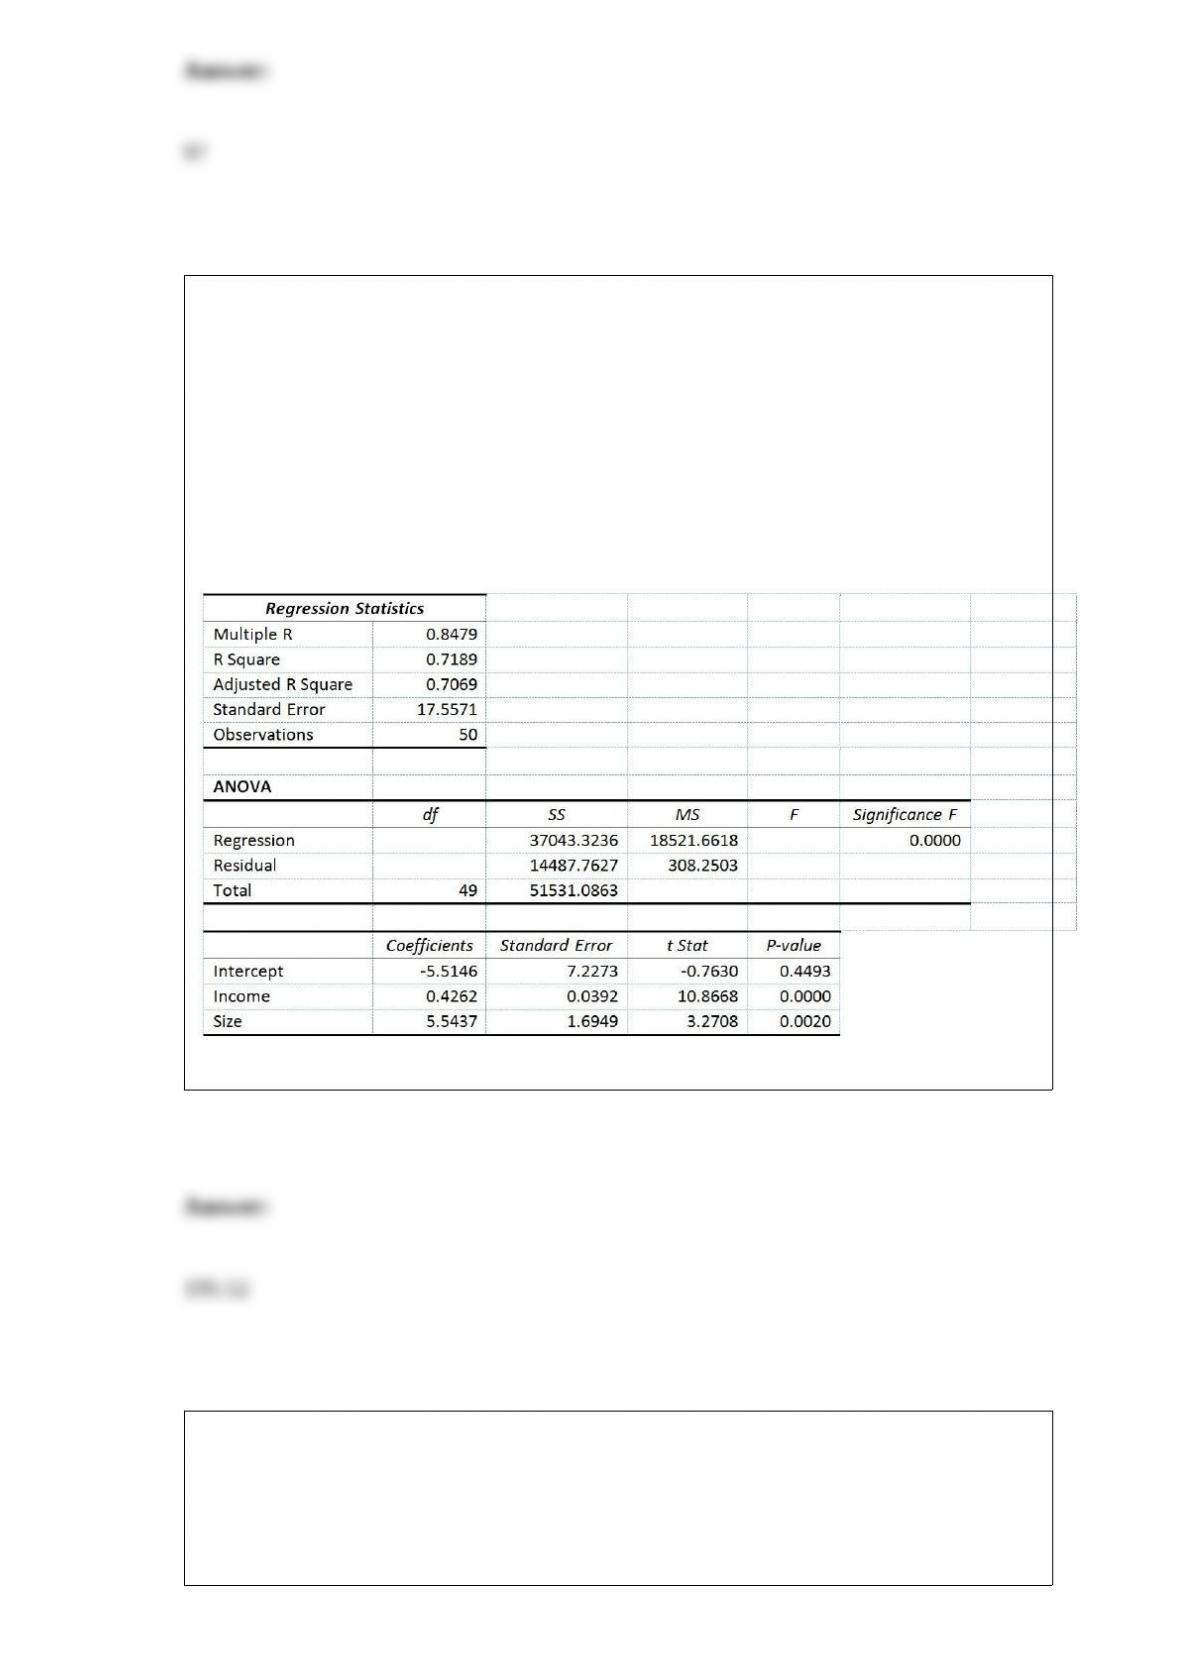
Referring to Table 14-4, what annual income (in thousands of dollars) would an
individual with a family size of 4 need to attain a predicted 10,000 square foot home
(House = 100)?
TABLE 14-4
A real estate builder wishes to determine how house size (House) is influenced by
family income (Income) and family size (Size). House size is measured in hundreds of
square feet and income is measured in thousands of dollars. The builder randomly
selected 50 families and ran the multiple regression. Partial Microsoft Excel output is
provided below:
Also SSR (X1∣ X2) = 36400.6326 and SSR (X2∣ X1) = 3297.7917
TABLE 15-4
The superintendent of a school district wanted to predict the percentage of students
passing a sixth-grade proficiency test. She obtained the data on percentage of students
passing the proficiency test (% Passing), daily mean of the percentage of students
attending class (% Attendance), mean teacher salary in dollars (Salaries), and
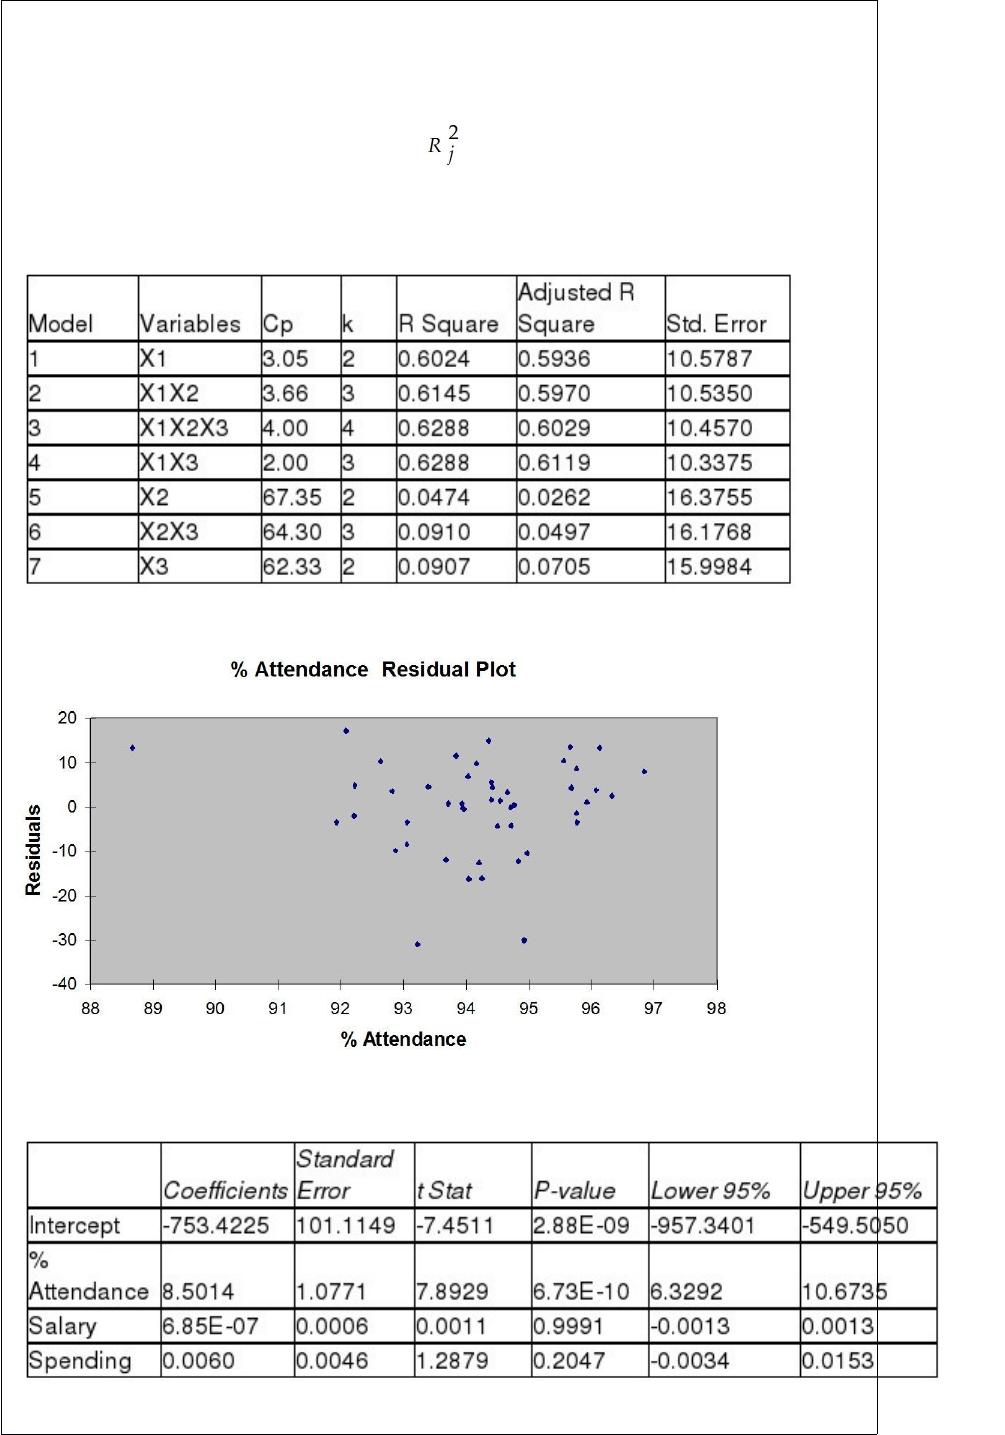
instructional spending per pupil in dollars (Spending) of 47 schools in the state.
Let Y = % Passing as the dependent variable, X1 = % Attendance, X2 = Salaries and X3
= Spending.
The coefficient of multiple determination ( ) of each of the 3 predictors with all the
other remaining predictors are, respectively, 0.0338, 0.4669, and 0.4743.
The output from the best-subset regressions is given below:
Following is the residual plot for % Attendance:
Following is the output of several multiple regression models:
Model (I):
Model (II):
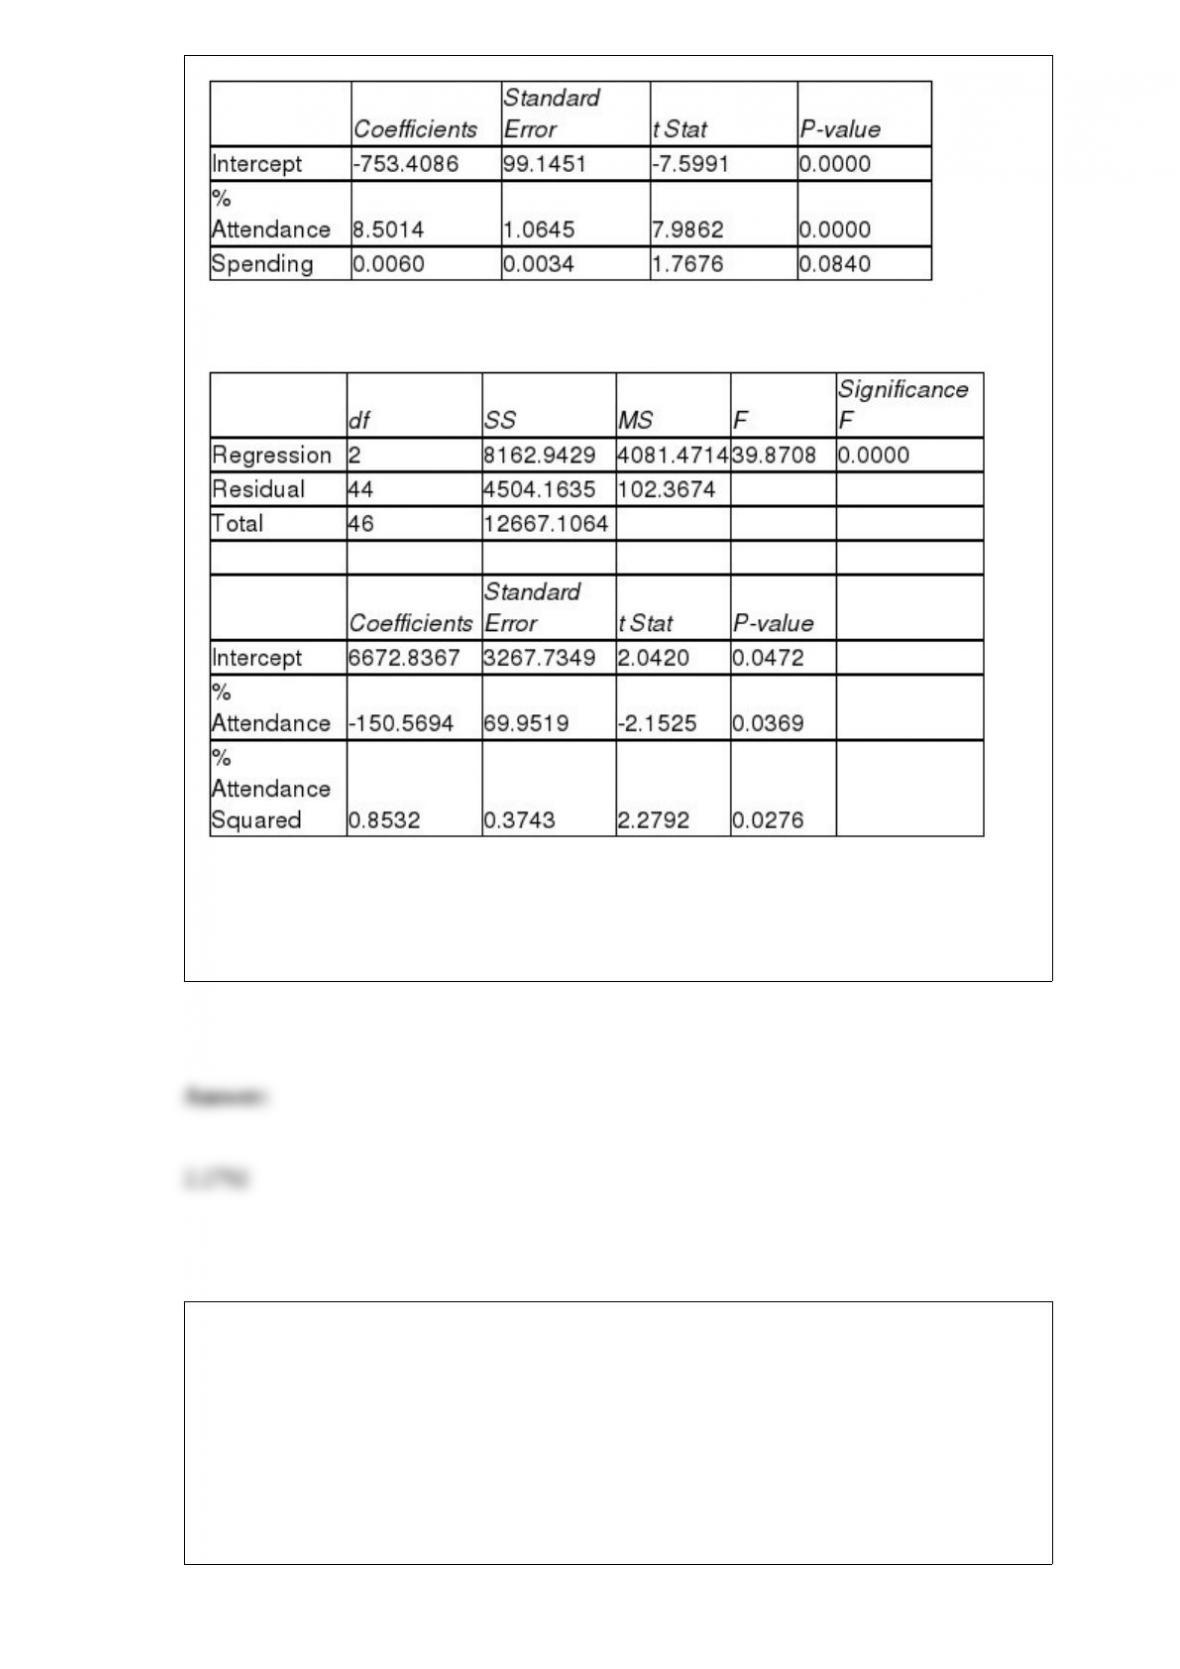
Model (III):
Referring to Table 15-4, what is the value of the test statistic to determine whether the
quadratic effect of daily average of the percentage of students attending class on
percentage of students passing the proficiency test is significant at a 5% level of
significance?
TABLE 5-6
The quality control manager of Green Bulbs Inc. is inspecting a batch of energy saving
compact fluorescent light bulbs. When the production process is in control, the average
number of bad bulbs per shift is 6.0.
Referring to Table 5-6, what is the probability that any particular shift being inspected
has produced between 5.0 and 8.0 inclusive bad bulbs?
If the arithmetic mean of a numerical data set is greater than the median, the data are
considered to be ________ skewed.
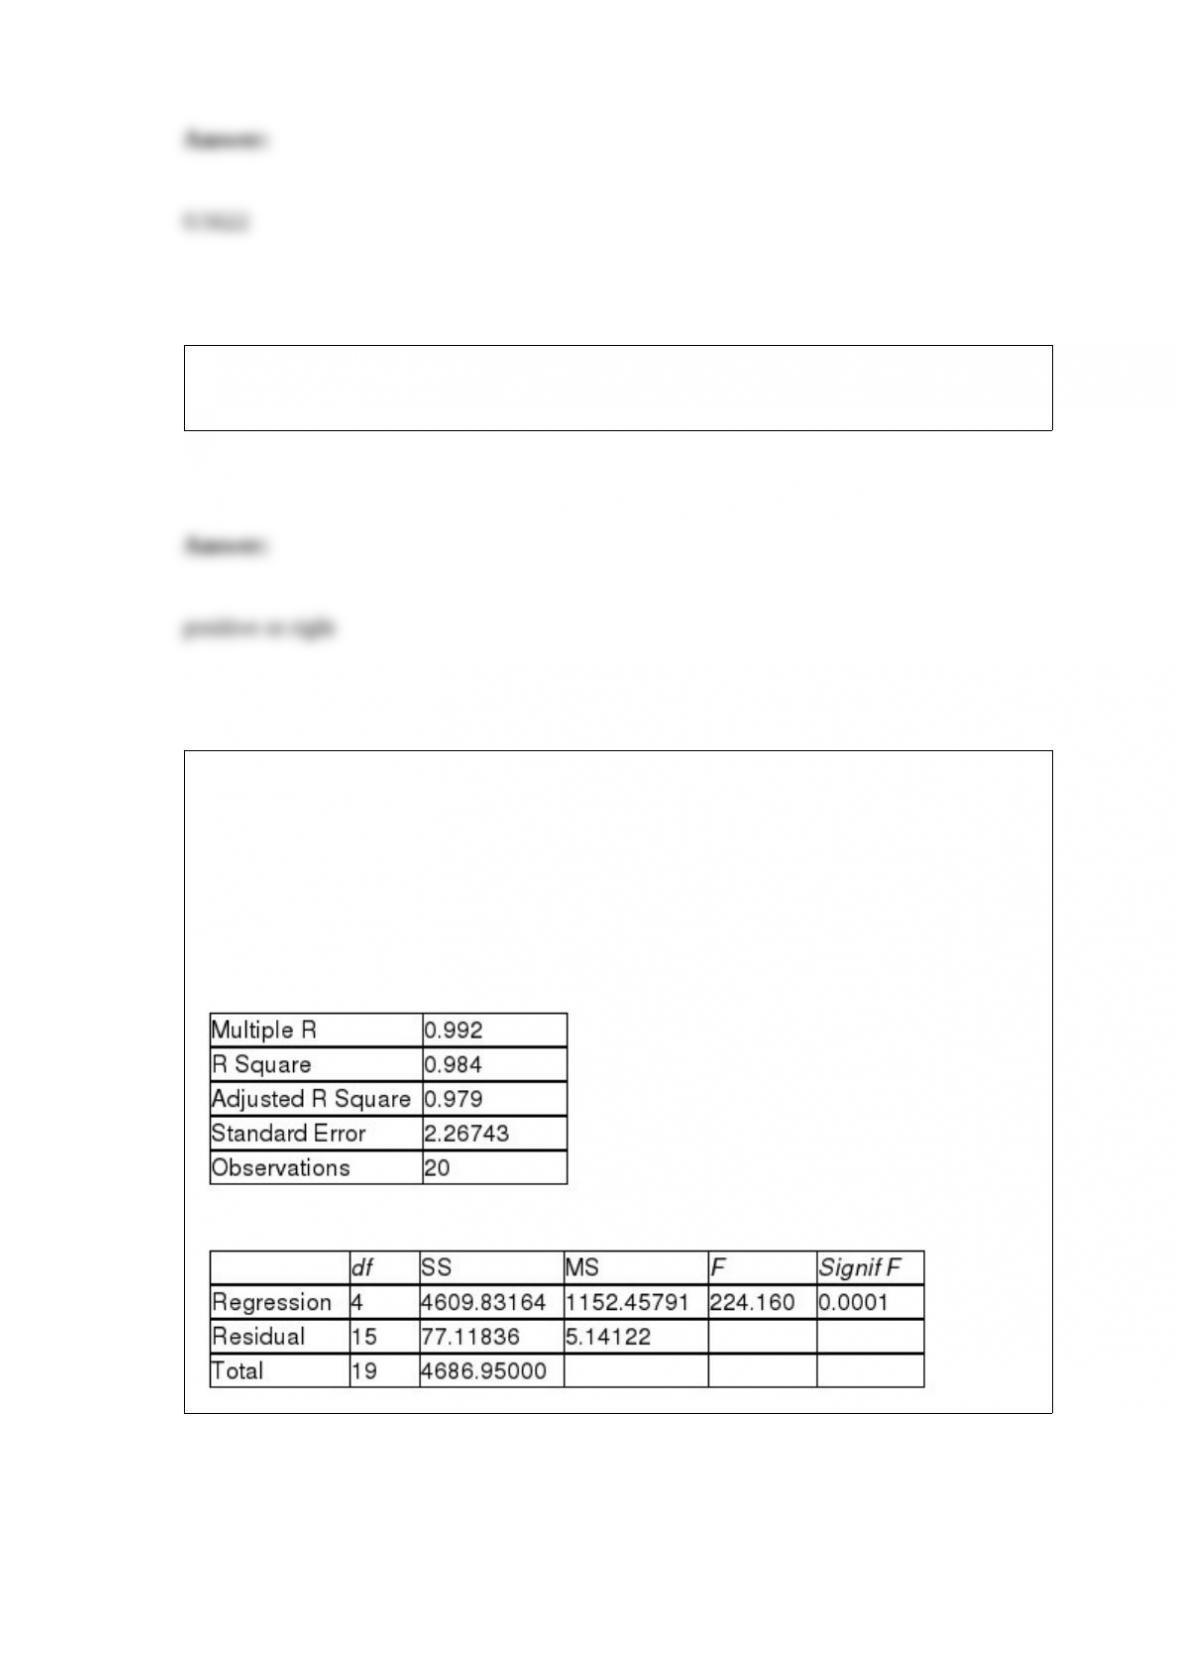
TABLE 17-3
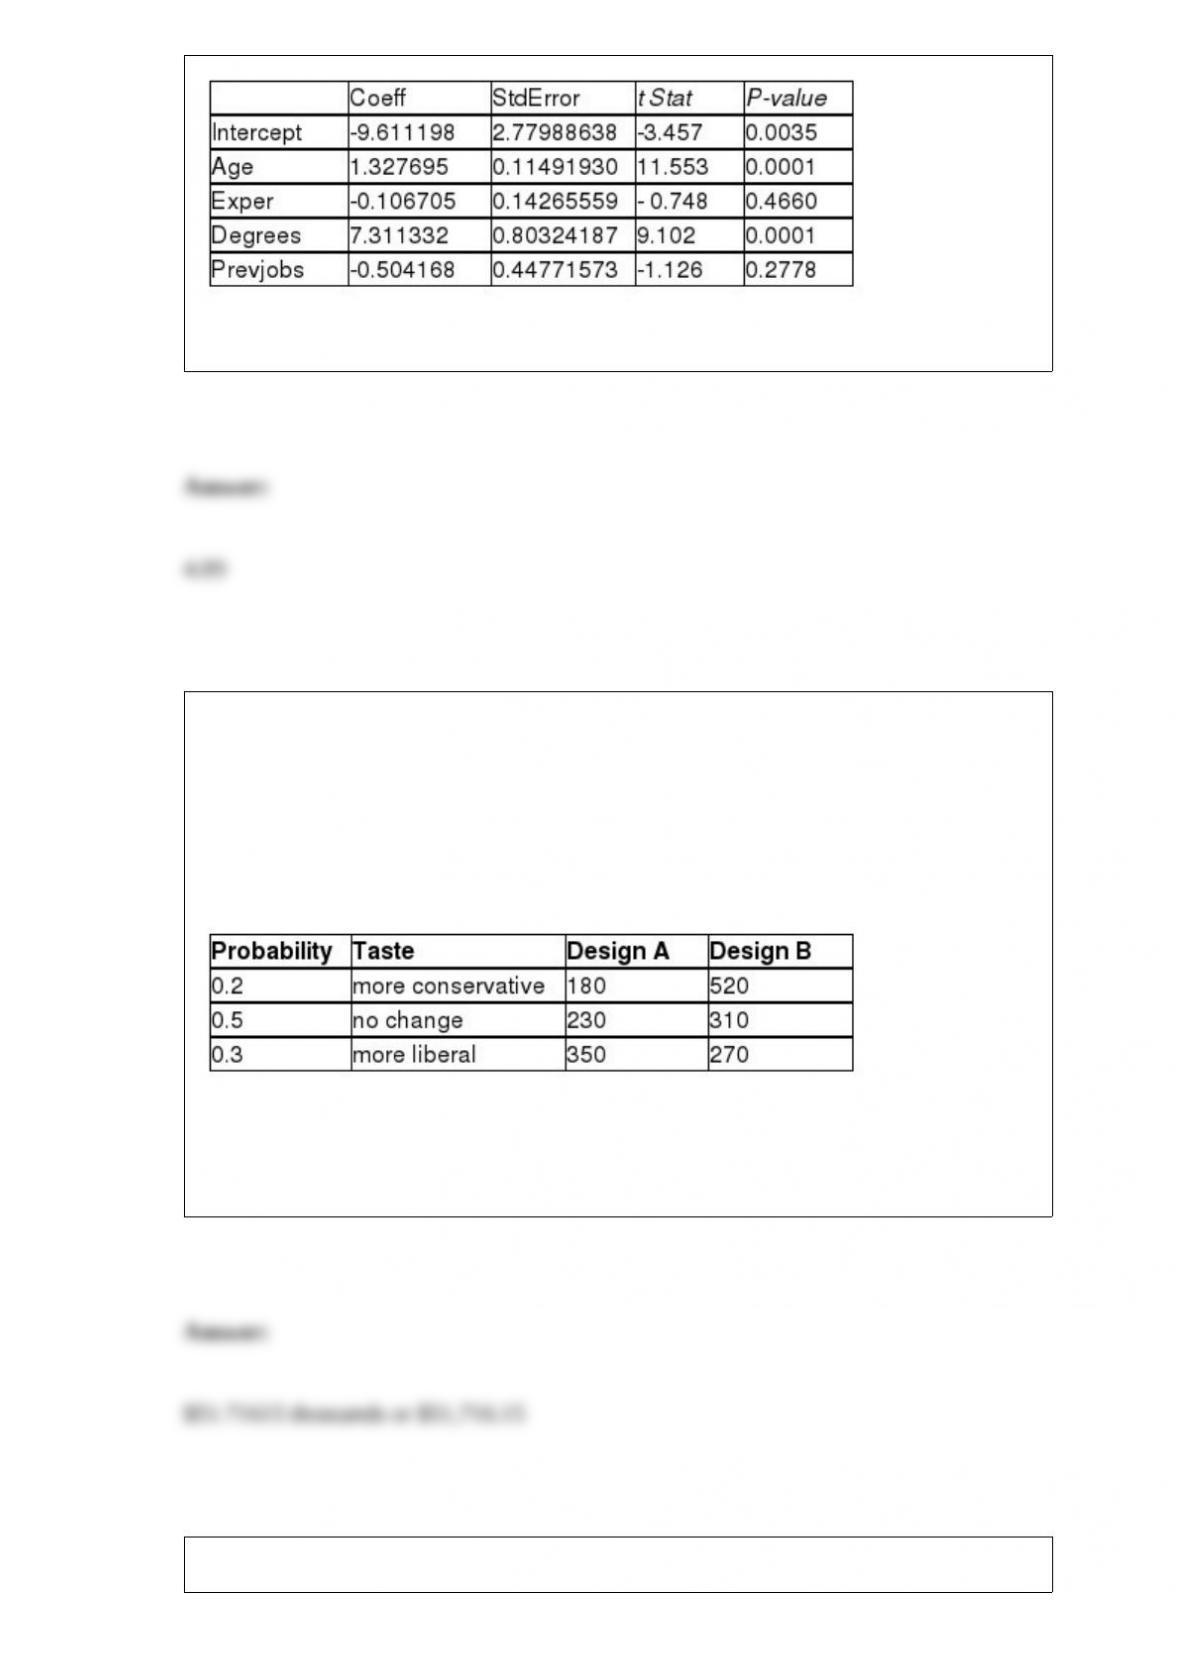
A financial analyst wanted to examine the relationship between salary (in $1,000) and 4
variables: age (X1 = Age), experience in the field (X2 = Exper), number of degrees (X3 =
Degrees), and number of previous jobs in the field (X4 = Prevjobs). He took a sample of
20 employees and obtained the following Microsoft Excel output:
SUMMARY OUTPUT
Regression Statistics
ANOVA
Referring to Table 17-3, the critical value of an F test on the entire regression for a level
of significance of 0.01 is ________.
TABLE 5-8
Two different designs on a new line of winter jackets for the coming winter are
available for your manufacturing plants. Your profit (in thousands of dollars) will
depend on the taste of the consumers when winter arrives. The probability of the three
possible different tastes of the consumers and the corresponding profits are presented in
the following table.
Referring to Table 5-8, if you decide to choose Design A for 30% of the production
lines and Design B for the remaining production lines, what is the risk of your
investment?
Referring to Table 14-15, what is the standard error of estimate?

TABLE 14-15
The superintendent of a school district wanted to predict the
percentage of students passing a sixth-grade proficiency test. She
obtained the data on percentage of students passing the proficiency
test (% Passing), mean teacher salary in thousands of dollars
(Salaries), and instructional spending per pupil in thousands of dollars
(Spending) of 47 schools in the state.
Following is the multiple regression output with Y = % Passing as the
dependent variable, X1 = Salaries and X2 = Spending: