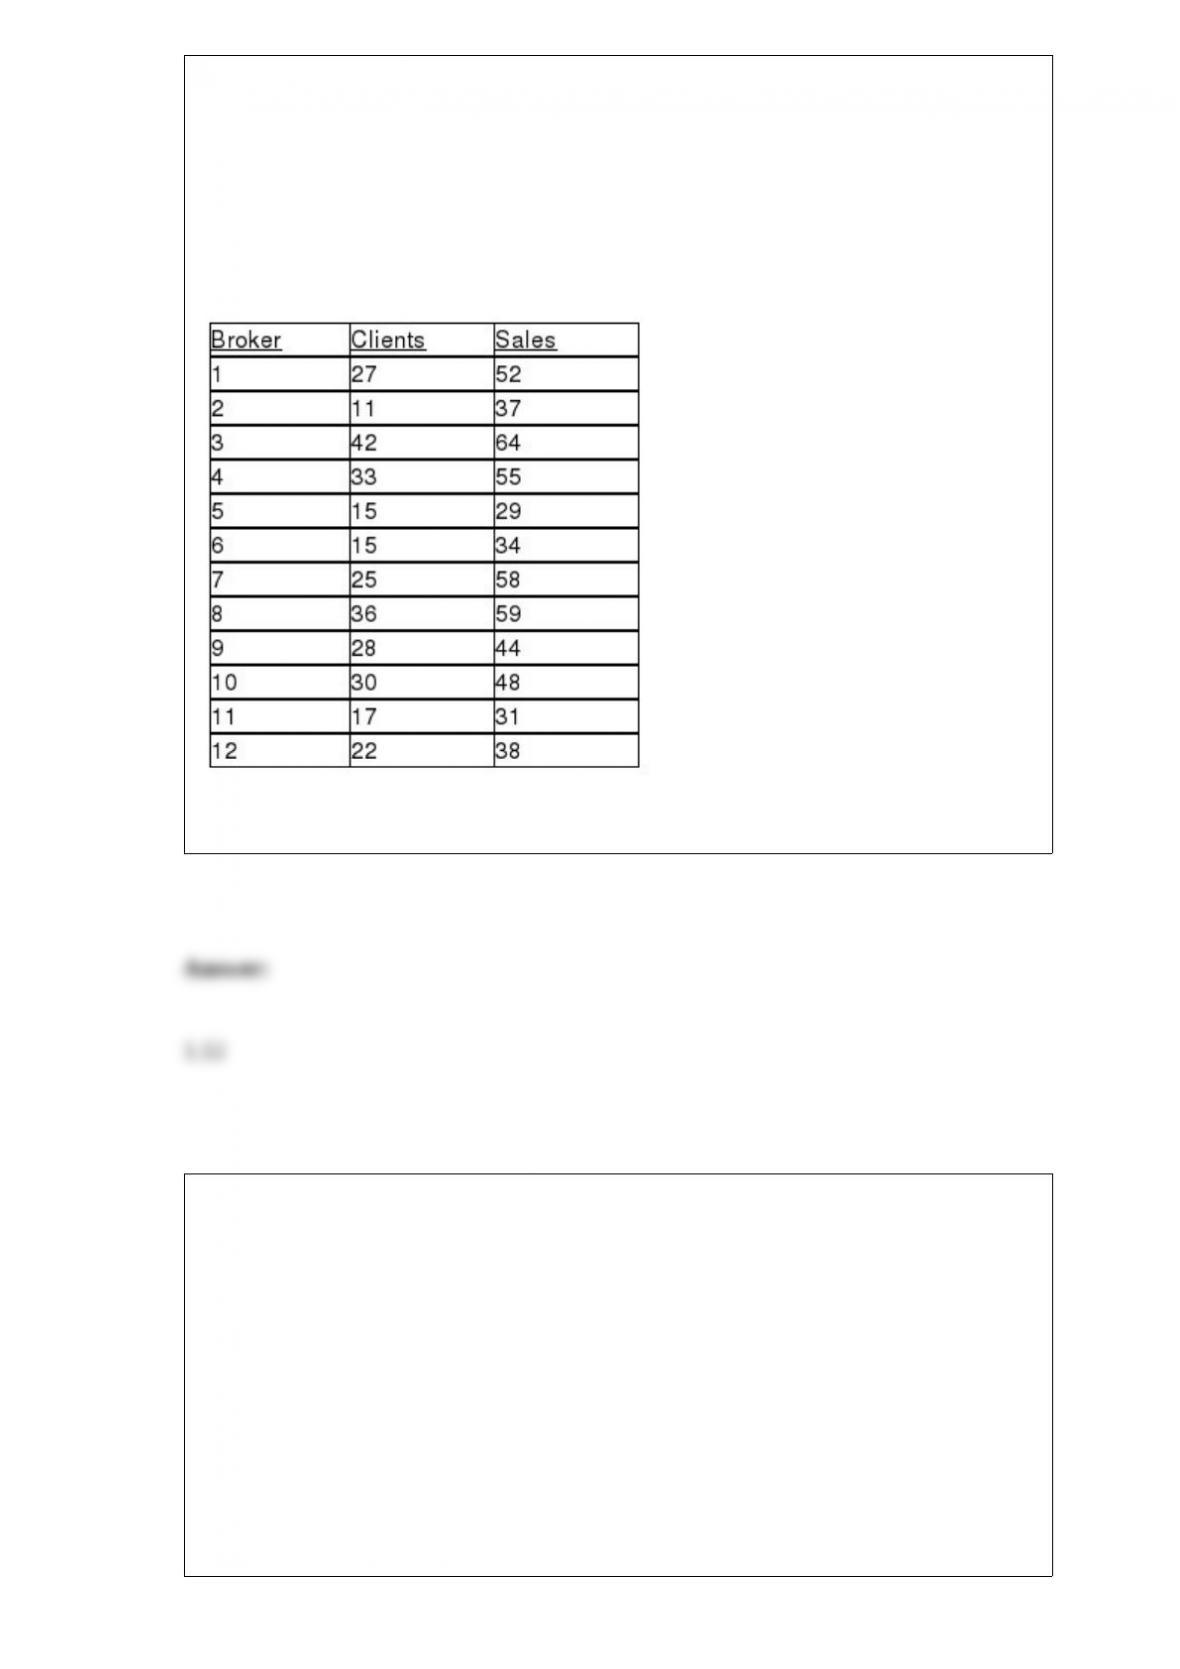
TABLE 13-4
The managers of a brokerage firm are interested in finding out if the number of new
clients a broker brings into the firm affects the sales generated by the broker. They
sample 12 brokers and determine the number of new clients they have enrolled in the
last year and their sales amounts in thousands of dollars. These data are presented in the
table that follows.
Referring to Table 13-4, the least squares estimate of the slope is ________.
Referring to Table 14-13, the effect of living in San Francisco rather
than Los Angeles is to increase the mean demand by an estimated
________.
TABLE 14-13
An econometrician is interested in evaluating the relationship of
demand for building materials to mortgage rates in Los Angeles and
San Francisco. He believes that the appropriate model is
Y = 10 + 5X1 + 8X2
where X1 = mortgage rate in %
X2 = 1 if SF, 0 if LA
Y = demand in $100 per capita
TABLE 6-6
According to Investment Digest, the arithmetic mean of the annual return for common
stocks over an 85-year period was 9.5%, but the value of the variance was not
mentioned. Also 25% of the annual returns were below 8%, while 65% of the annual
returns were between 8% and 11.5%. The article claimed that the distribution of annual
return for common stocks was bell-shaped and approximately symmetric. Assume that
this distribution is normal with the mean given above. Answer the following questions
without the help of a calculator, statistical software or statistical table.
Referring to Table 6-6, 10% of the annual returns will be at least what amount?
TABLE 11-3
As part of an evaluation program, a sporting goods retailer wanted to compare the
downhill coasting speeds of 4 brands of bicycles. She took 3 of each brand and
determined their maximum downhill speeds. The results are presented in miles per hour
in the table below.
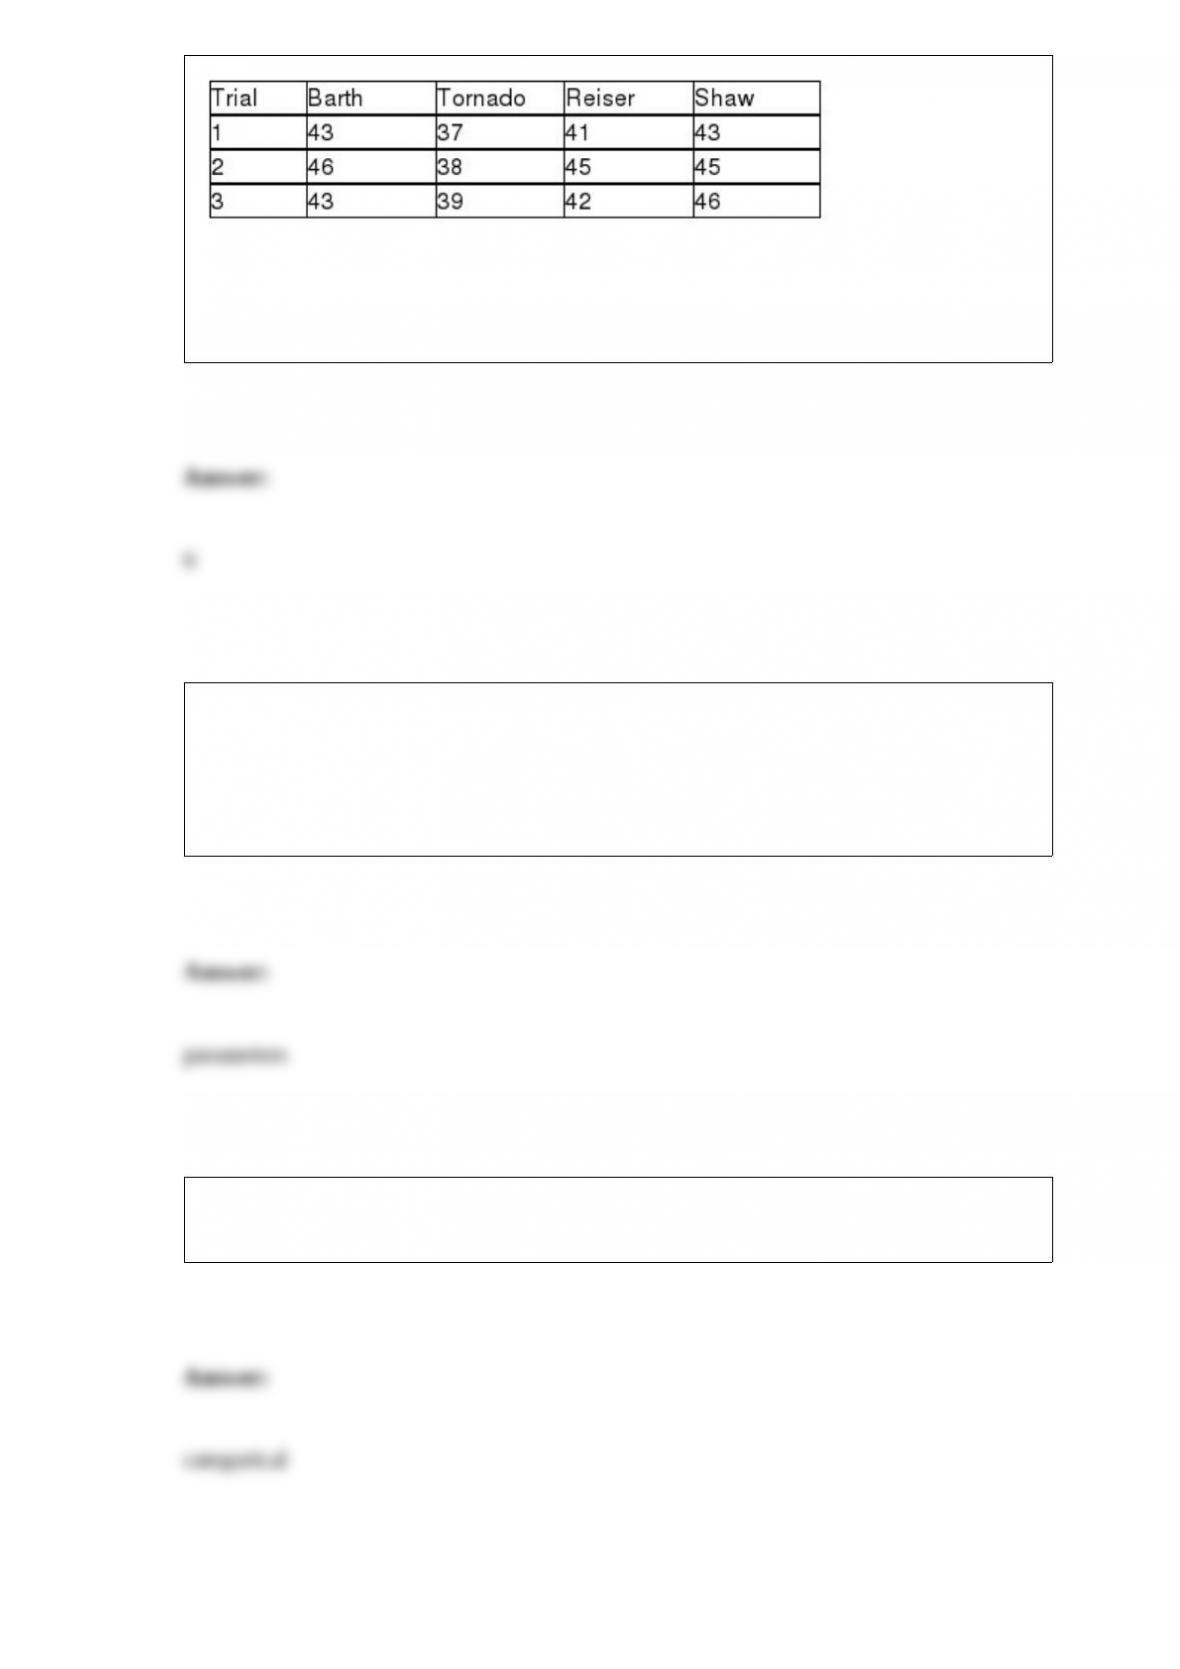
Referring to Table 11-3, the sporting goods retailer decided to compare the 4 treatment
means by using the Tukey-Kramer procedure with an overall level of significance of
0.05. There are ________ pairwise comparisons that can be made.
The Human Resources Director of a large corporation wishes to develop an employee
benefits package and decides to select 500 employees from a list of all (N = 40,000)
workers in order to study their preferences for the various components of a potential
package. Information obtained from the sample will be used to draw conclusions about
the true population ________.
A personal computer user survey was conducted. Computer brand primarily used is an
example of a ________ variable.
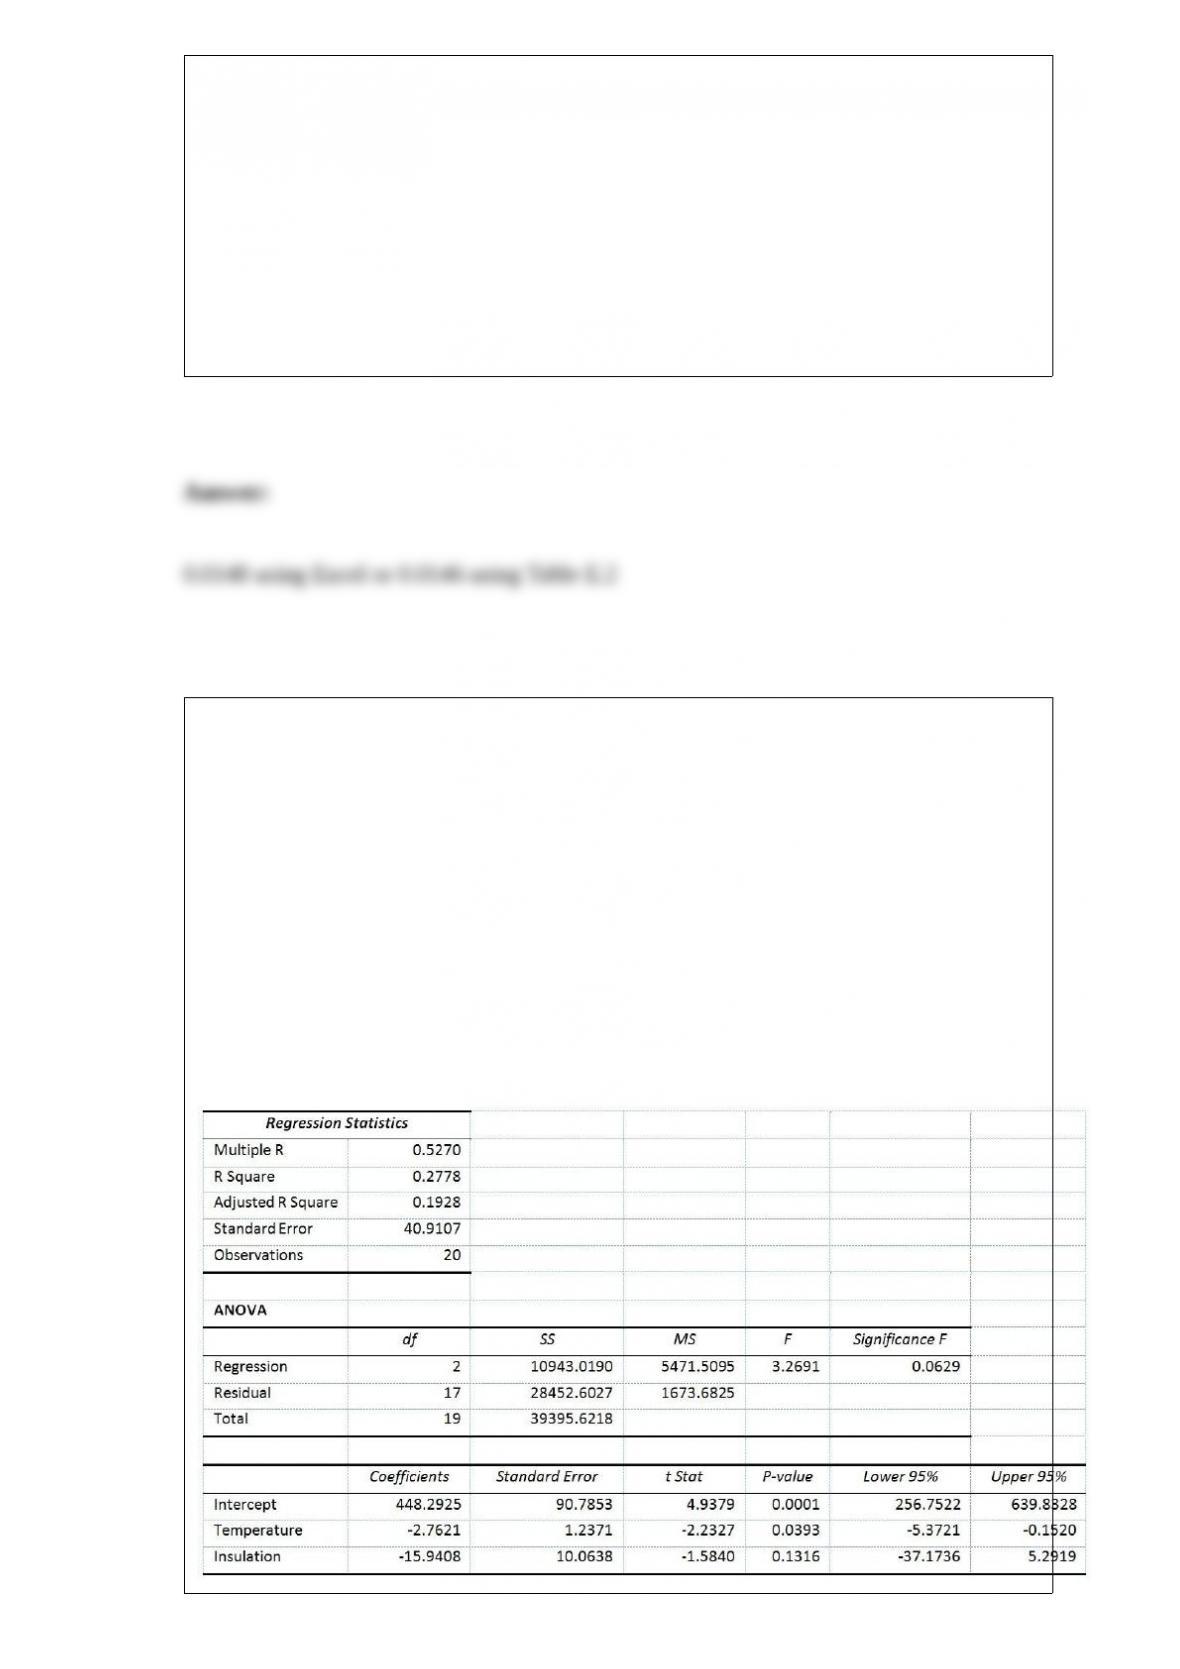
TABLE 9-3
An appliance manufacturer claims to have developed a compact microwave oven that
consumes a mean of no more than 250 W. From previous studies, it is believed that
power consumption for microwave ovens is normally distributed with a population
standard deviation of 15 W. A consumer group has decided to try to discover if the
claim appears true. They take a sample of 20 microwave ovens and find that they
consume a mean of 257.3 W.
Referring to Table 9-3, the p-value of the test is ________.
Referring to Table 14-6, the partial F test for
H0 : Variable X2 does not significantly improve the model after variable X1 has been
included
H1 : Variable X2 significantly improves the model after variable X1 has been included
has ________ and ________ degrees of freedom.
TABLE 14-6
One of the most common questions of prospective house buyers pertains to the cost of
heating in dollars (Y). To provide its customers with information on that matter, a large
real estate firm used the following 2 variables to predict heating costs: the daily
minimum outside temperature in degrees of Fahrenheit (X1) and the amount of
insulation in inches (X2). Given below is EXCEL output of the regression model.

Also SSR (X1∣ X2) = 8343.3572 and SSR (X2∣ X1) = 4199.2672
The amount of bleach a machine pours into bottles has a mean of 36 oz. with a standard
deviation of 0.15 oz. Suppose we take a random sample of 36 bottles filled by this
machine. The probability that the mean of the sample exceeds 36.01 oz. is ________.