The Human Resources Director of a large corporation wishes to develop an employee
benefits package and decides to select 500 employees from a list of all (N = 40,000)
workers in order to study their preferences for the various components of a potential
package. The Director will use the data from the sample to compute ________.
TABLE 17-9
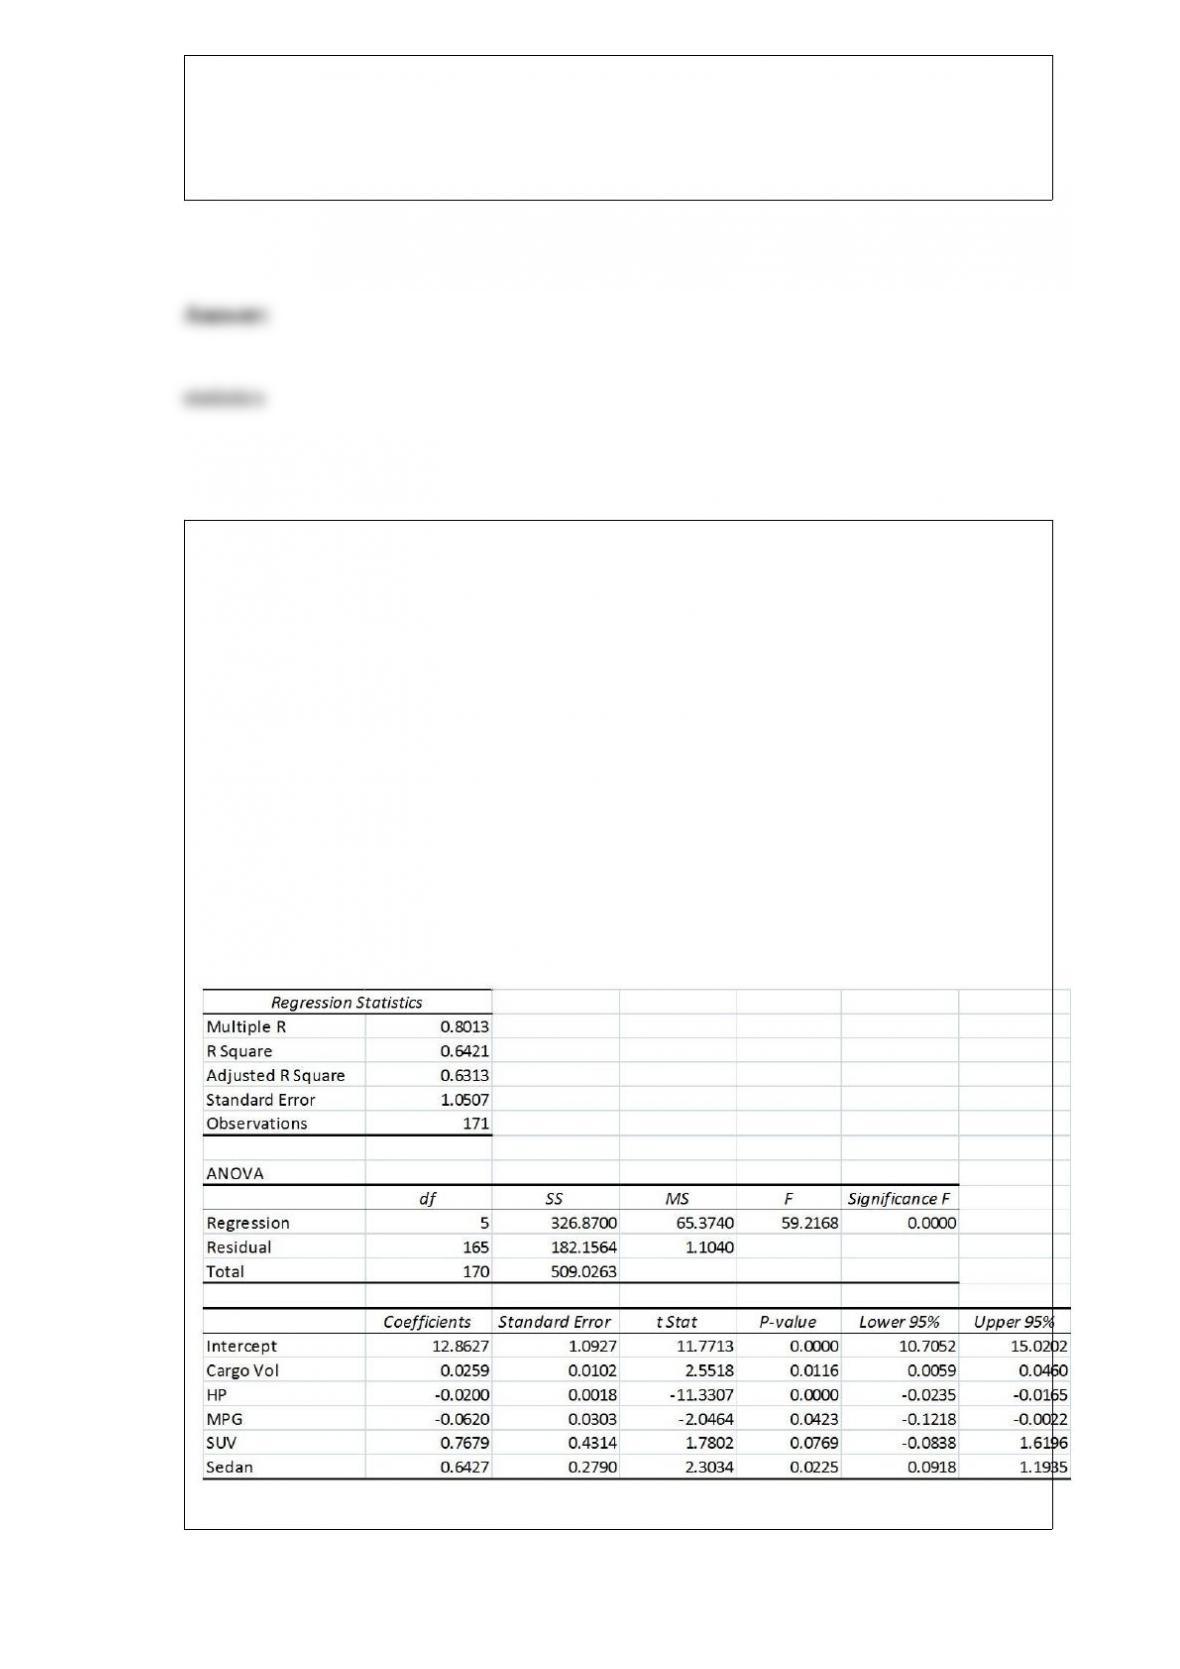
What are the factors that determine the acceleration time (in sec.) from 0 to 60 miles per
hour of a car? Data on the following variables for 171 different vehicle models were
collected:
Accel Time: Acceleration time in sec.
Cargo Vol: Cargo volume in cu. ft.
HP: Horsepower
MPG: Miles per gallon
SUV: 1 if the vehicle model is an SUV with Coupe as the base when SUV and Sedan
are both 0
Sedan: 1 if the vehicle model is a sedan with Coupe as the base when SUV and Sedan
are both 0
The regression results using acceleration time as the dependent variable and the
remaining variables as the independent variables are presented below.
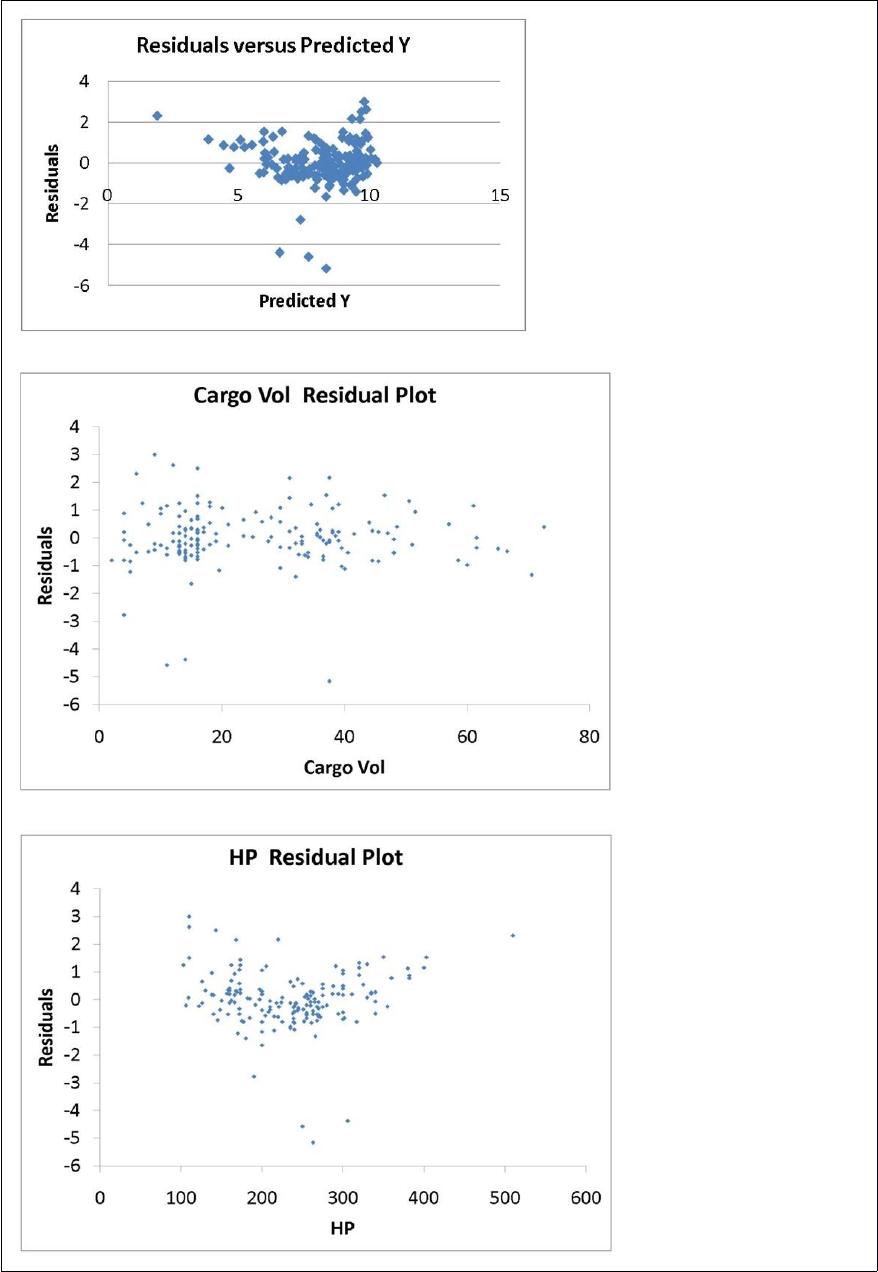
The various residual plots are as shown below.
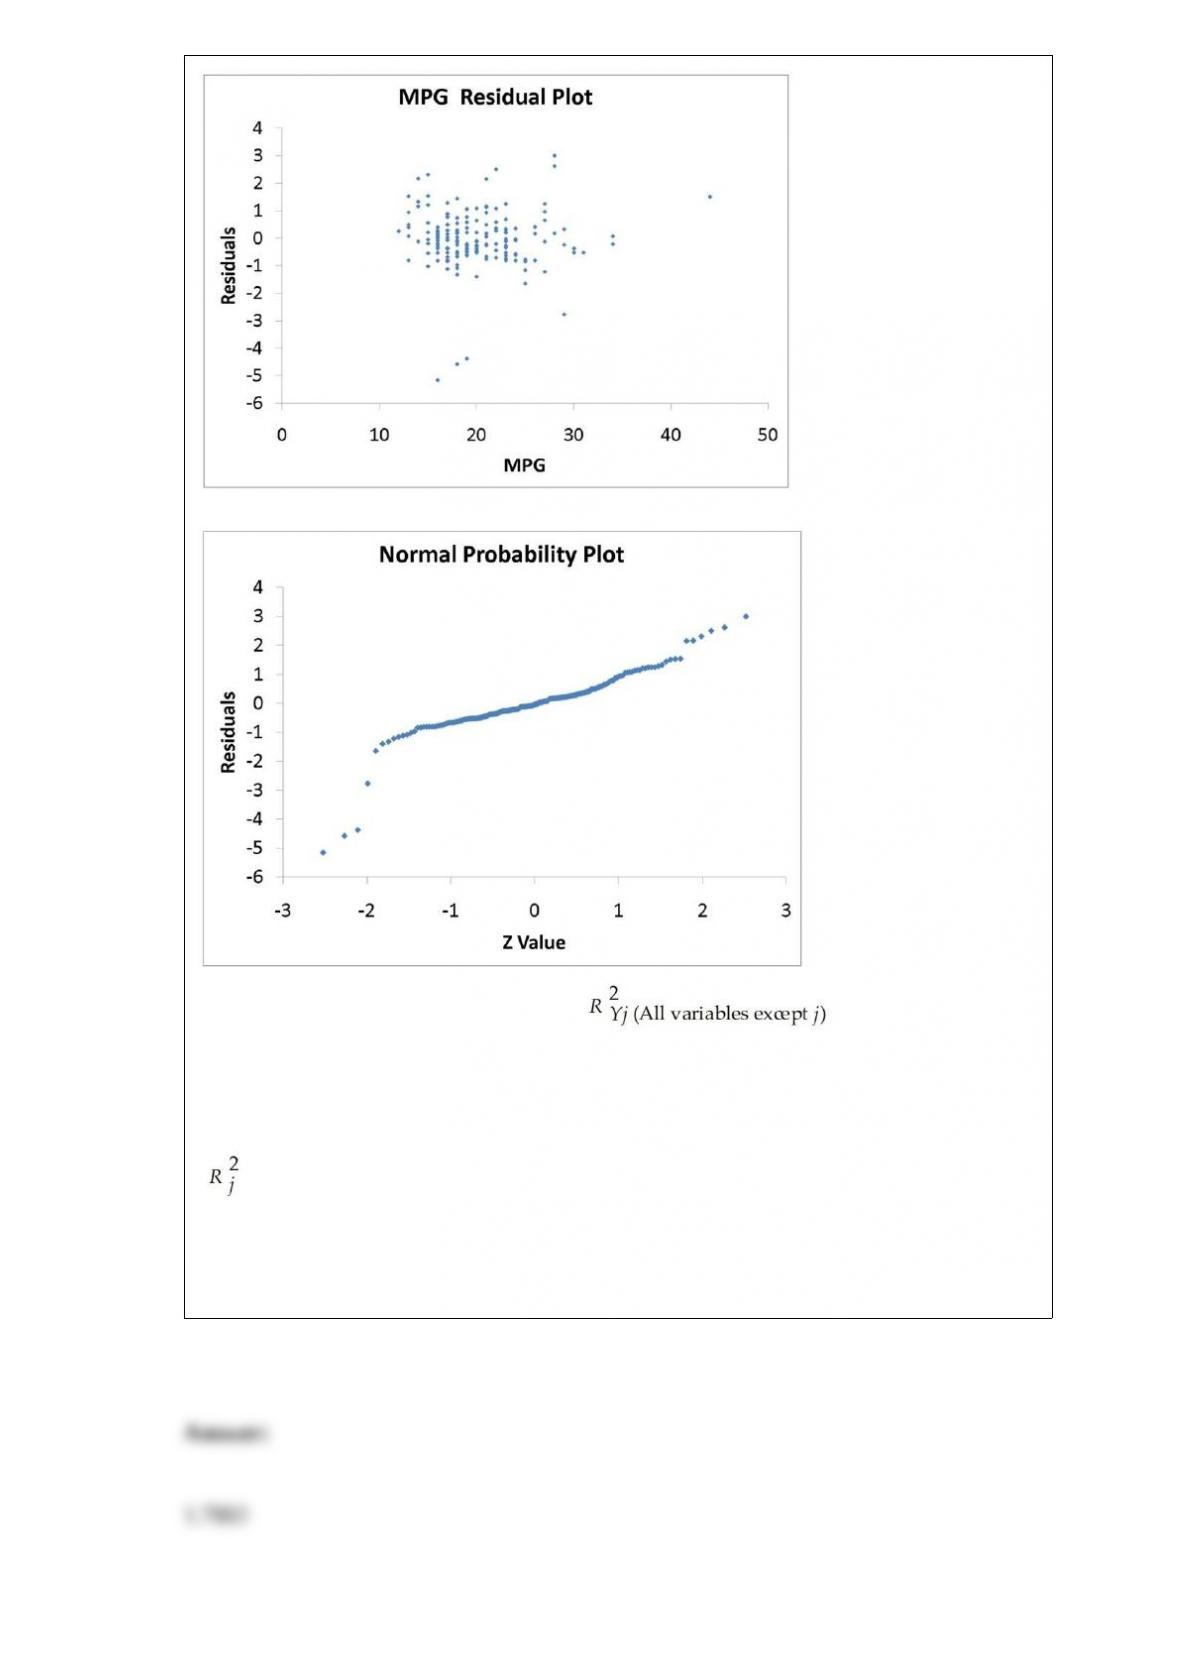
The coefficient of partial determination ( ) of each of the 5
predictors are, respectively, 0.0380, 0.4376, 0.0248, 0.0188, and 0.0312.
The coefficient of multiple determination for the regression model using each of the 5
variables Xj as the dependent variable and all other X variables as independent variables
( ) are, respectively, 0.7461, 0.5676, 0.6764, 0.8582, 0.6632.
Referring to Table 17-9, what is the value of the test statistic to determine whether SUV
makes a significant contribution to the regression model in the presence of the other
independent variables at a 5% level of significance?
TABLE 7-6
Online customer service is a key element to successful online retailing. According to a
marketing survey, 37.5% of online customers take advantage of the online customer
service. Random samples of 200 customers are selected.
Referring to Table 7-6, 95% of the samples proportions symmetrically around the
population proportion will have between ________% and ________% of the customers
who take advantage of online customer service.
TABLE 4-6
At a Texas college, 60% of the students are from the southern part of the state, 30% are
from the northern part of the state, and the remaining 10% are from out-of-state. All
students must take and pass an Entry
Referring to Table 4-6, the probability that a randomly selected student is someone from
northern Texas who has not passed the ELM is ________.
TABLE 12-11
The director of admissions at a state college is interested in seeing if admissions status
(admitted, waiting list, denied admission) at his college is independent of the type of
community in which an applicant resides. He takes a sample of recent admissions
decisions and forms the following table:
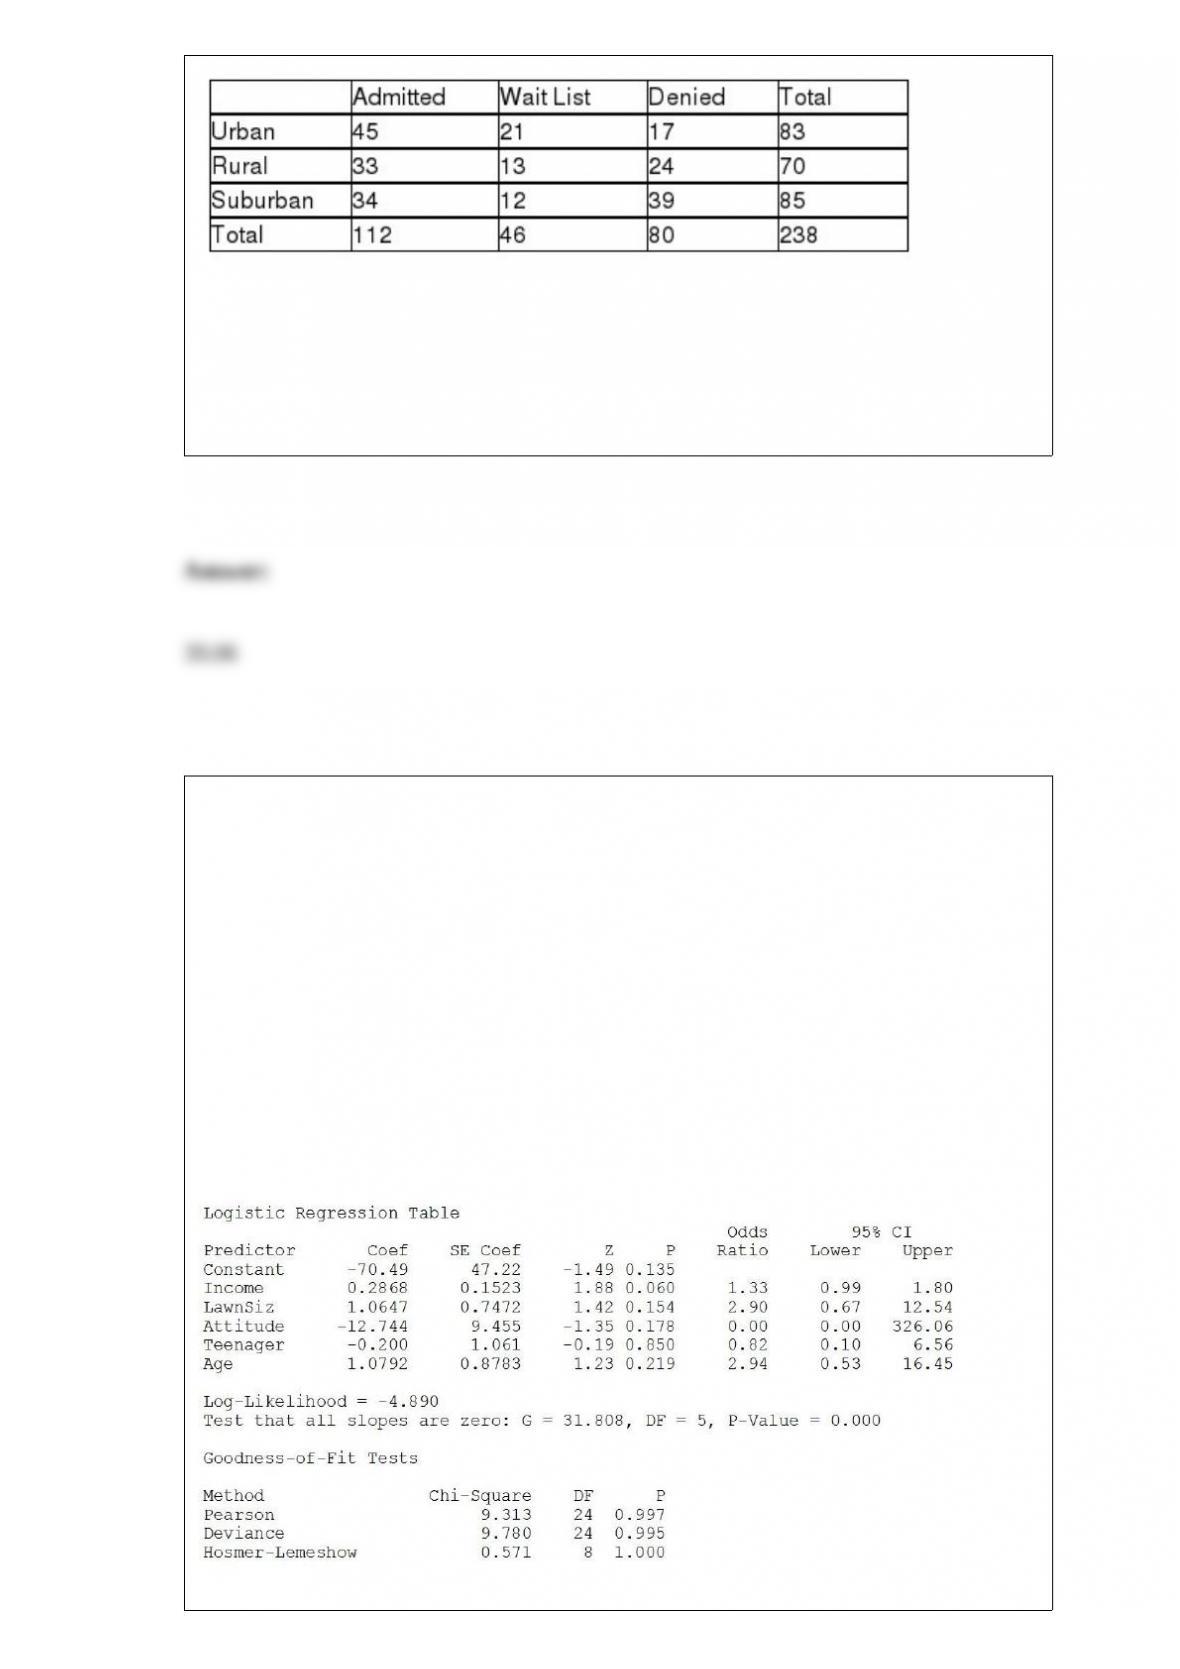
He will use this table to do a chi-square test of independence with a level of
significance of 0.01.
Referring to Table 12-11, the expected cell frequency for the Admitted/Urban cell is
________.
TABLE 17-12
The marketing manager for a nationally franchised lawn service company would like to
study the characteristics that differentiate home owners who do and do not have a lawn
service. A random sample of 30 home owners located in a suburban area near a large
city was selected; 15 did not have a lawn service (code 0) and 15 had a lawn service
(code 1). Additional information available concerning these 30 home owners includes
family income (Income, in thousands of dollars), lawn size (Lawn Size, in thousands of
square feet), attitude toward outdoor recreational activities (Attitude 0 = unfavorable, 1
= favorable), number of teenagers in the household (Teenager), and age of the head of
the household (Age).
The Minitab output is given below:
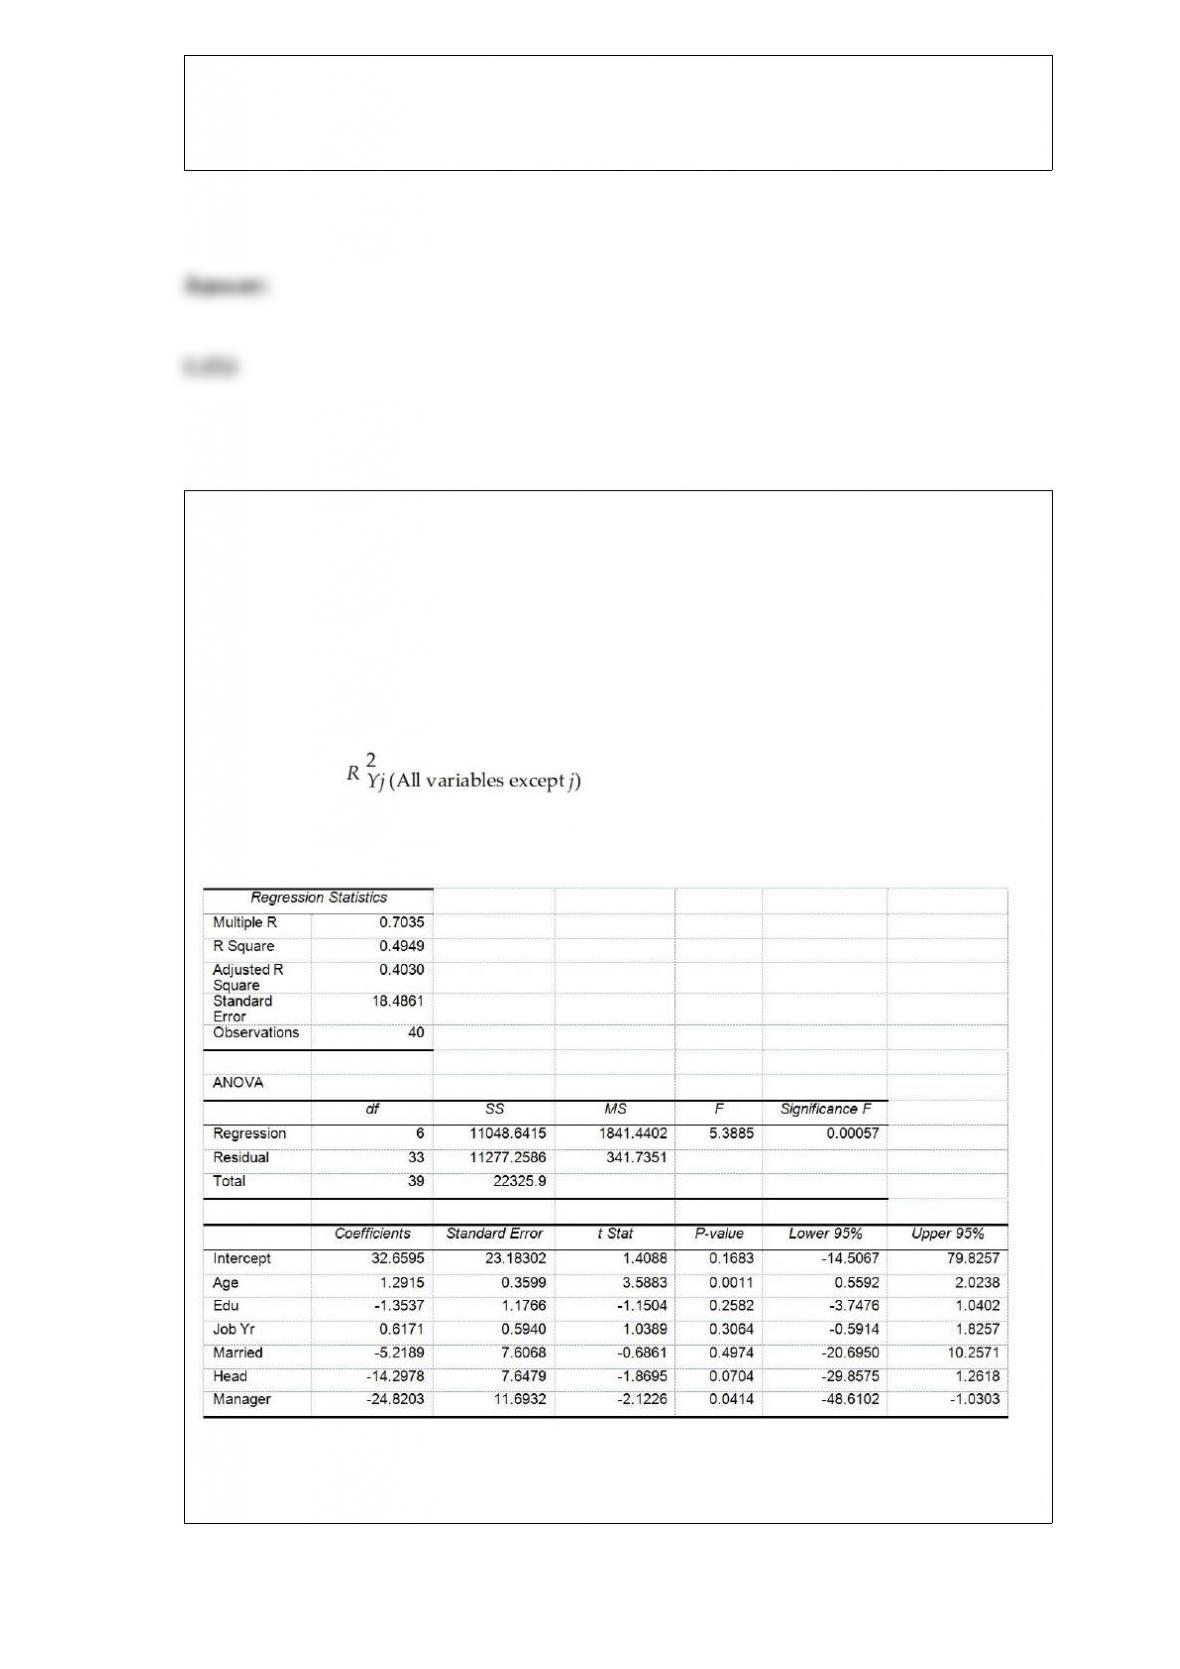
Referring to Table 17-12, what is the p-value of the test statistic when testing whether
Teenager makes a significant contribution to the model in the presence of the other
independent variables?
TABLE 17-10
Given below are results from the regression analysis where the dependent variable is
the number of weeks a worker is unemployed due to a layoff (Unemploy) and the
independent variables are the age of the worker (Age), the number of years of education
received (Edu), the number of years at the previous job (Job Yr), a dummy variable for
marital status (Married: 1 = married, 0 = otherwise), a dummy variable for head of
household (Head: 1 = yes, 0 = no) and a dummy variable for management position
(Manager: 1 = yes, 0 = no). We shall call this Model 1. The coefficient of partial
determination ( ) of each of the 6 predictors are, respectively,
0.2807, 0.0386, 0.0317, 0.0141, 0.0958, and 0.1201.
Model 2 is the regression analysis where the dependent variable is Unemploy and the
independent variables are Age and Manager. The results of the regression analysis are
given below:
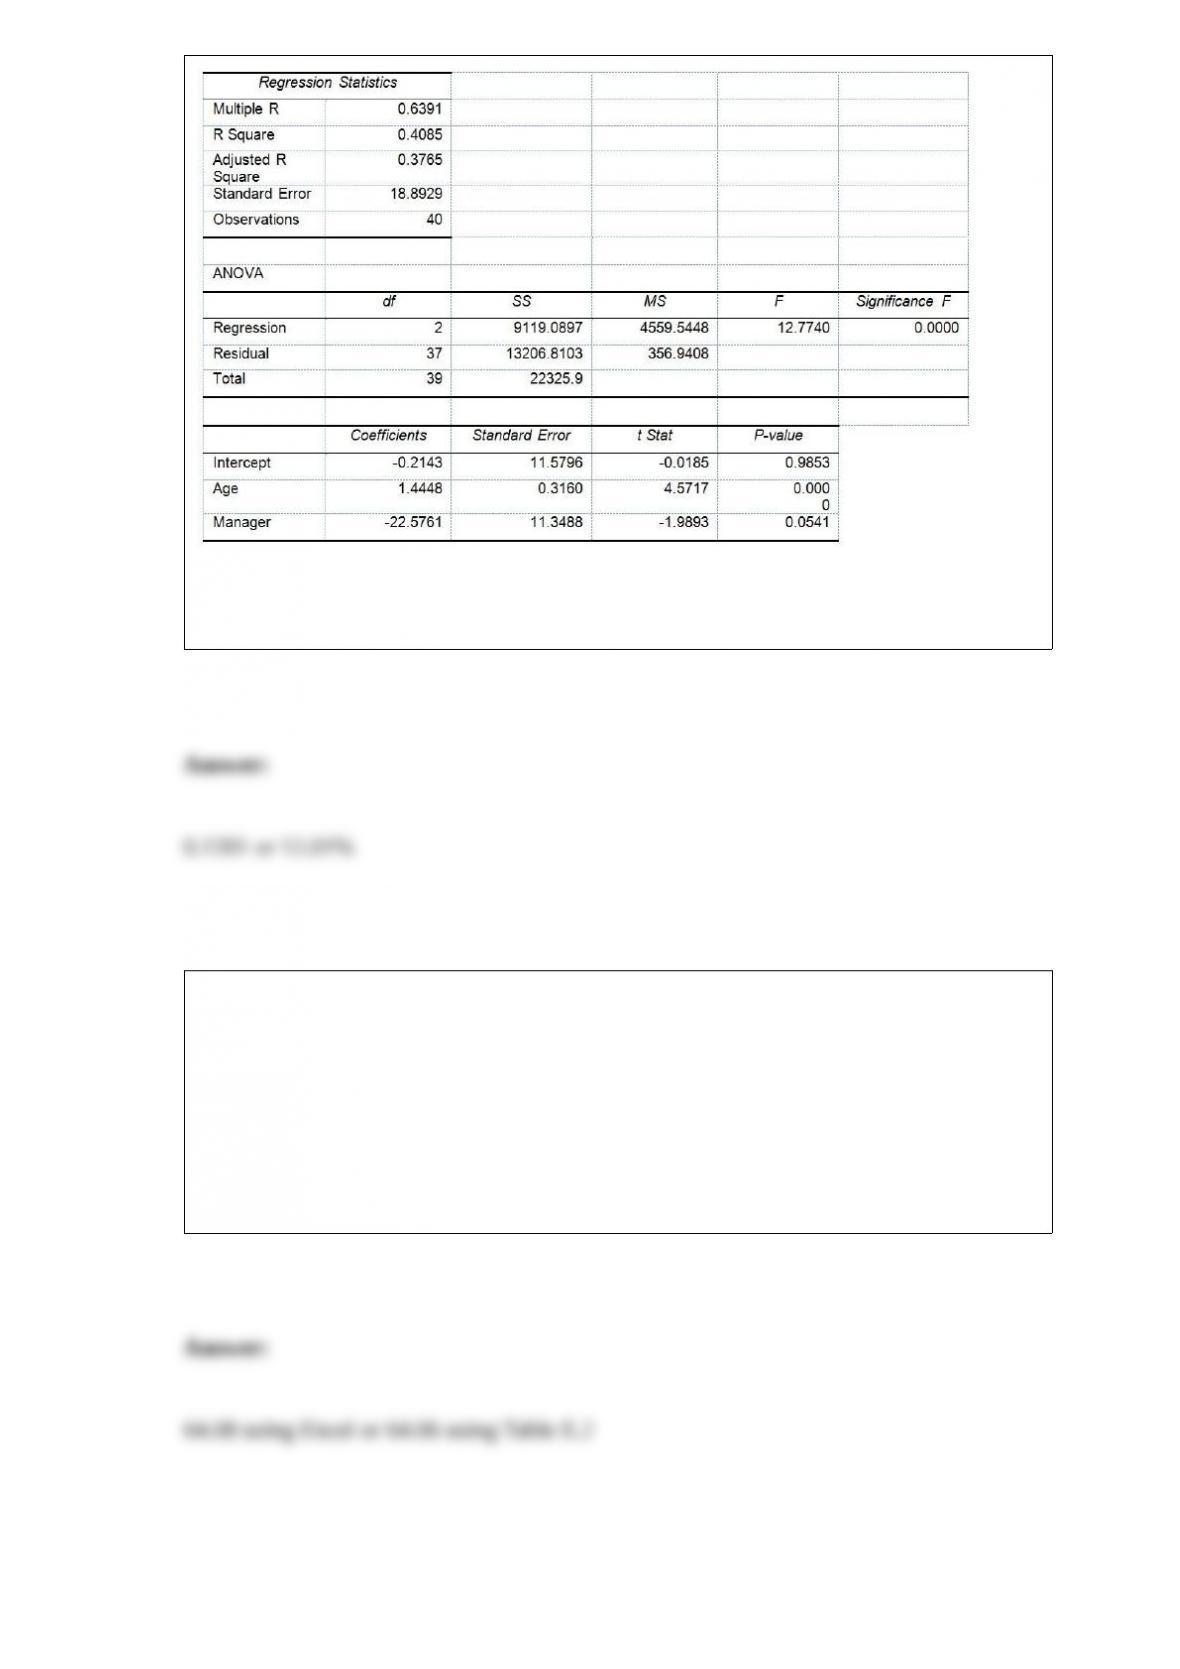
Referring to Table 17-10, Model 1, ________ of the variation in the number of weeks a
worker is unemployed due to a layoff can be explained by whether the worker is in a
management position while controlling for the other independent variables.
TABLE 7-5
According to an article, 19% of the entire population in a developing country has
high-speed access to the Internet. Random sample sizes of 200 are selected from the
country’s population.
Referring to Table 7-5, among all the random sample sizes of 200, ________% will
have less than 20% who have high-speed access to the Internet.