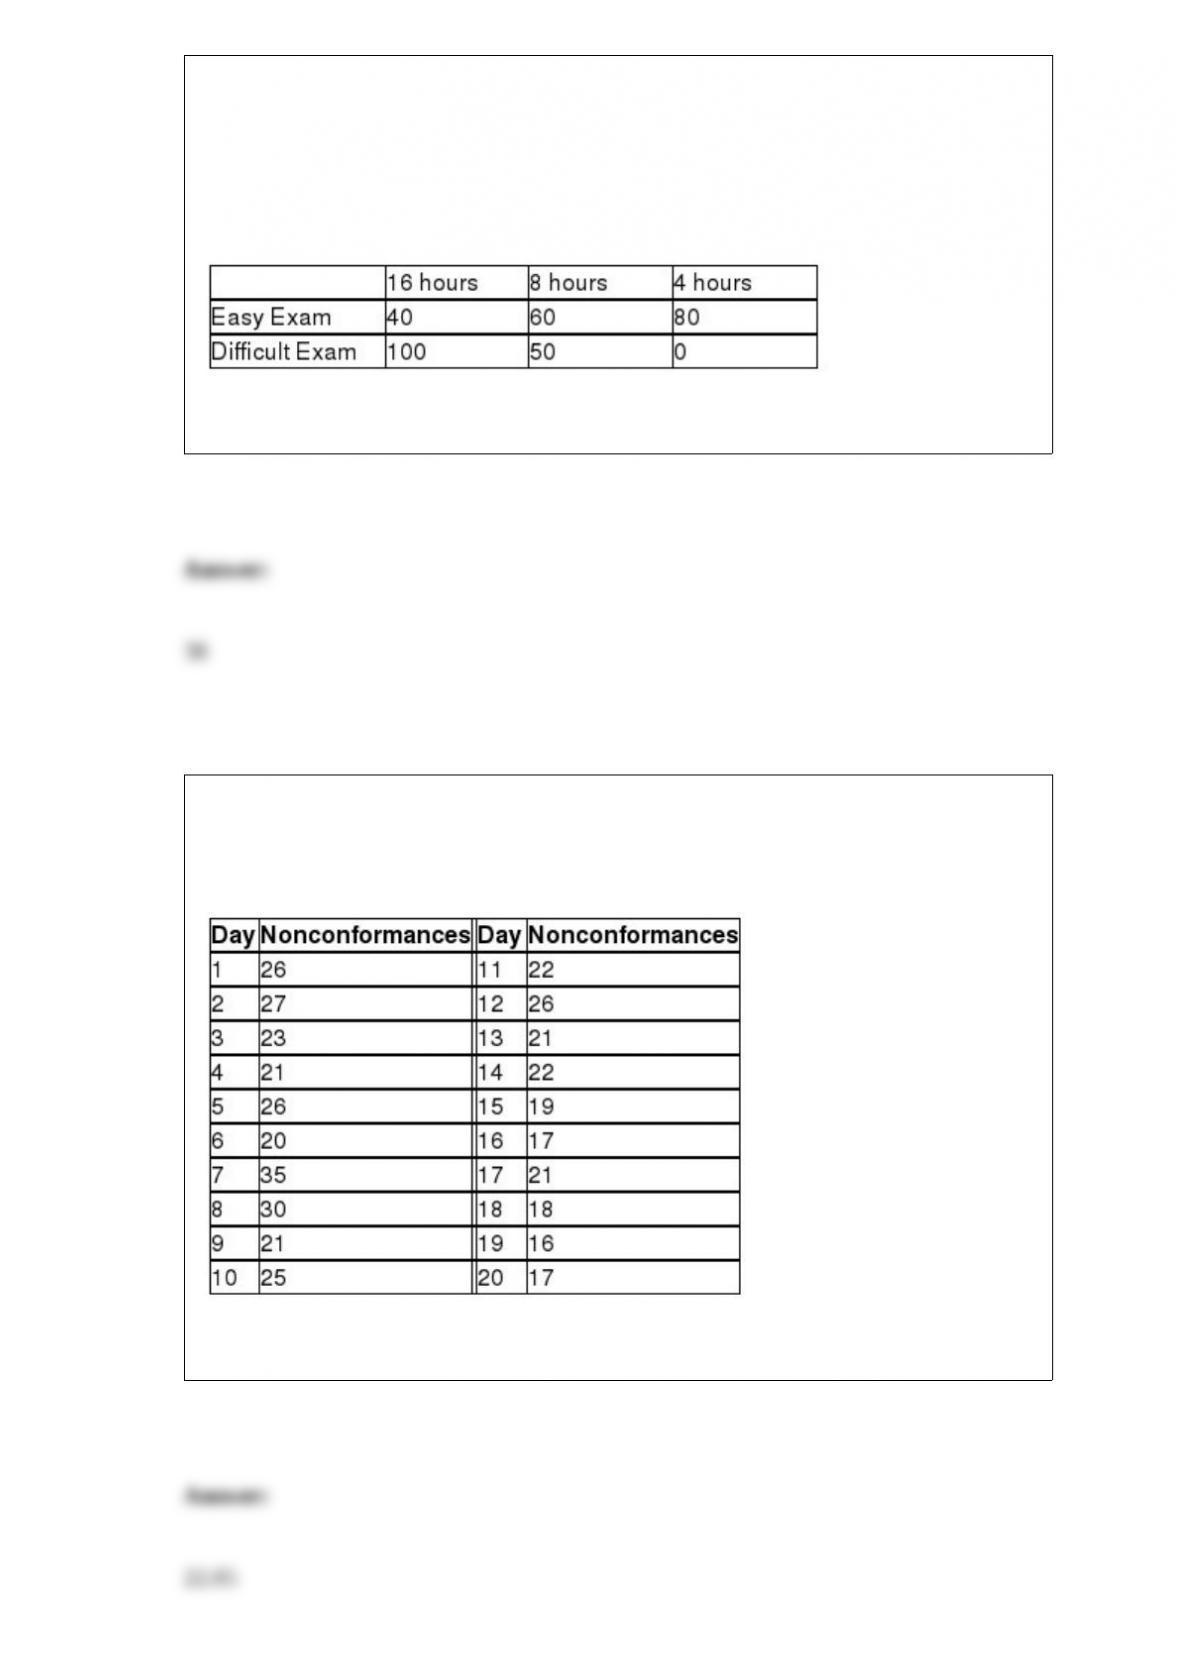
TABLE 19-6
A student wanted to find out the optimal strategy to study for a Business Statistics
exam. He constructed the following payoff table based on the mean amount of time he
needed to study every week for the course and the degree of difficulty of the exam.
From the information that he gathered from students who had taken the course, he
concluded that there was a 40% probability that the exam would be easy.
Referring to Table 19-6, what is the expected opportunity loss of spending 8 hours per
week on average studying for the exam?
TABLE 18-10
Below is the number of defective items from a production line over twenty consecutive
morning shifts.
Referring to Table 18-10, a c chart is to be constructed for the number of defective
items. The center line of this c chart is located at ________.
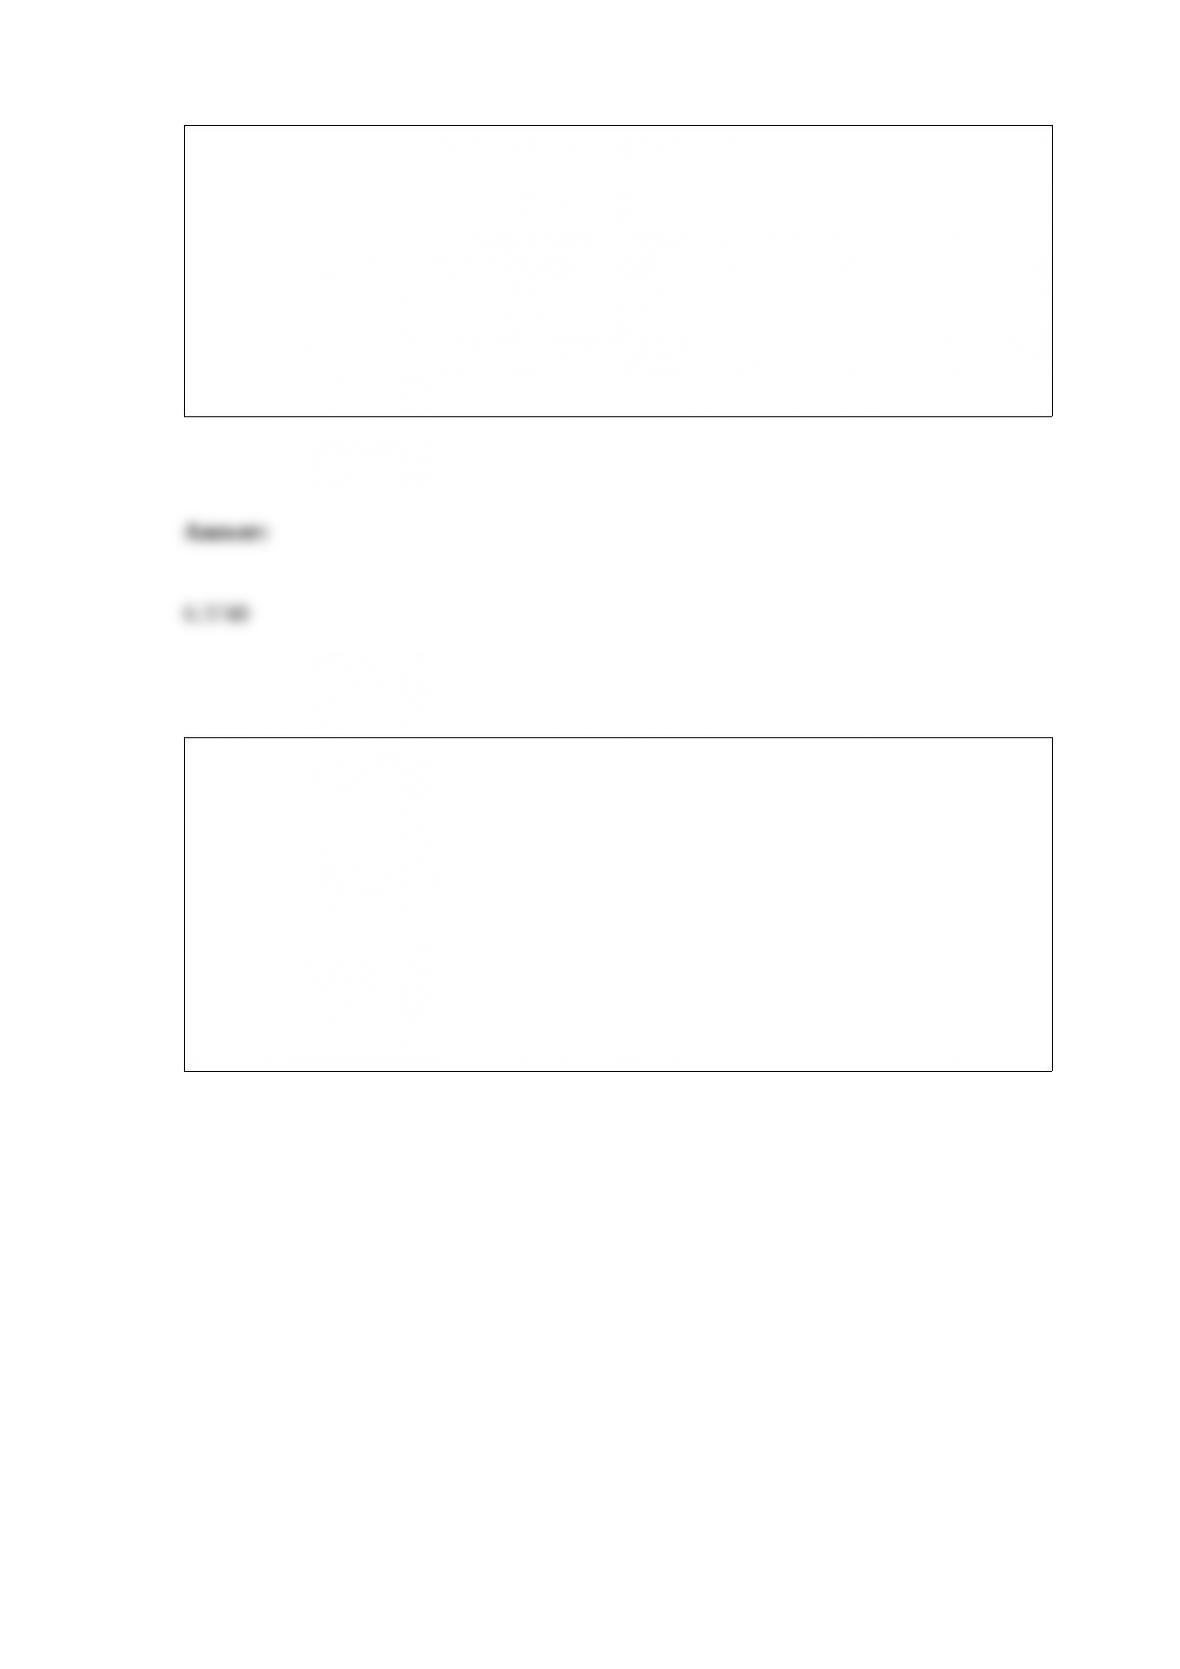
TABLE 7-7
Times spent studying by students in the week before final exams follow a normal
distribution with standard deviation 8 hours. A random sample of 4 students was taken
from a population of 50 in order to estimate the mean study time for the population of
all students. Use the finite population correction.
Referring to Table 7-7, 90% of all the samples of 4 will have a sample mean of no more
than how many hours from the population mean?
Referring to Table 14-7, the department head wants to use a t test to
test for the signiticance of the coefficient of X1. For a level of
signiticance of 0.05, the critical values of the test are ________.
TABLE 14-7
The department head of the accounting department wanted to see if
she could predict the GPA of students using the number of course
units (credits) and total SAT scores of each. She takes a sample of
students and generates the following Microsoft Excel output:
TABLE 11-8
An important factor in selecting database software is the time required for a user to
learn how to use the system. To evaluate three potential brands (A, B and C) of database
software, a company designed a test involving five different employees. To reduce
variability due to differences among employees, each of the five employees is trained
on each of the three different brands. The amount of time (in hours) needed to learn
each of the three different brands is given below:
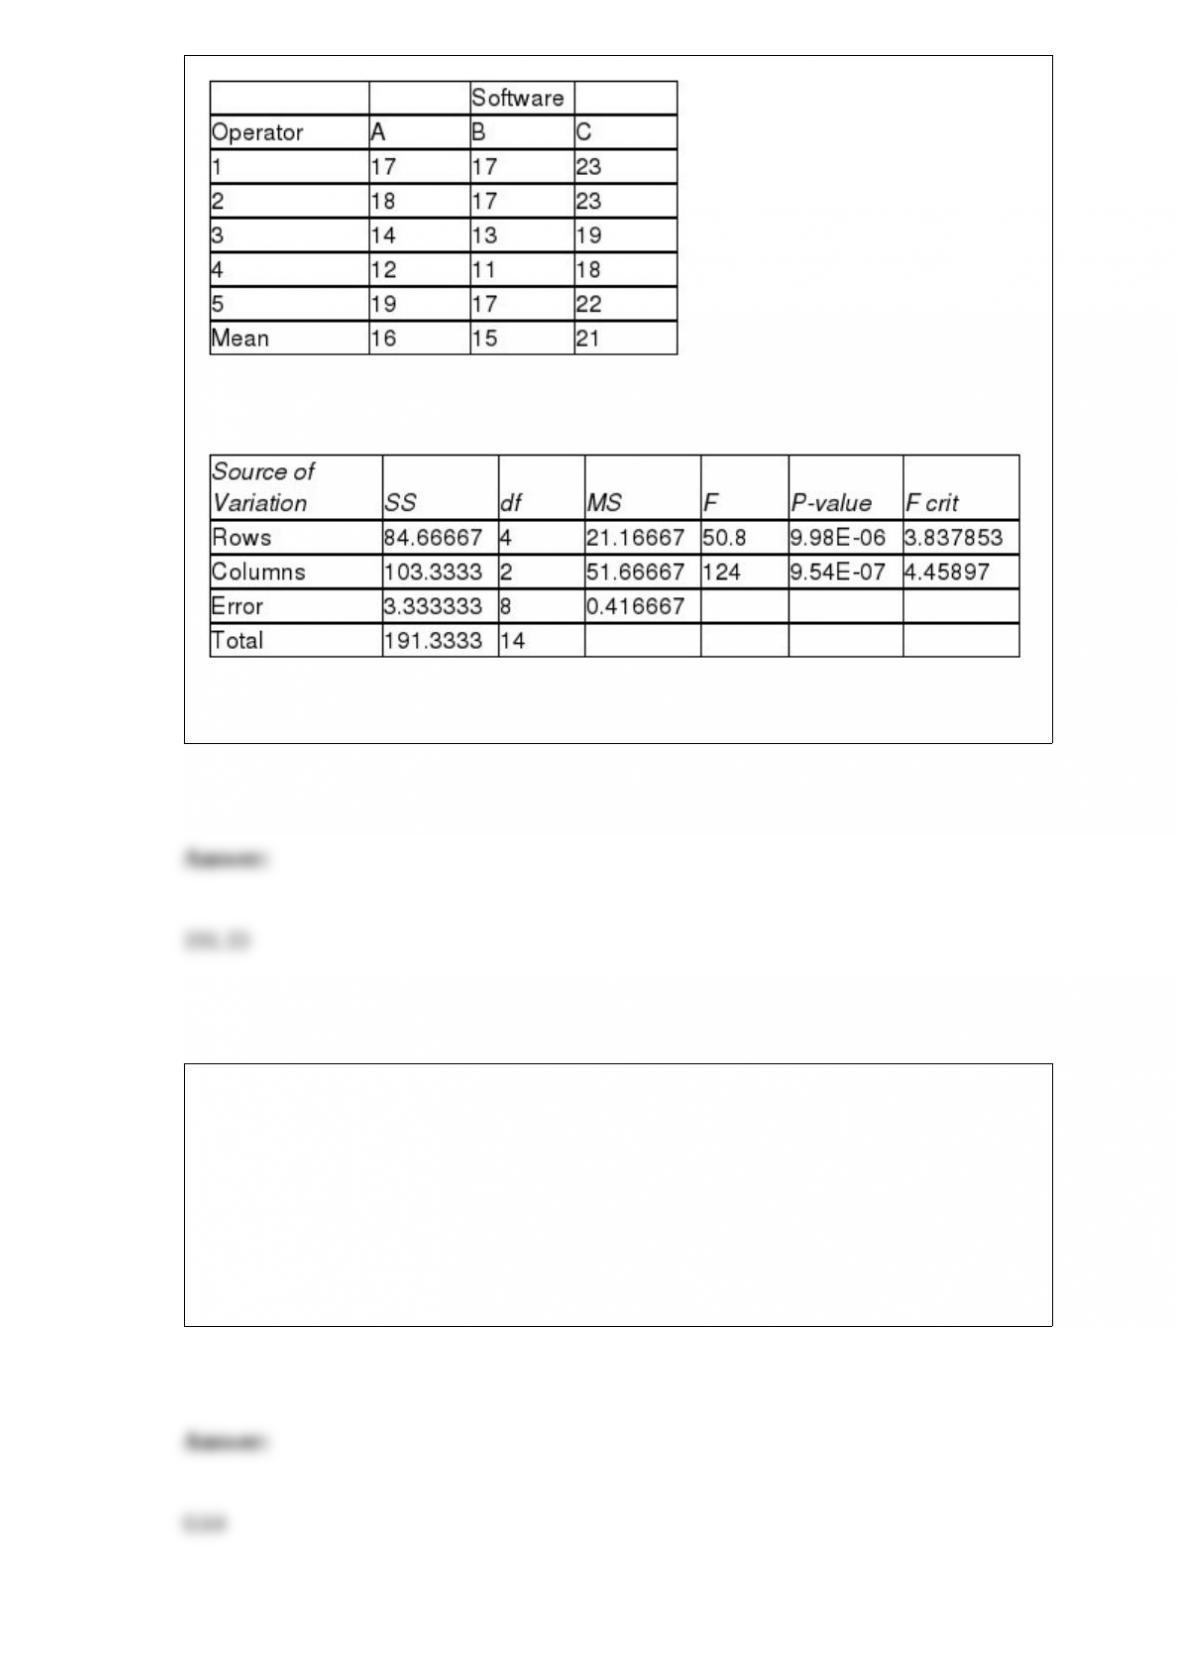
Below is the Excel output for the randomized block design:
Referring to Table 11-8, the amount of total variation or SST is ________.
TABLE 5-1
The probability that a particular type of smoke alarm will function properly and sound
an alarm in the presence of smoke is 0.8. You have 2 such alarms in your home and they
operate independently.
Referring to Table 5-1, the probability that both sound an alarm in the presence of
smoke is ________.
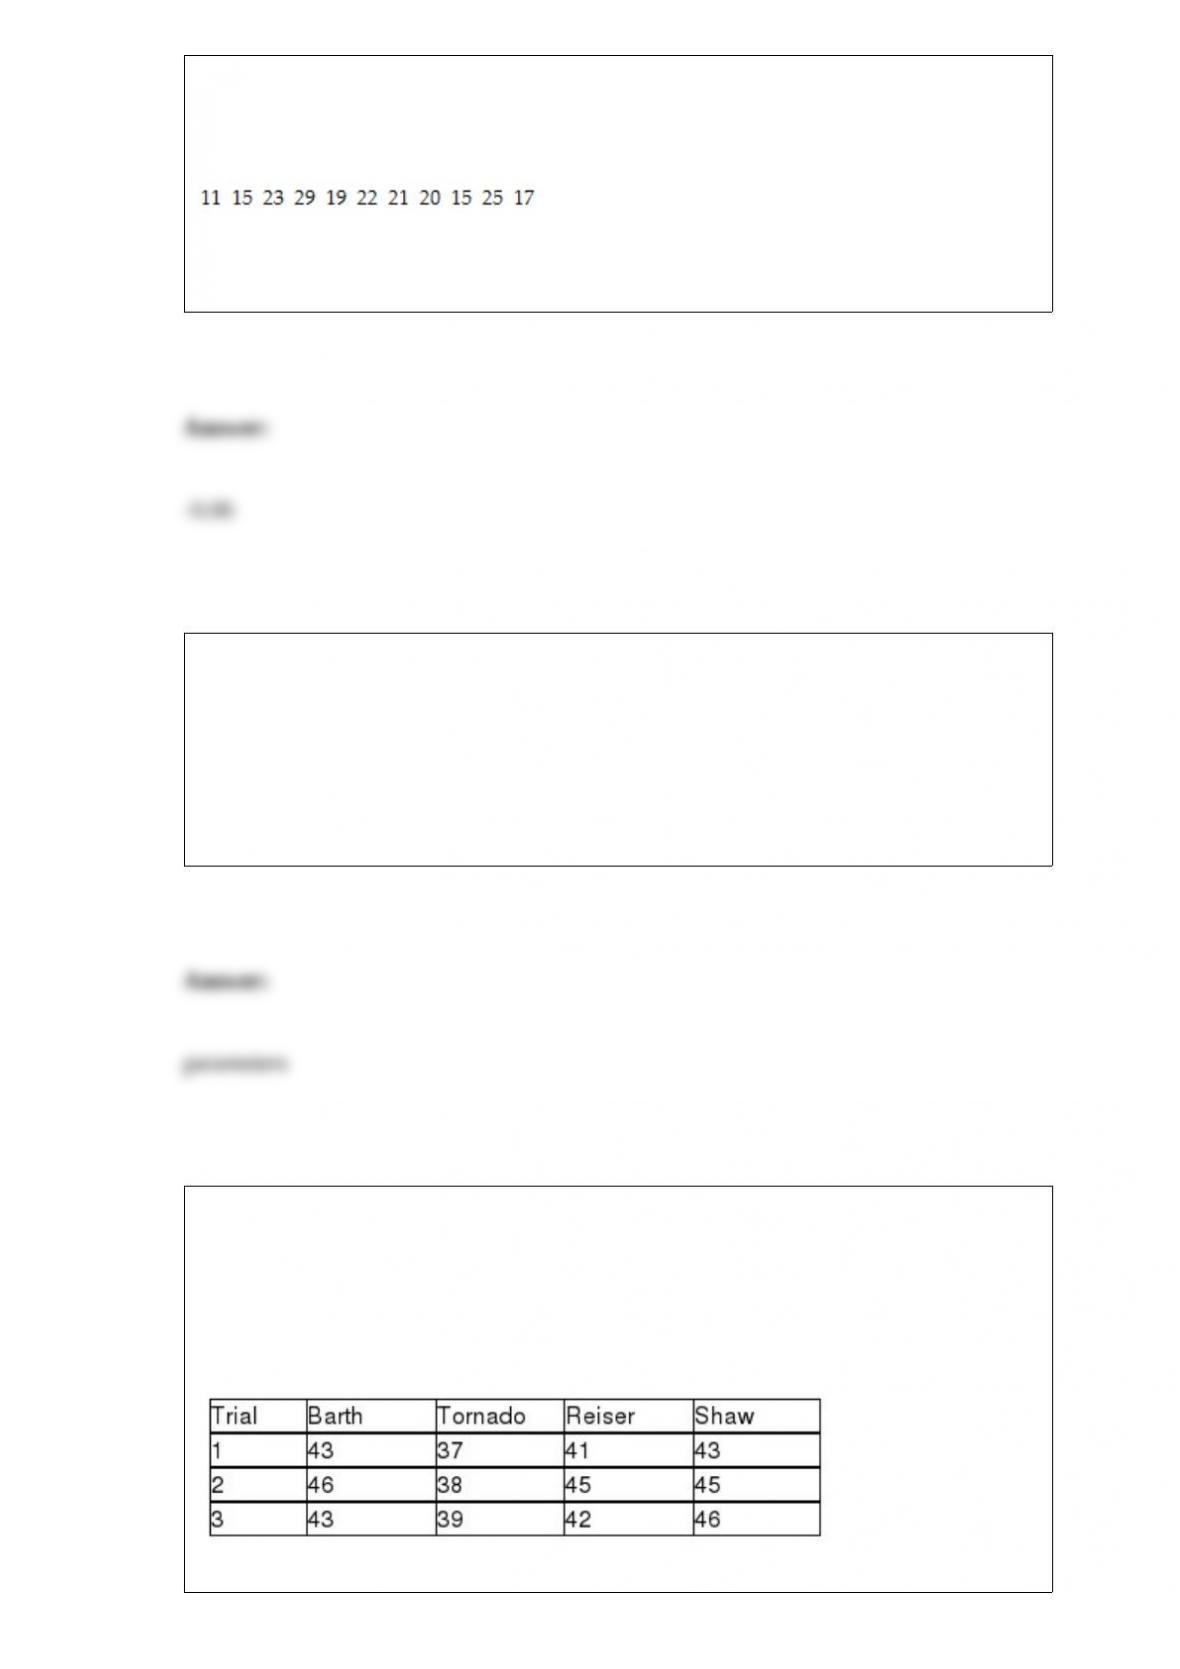
TABLE 3-2
The data below represent the amount of grams of carbohydrates in a serving of
breakfast cereal in a sample of 11 different servings.
Referring to Table 3-2, the kurtosis statistic for the carbohydrate amount in the cereal is
________.
The Quality Assurance Department of a large urban hospital is attempting to monitor
and evaluate patient satisfaction with hospital services. Prior to discharge, a random
sample of patients is asked to fill out a questionnaire to rate such services as medical
care, nursing, therapy, laboratory, food, and cleaning. The Quality Assurance
Department prepares weekly reports that are presented at the Board of Directors
meetings and extraordinary/atypical ratings are easy to flag. True population
characteristics estimated from the sample results each week are called ________.
TABLE 11-3
As part of an evaluation program, a sporting goods retailer wanted to compare the
downhill coasting speeds of 4 brands of bicycles. She took 3 of each brand and
determined their maximum downhill speeds. The results are presented in miles per hour
in the table below.
Referring to Table 11-3, what is the value of the test statistic for Levene’s test for
homogeneity of variances?
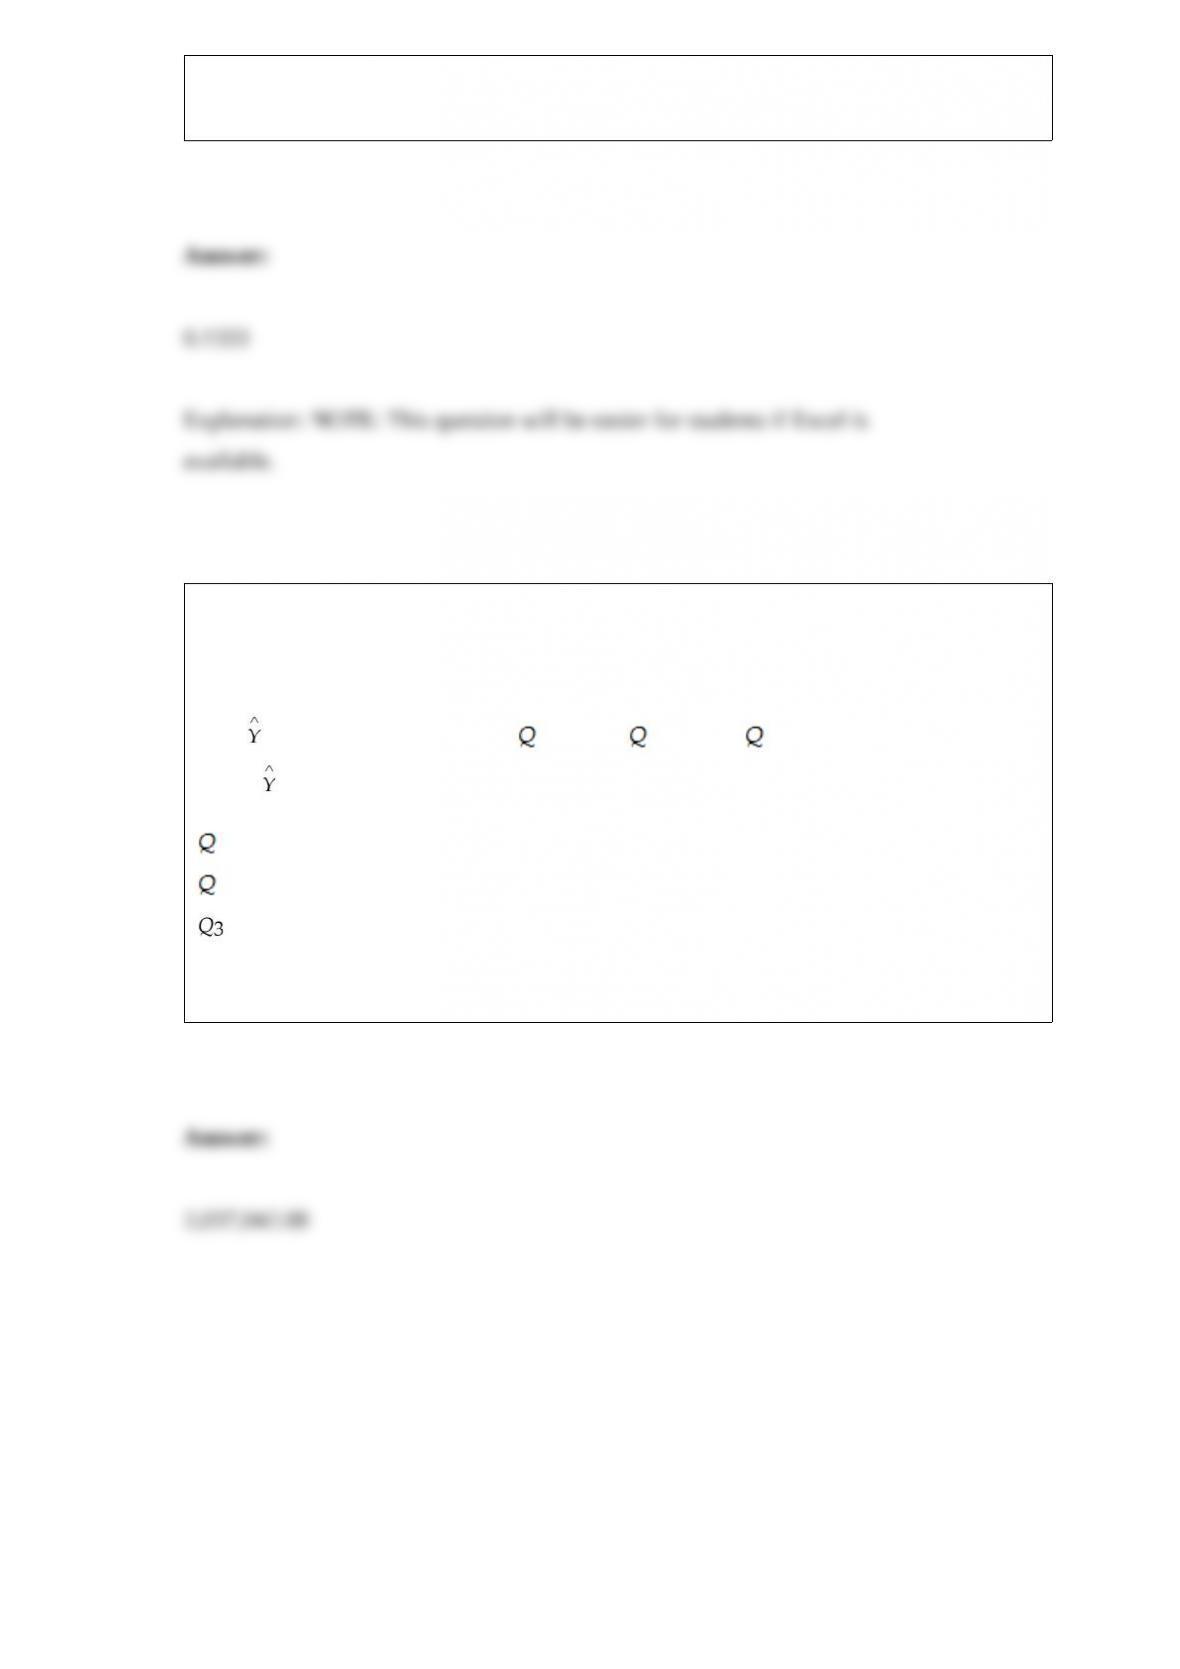
TABLE 16-12
A local store developed a multiplicative time-series model to forecast its revenues in
future quarters, using quarterly data on its revenues during the 5-year period from 2008
to 2012. The following is the resulting regression equation:
log10 = 6.102 + 0.012 X – 0.129 1 – 0.054 2 + 0.098 3
where is the estimated number of contracts in a quarter
X is the coded quarterly value with X = 0 in the first quarter of 2008
1 is a dummy variable equal to 1 in the first quarter of a year and 0 otherwise
2 is a dummy variable equal to 1 in the second quarter of a year and 0 otherwise
is a dummy variable equal to 1 in the third quarter of a year and 0 otherwise
Referring to Table 16-12, using the regression equation, what is the forecast for the
revenues in the first quarter of 2015?