The addition of visual elements that either fail to convey any useful information or that
obscure important points about the data in an attempt to enhance the visualization of
data is called ________.
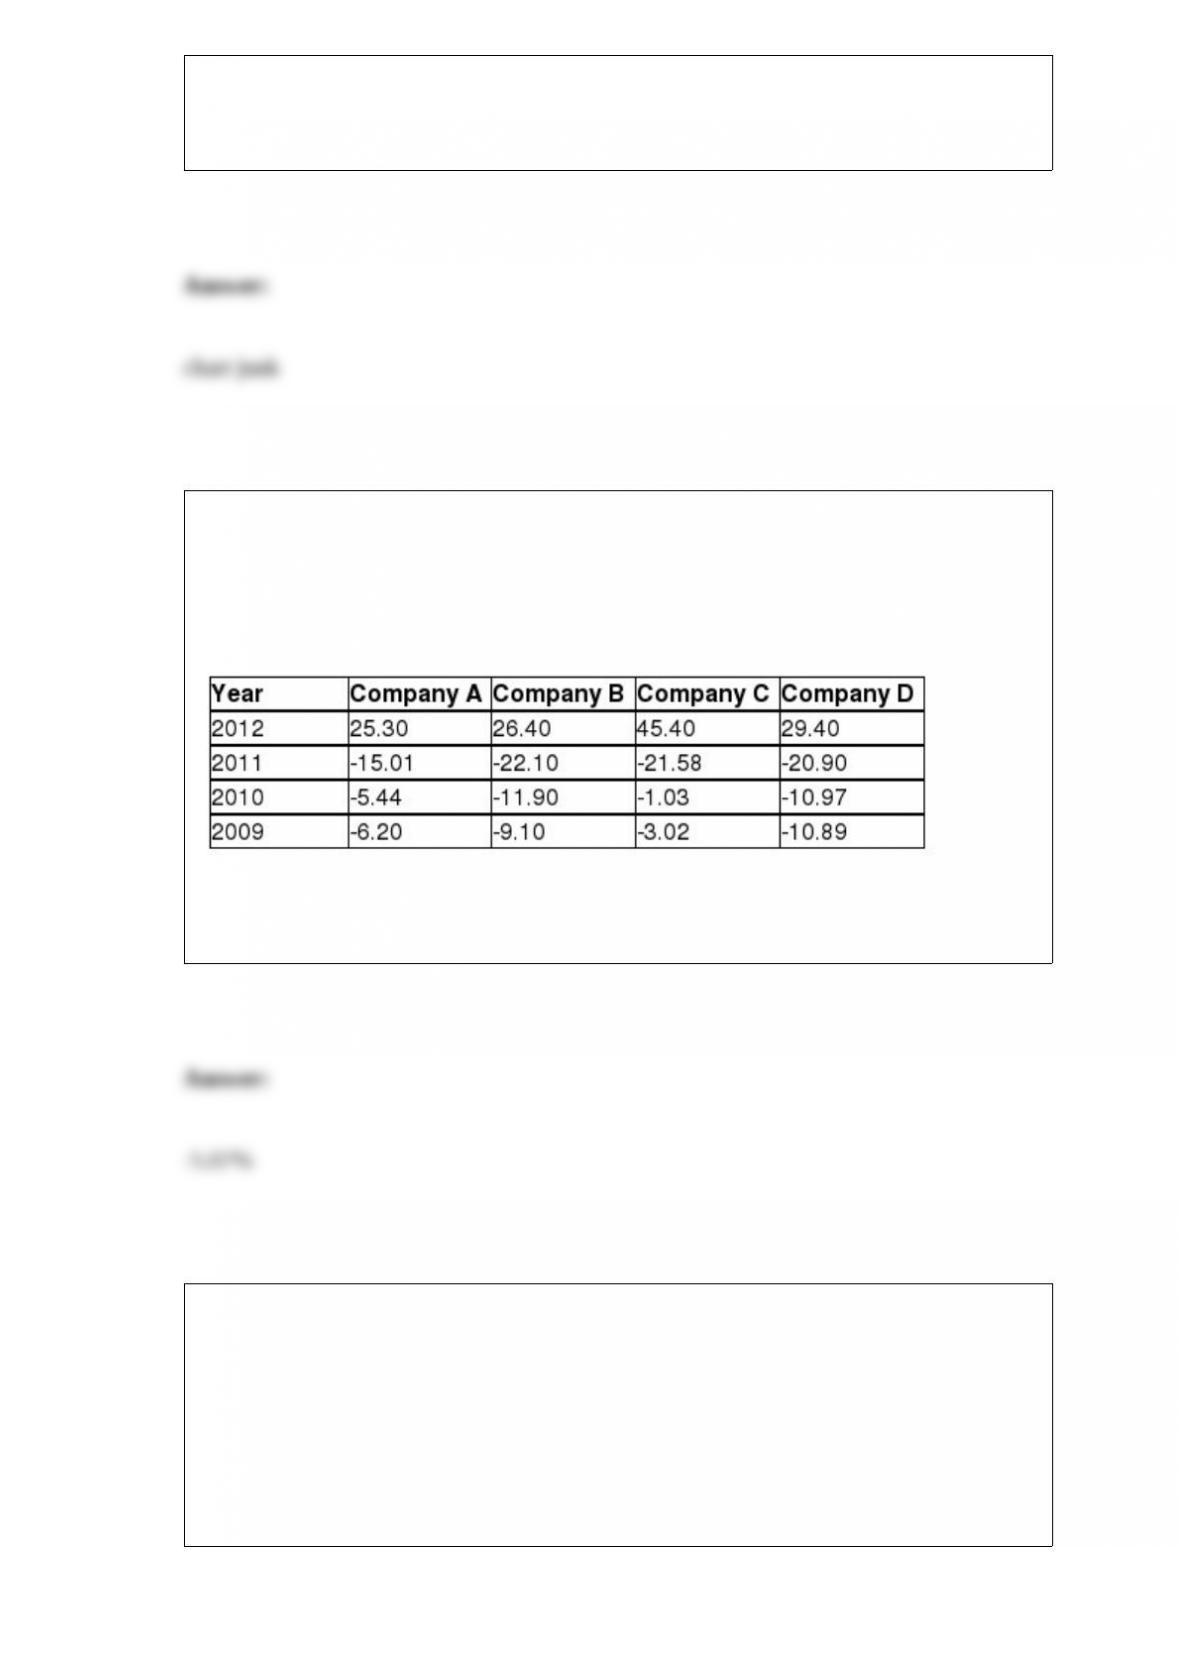
TABLE 3-8
The time period from 2009 to 2012 saw a great deal of volatility in the value of stocks.
The data in the following table represent the total rate of return of our companies from
2009 to 2012.
Referring to Table 3-8, calculate the geometric mean rate of return per year for
Company D.
TABLE 17-10
Given below are results from the regression analysis where the dependent variable is
the number of weeks a worker is unemployed due to a layoff (Unemploy) and the
independent variables are the age of the worker (Age), the number of years of education
received (Edu), the number of years at the previous job (Job Yr), a dummy variable for
marital status (Married: 1 = married, 0 = otherwise), a dummy variable for head of
household (Head: 1 = yes, 0 = no) and a dummy variable for management position
(Manager: 1 = yes, 0 = no). We shall call this Model 1. The coefficient of partial
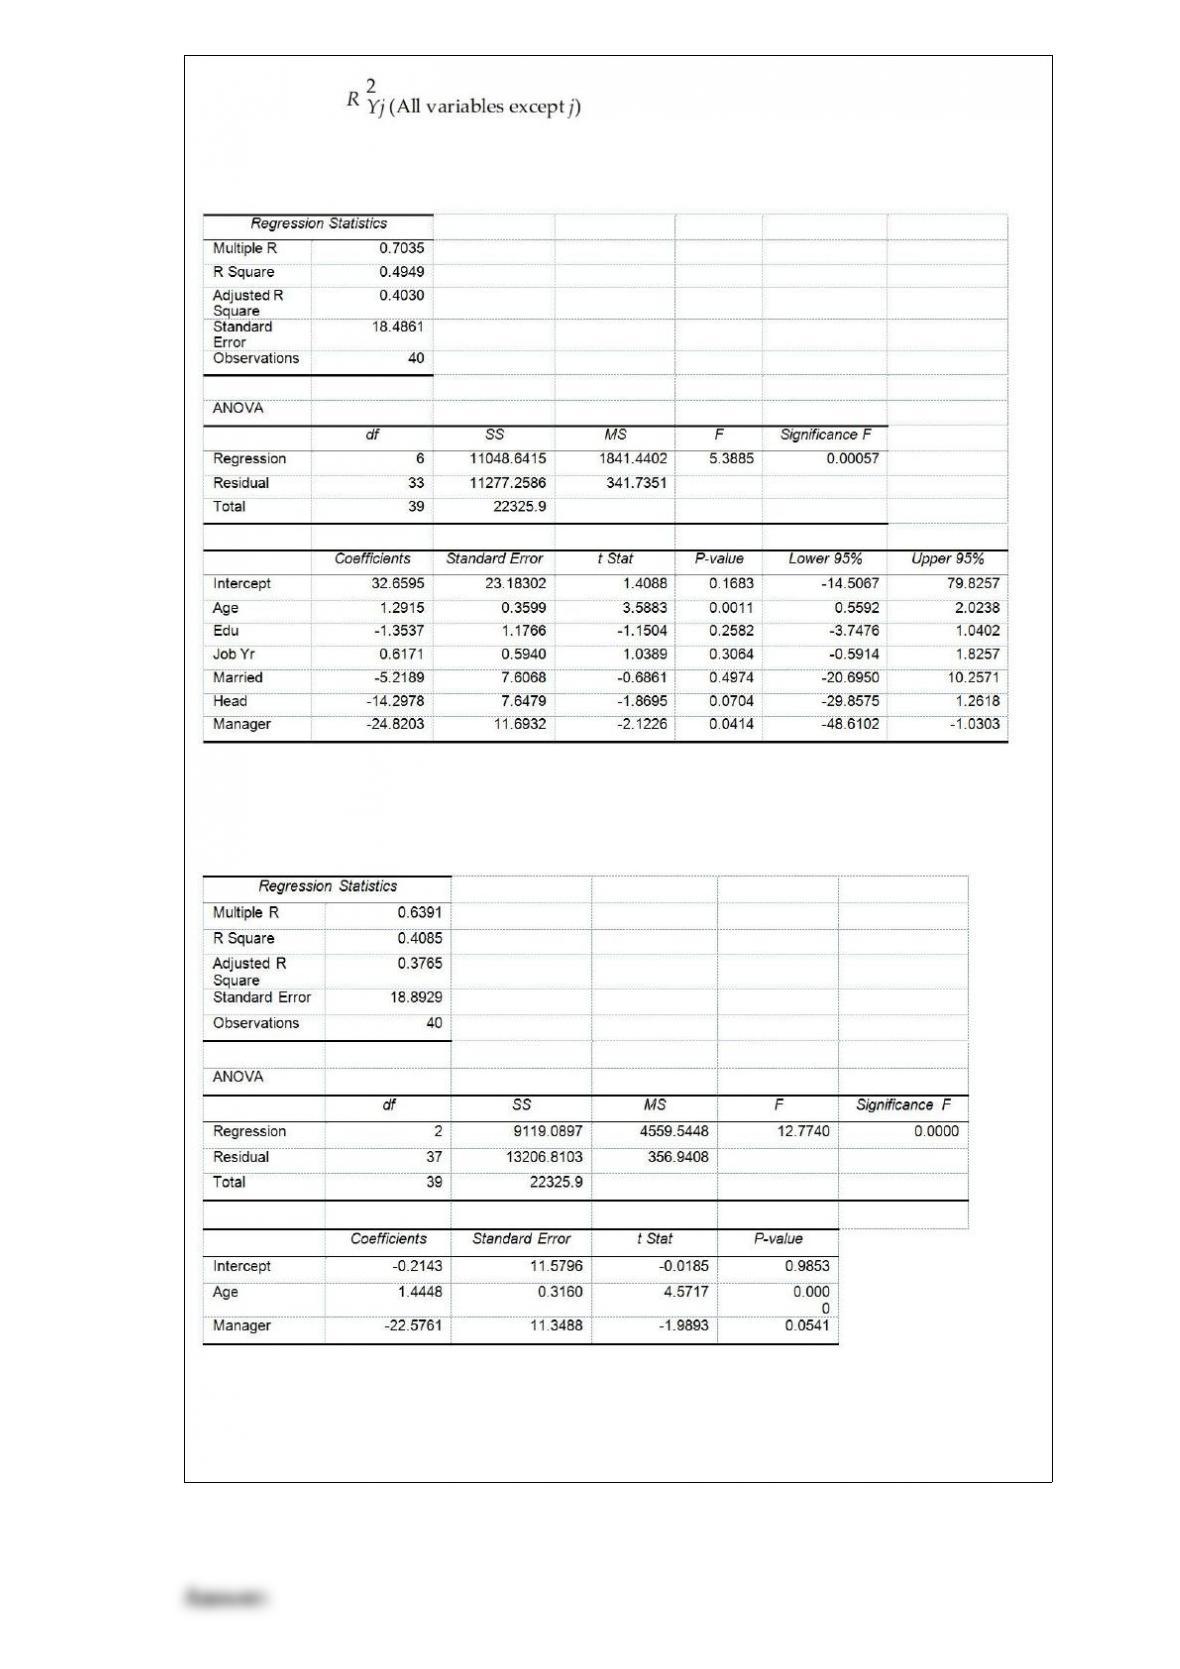
determination ( ) of each of the 6 predictors are, respectively,
0.2807, 0.0386, 0.0317, 0.0141, 0.0958, and 0.1201.
Model 2 is the regression analysis where the dependent variable is Unemploy and the
independent variables are Age and Manager. The results of the regression analysis are
given below:
Referring to Table 17-10, Model 1, estimate the mean number of weeks being
unemployed due to a layoff for a worker who is a thirty-year-old, has 10 years of
education, has 15 years of experience at the previous job, is married, is the head of
household and is a manager.
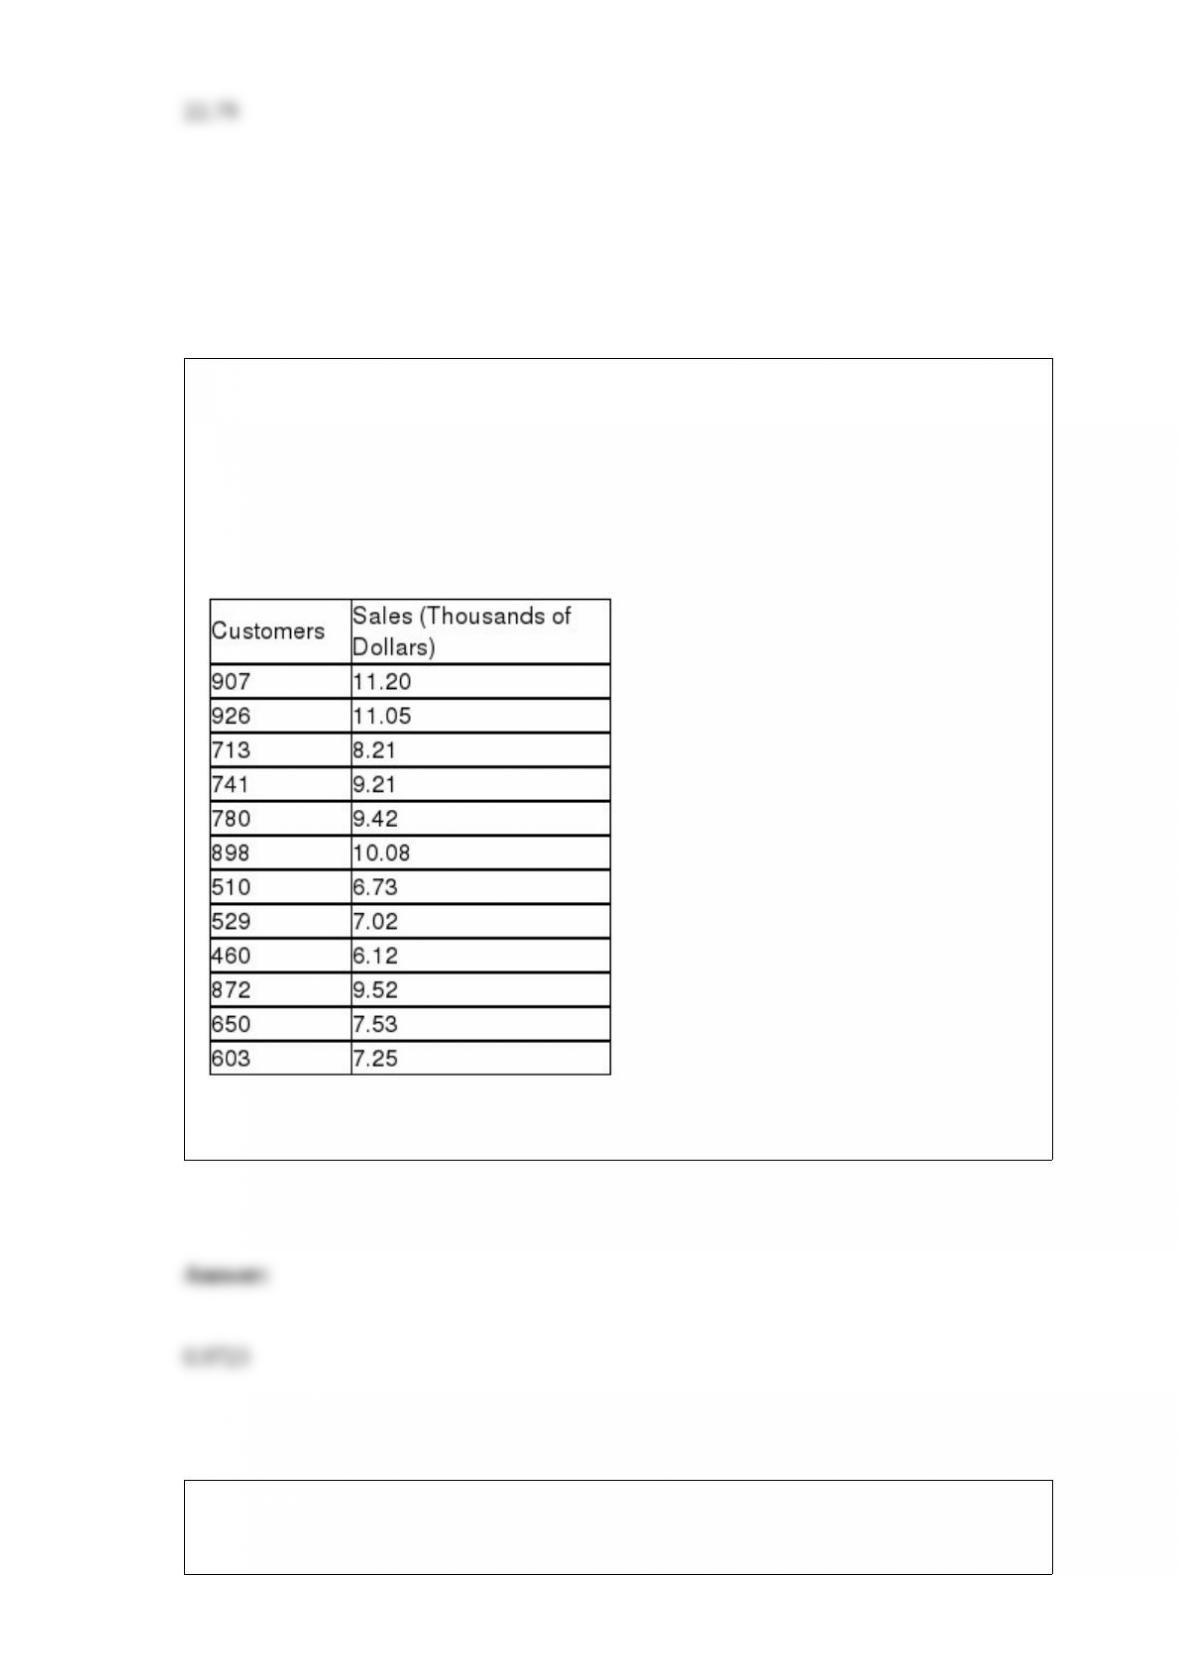
TABLE 13-10
The management of a chain electronic store would like to develop a model for
predicting the weekly sales (in thousands of dollars) for individual stores based on the
number of customers who made purchases. A random sample of 12 stores yields the
following results:
Referring to Table 13-10, what is the value of the coefficient of correlation?
Referring to Table 17-3, the analyst decided to construct a 99% confidence interval for
β3. The confidence interval is from ________ to ________.

Referring to Table 14-19, what should be the decision (‘reject’ or ‘do
not reject’) on the null hypothesis when testing whether Income
makes a signi”cant contribution to the model in the presence of
LawnSize at a 0.05 level of signi”cance?
TABLE 14-19
The marketing manager for a nationally franchised lawn service
company would like to study the characteristics that di,erentiate
home owners who do and do not have a lawn service. A random
sample of 30 home owners located in a suburban area near a large
city was selected; 11 did not have a lawn service (code 0) and 19 had
a lawn service (code 1). Additional information available concerning
these 30 home owners includes family income (Income, in thousands
of dollars) and lawn size (Lawn Size, in thousands of square feet).
The PHStat output is given below:

TABLE 6-2
John has two jobs. For daytime work at a jewelry store he is paid $15,000 per month,
plus a commission. His monthly commission is normally distributed with a mean of
$10,000 and a standard deviation of $2,000. At night he works occasionally as a waiter,
for which his monthly income is normally distributed with a mean of $1,000 and a
standard deviation of $300. John’s income levels from these two sources are
independent of each other.
Referring to Table 6-2, the probability is 0.45 that John’s income as a waiter is more
than how much in a given month?