Unlock document.
This document is partially blurred.
Unlock all pages and 1 million more documents.
Get Access
TABLE 8-16
The president of a university is concerned that the percentage of students who have
cheated on an exam is higher than the 1% acceptable level. A confidential random
sample of 1,000 students from a population of 7,000 revealed that 6 of them said that
they had cheated on an exam during the last semester.
Referring to Table 8-16, what is the upper bound of the 90% one-sided confidence
interval for the proportion of students who had cheated on an exam during the last 12
months?
TABLE 6-2
John has two jobs. For daytime work at a jewelry store he is paid $15,000 per month,
plus a commission. His monthly commission is normally distributed with a mean of
$10,000 and a standard deviation of $2,000. At night he works occasionally as a waiter,
for which his monthly income is normally distributed with a mean of $1,000 and a
standard deviation of $300. John's income levels from these two sources are
independent of each other.
Referring to Table 6-2, the probability is 0.30 that John's commission from the jewelry
store is no more than how much in a given month?
TABLE 12-6
According to an article in Marketing News, fewer checks are being written at the
grocery store checkout than in the past. To determine whether there is a difference in
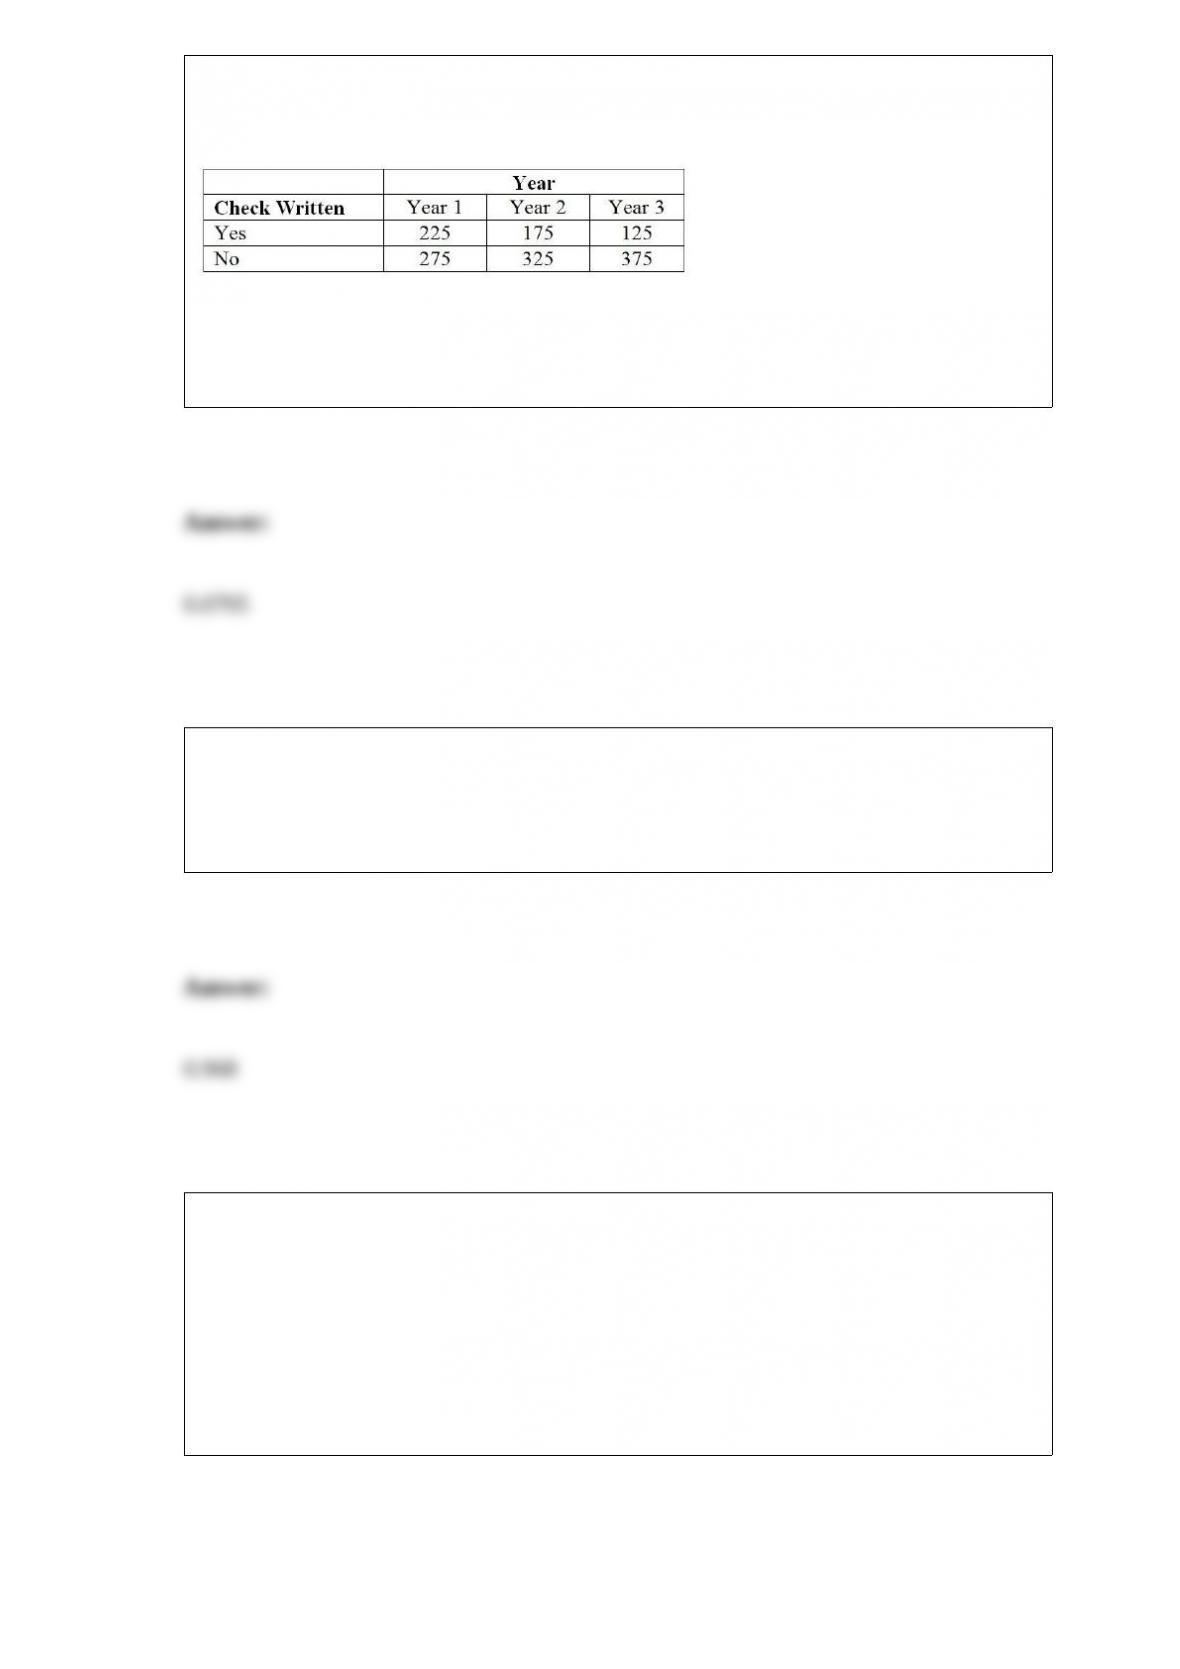
the proportion of shoppers who pay by check among three consecutive years at a 0.05
level of significance, the results of a survey of 500 shoppers in three consecutive years
are obtained and presented below.
Referring to Table 12-6, what is the value of the critical range for the Marascuilo
procedure to test for the difference in proportions between year 2 and year 3 using a
0.05 level of significance?
In a game called Taxation and Evasion, a player rolls a pair of dice. If on any turn the
sum is 7, 11, or 12, the player gets audited. Otherwise, she avoids taxes. Suppose a
player takes 5 turns at rolling the dice. The standard deviation of the number of times
she will be audited is ________.
TABLE 13-13
In this era of tough economic conditions, voters increasingly ask the question: "Is the
educational achievement level of students dependent on the amount of money the state
in which they reside spends on education?" The partial computer output below is the
result of using spending per student ($) as the independent variable and composite score
which is the sum of the math, science and reading scores as the dependent variable on
35 states that participated in a study. The table includes only partial results.
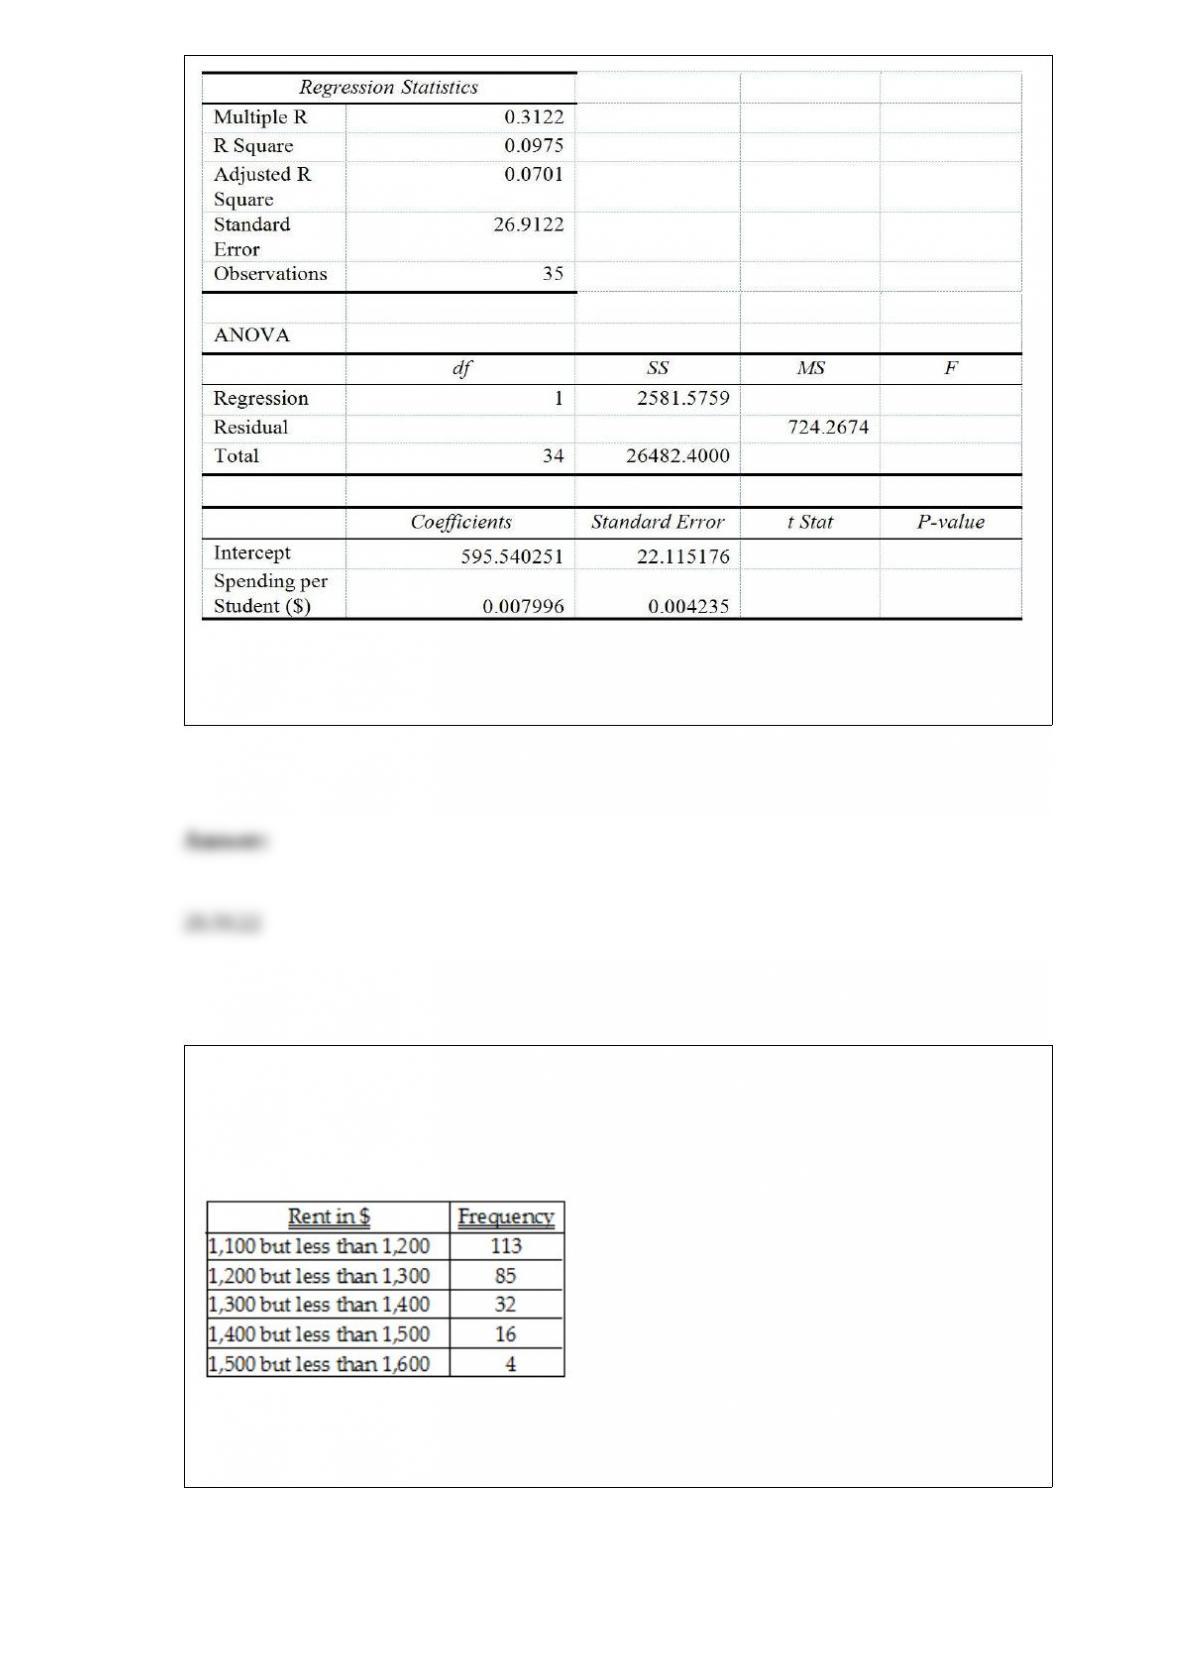
Referring to Table 13-13, what is the standard deviation of the composite score around
the regression line?
TABLE 2-9
The frequency distribution below represents the rents of 250 randomly selected
federally subsidized apartments in a small town.
Referring to Table 2-9, the percentage of apartments renting for less than $1,400 is
________.
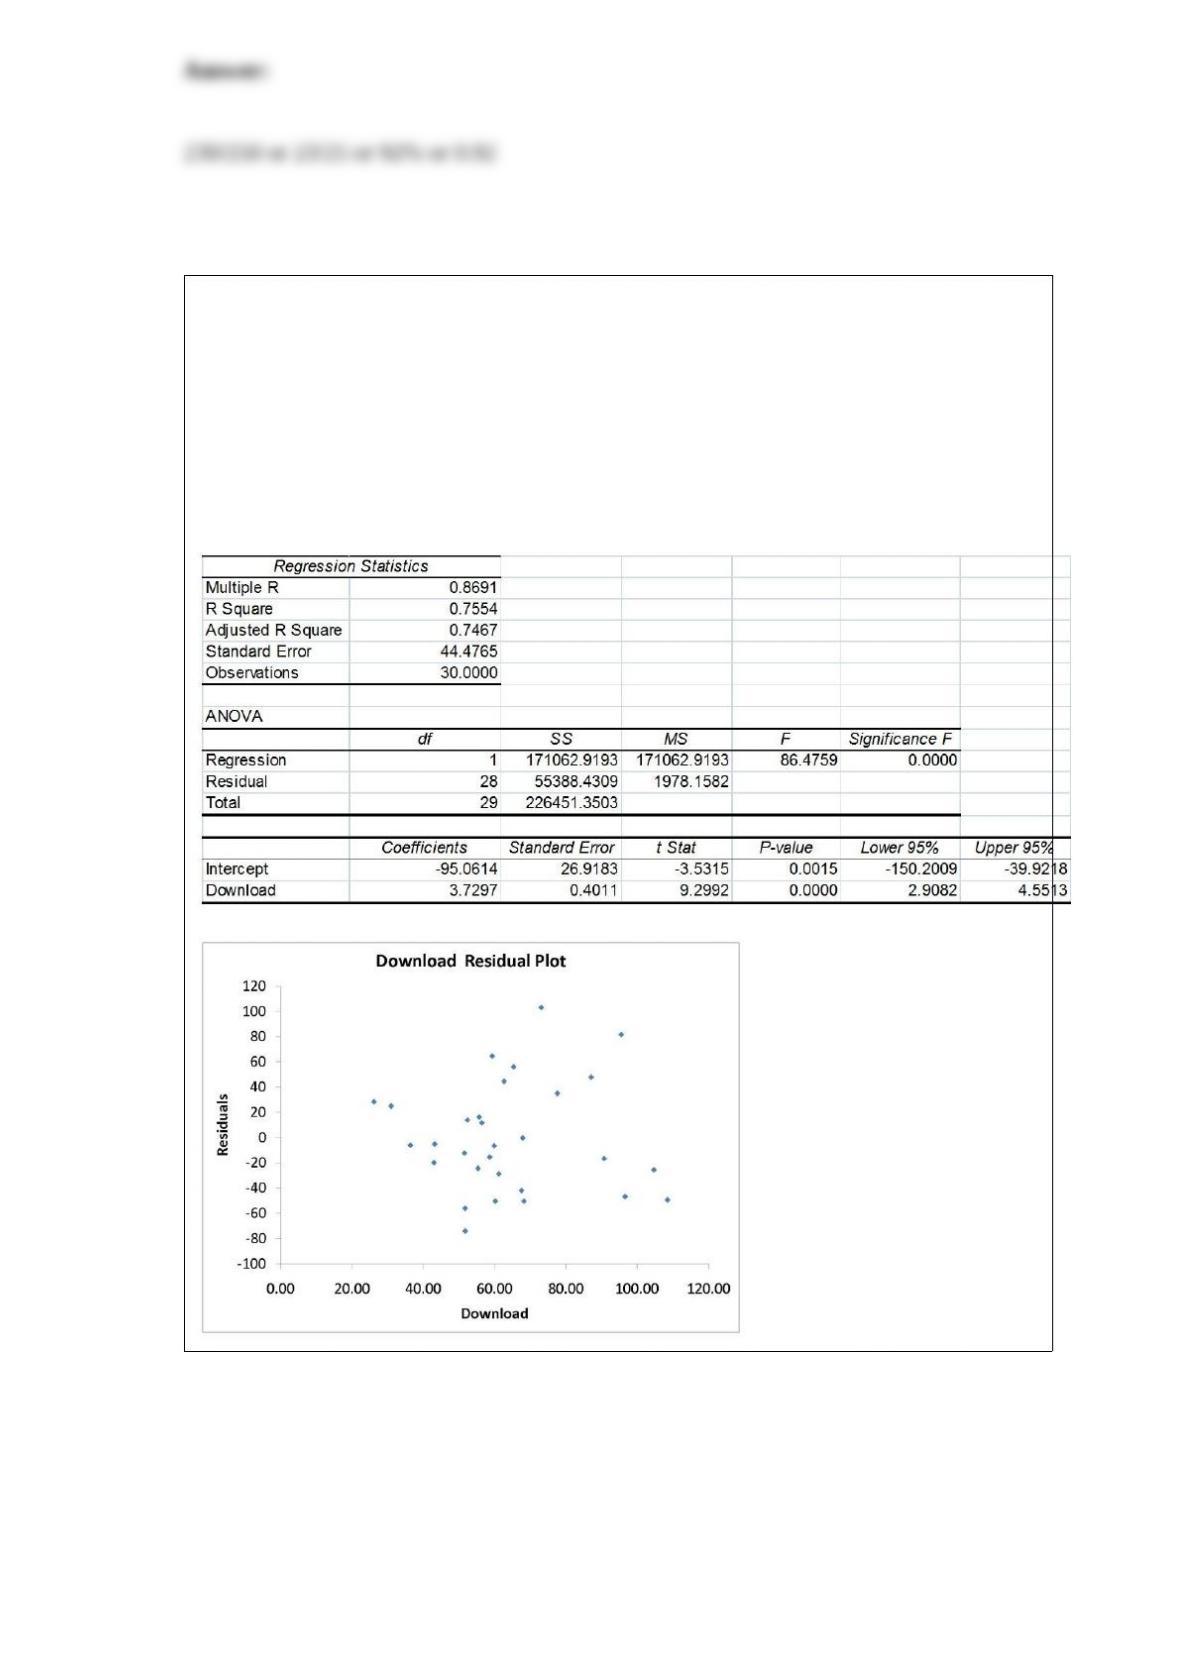
TABLE 13-11
A computer software developer would like to use the number of downloads (in
thousands) for the trial version of his new shareware to predict the amount of revenue
(in thousands of dollars) he can make on the full version of the new shareware.
Following is the output from a simple linear regression along with the residual plot and
normal probability plot obtained from a data set of 30 different sharewares that he has
developed:
Referring to Table 13-11, what is the standard deviation around the regression line?
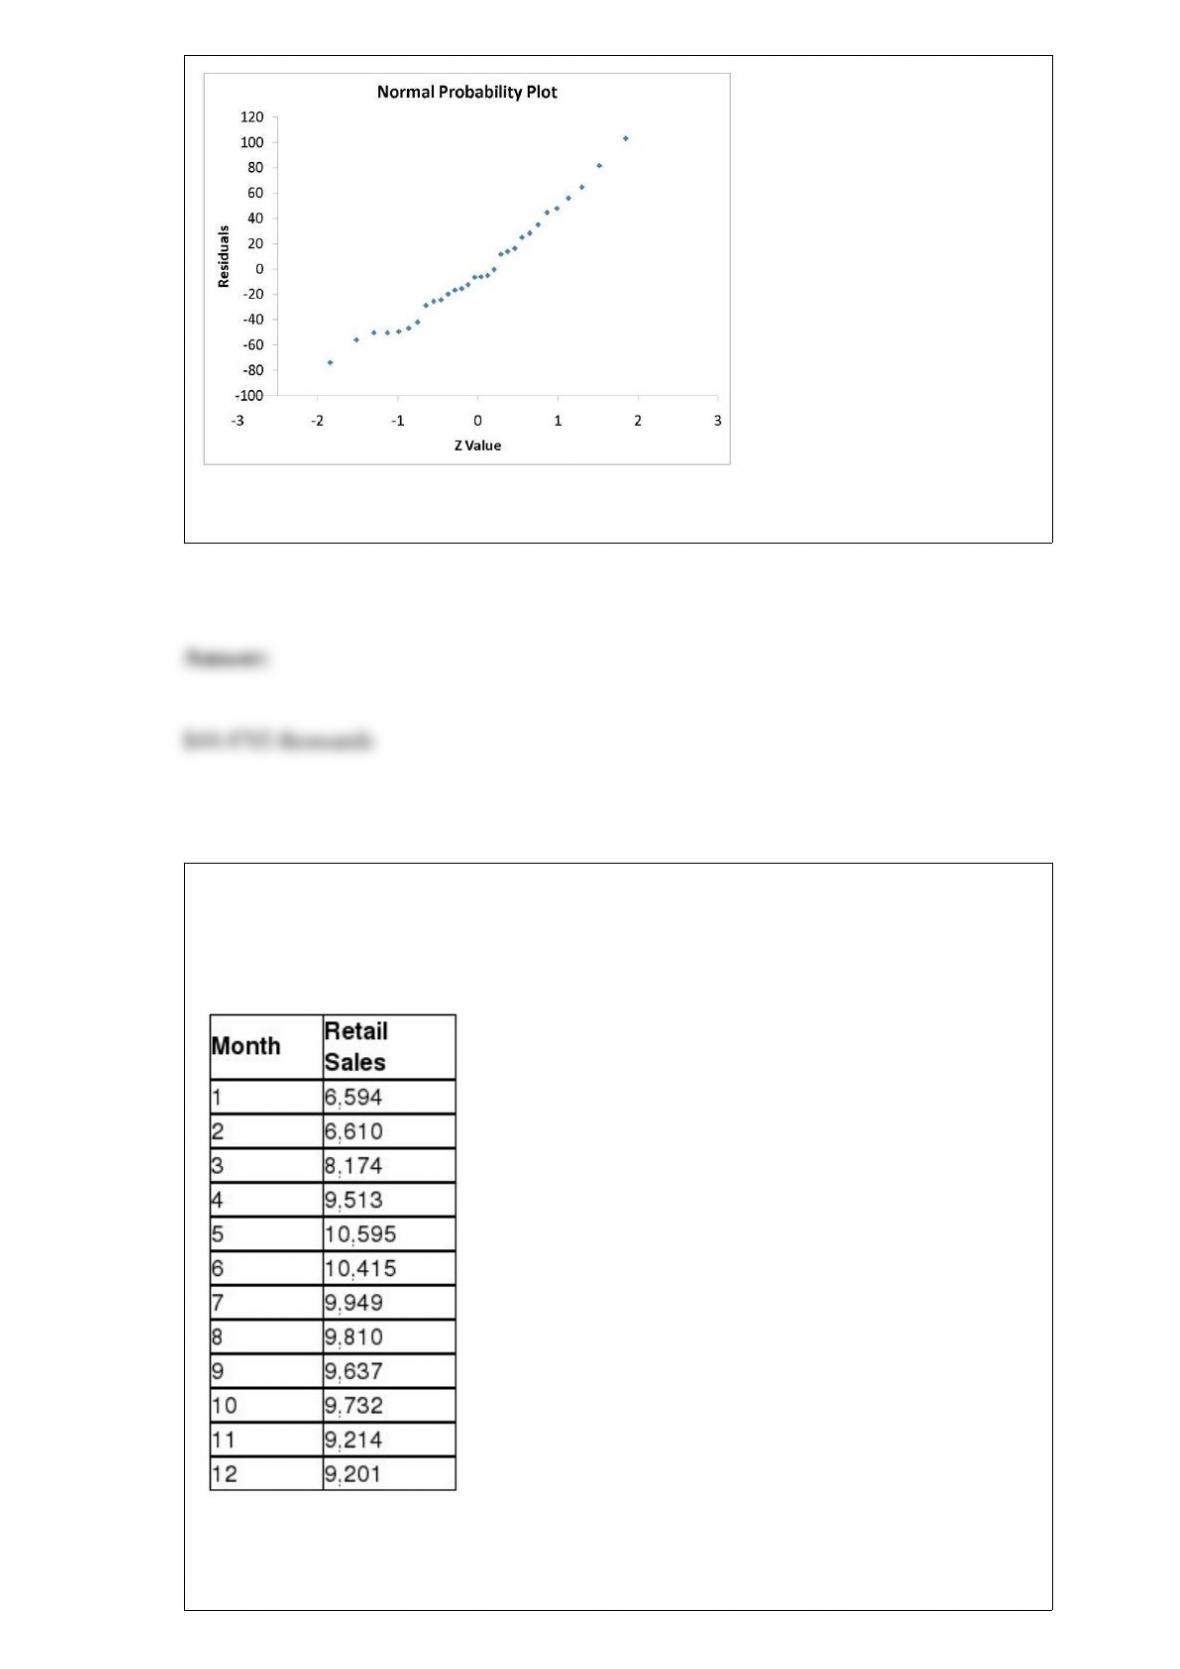
TABLE 16-13
Given below is the monthly time-series data for U.S. retail sales of building materials
over a specific year.
The results of the linear trend, quadratic trend, exponential trend, first-order
autoregressive, second-order autoregressive and third-order autoregressive model are
presented below in which the coded month for the 1st month is 0:
Linear trend model:
Quadratic trend model:
Exponential trend model:
First-order autoregressive:
Second-order autoregressive:
Third-order autoregressive:
Below is the residual plot of the various models:
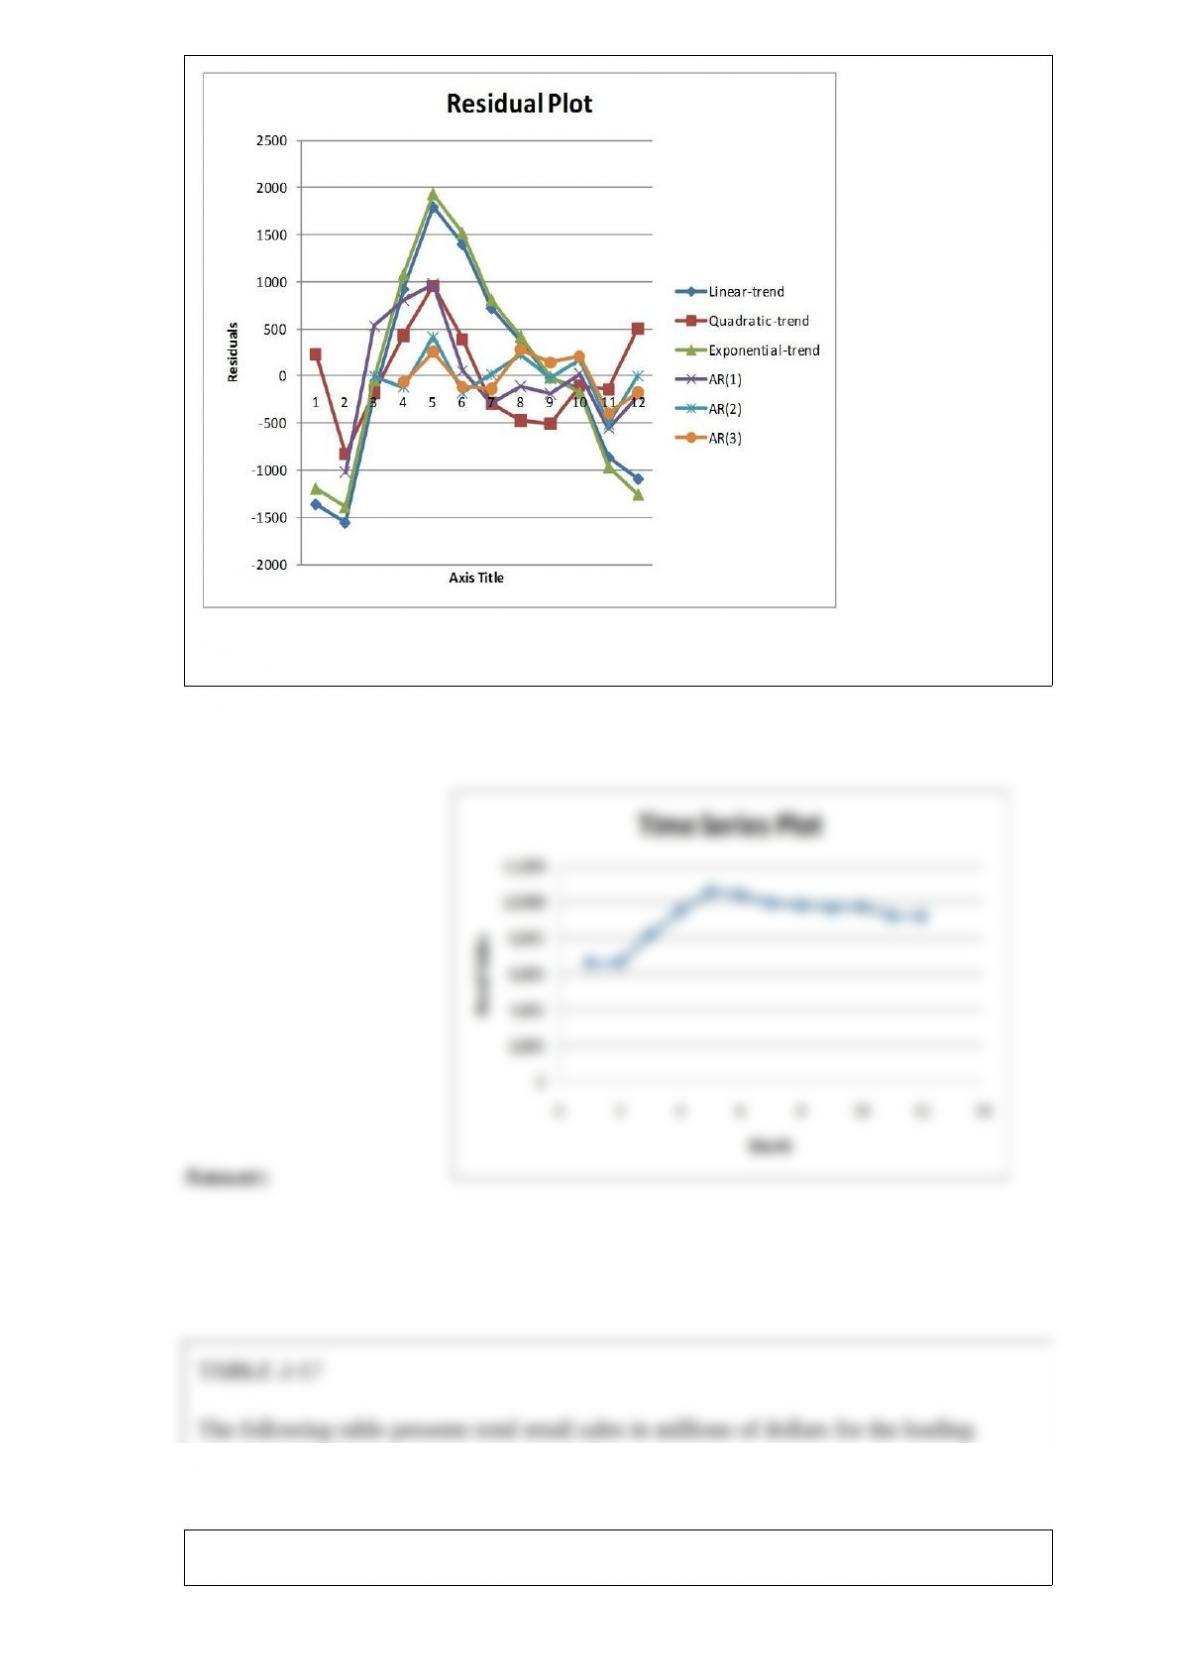
Referring to Table 16-13, construct a scatter plot (i.e., a time-series plot) with month on
the horizontal X-axis.
TABLE 2-17
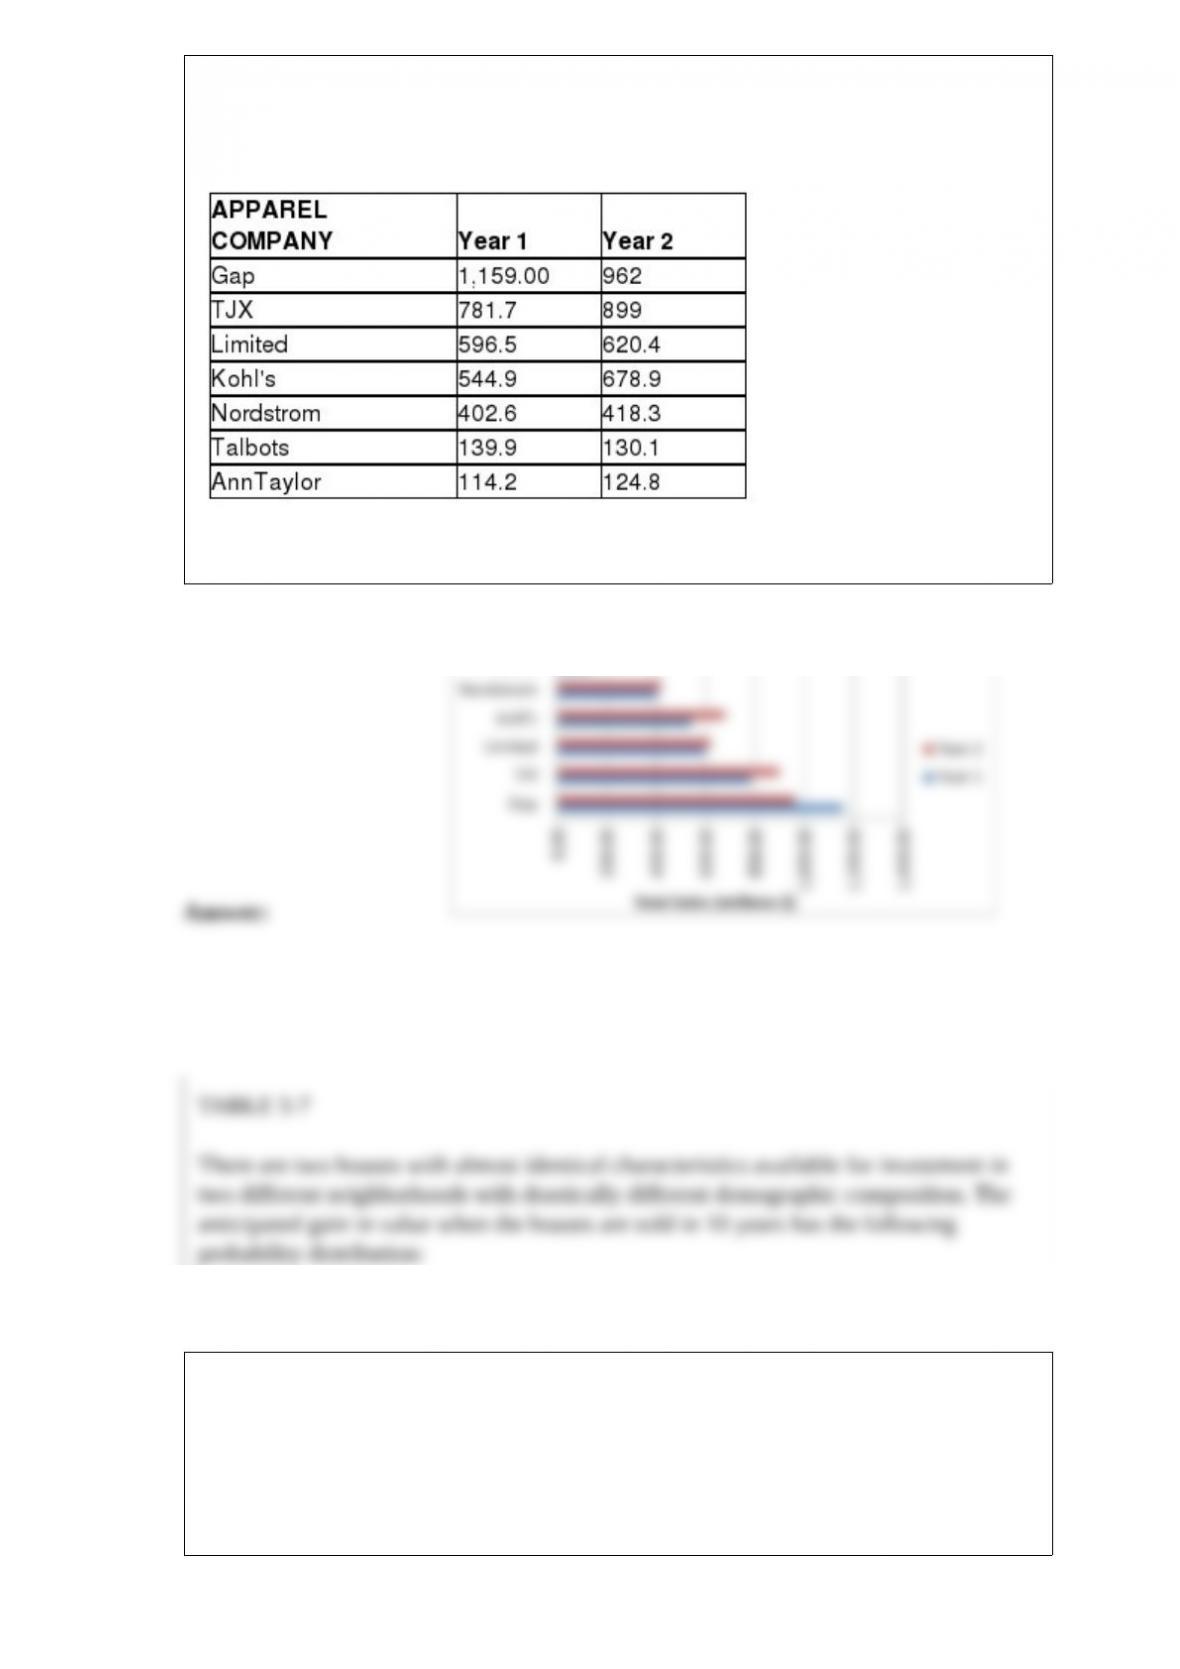
The following table presents total retail sales in millions of dollars for the leading
apparel companies over a two-year period.
Referring to Table 2-17, construct a side-by-side bar chart.
TABLE 5-7
There are two houses with almost identical characteristics available for investment in
two different neighborhoods with drastically different demographic composition. The
anticipated gain in value when the houses are sold in 10 years has the following
probability distribution:
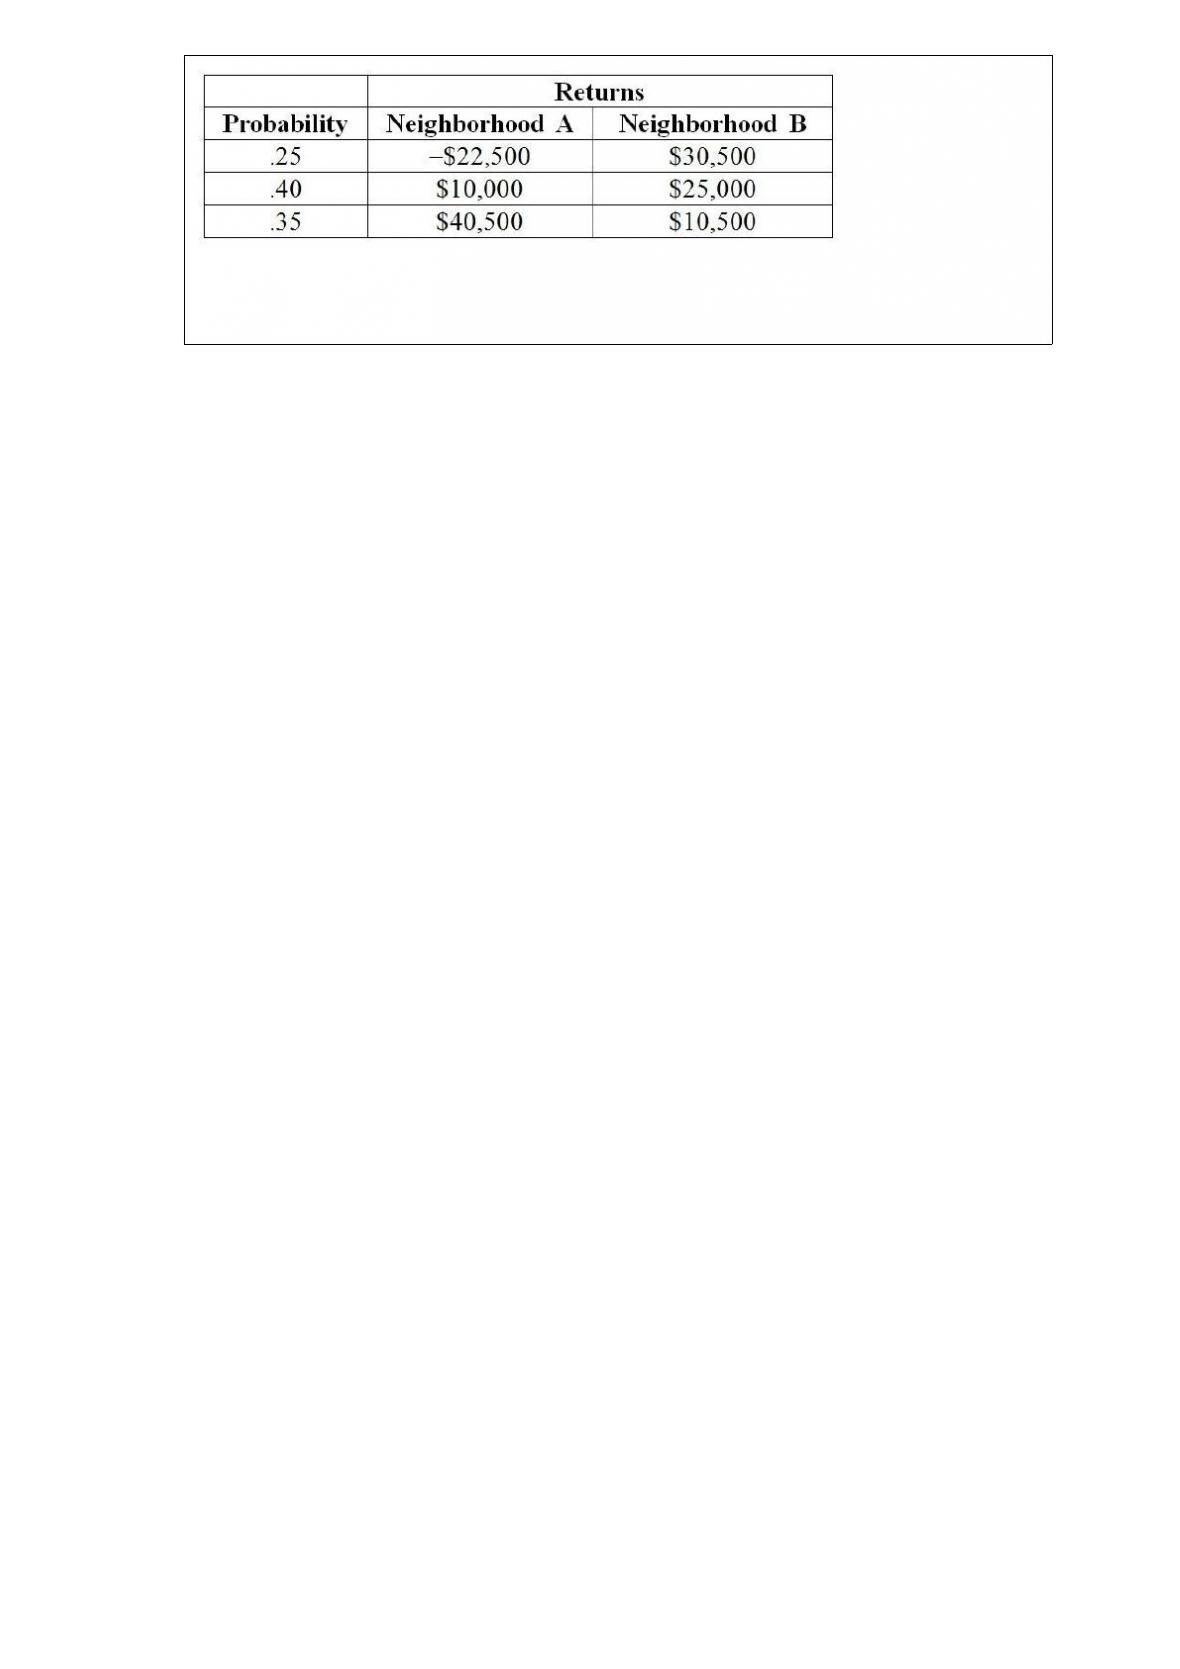
Referring to Table 5-7, what is the expected value gain for the house in neighborhood
B?


