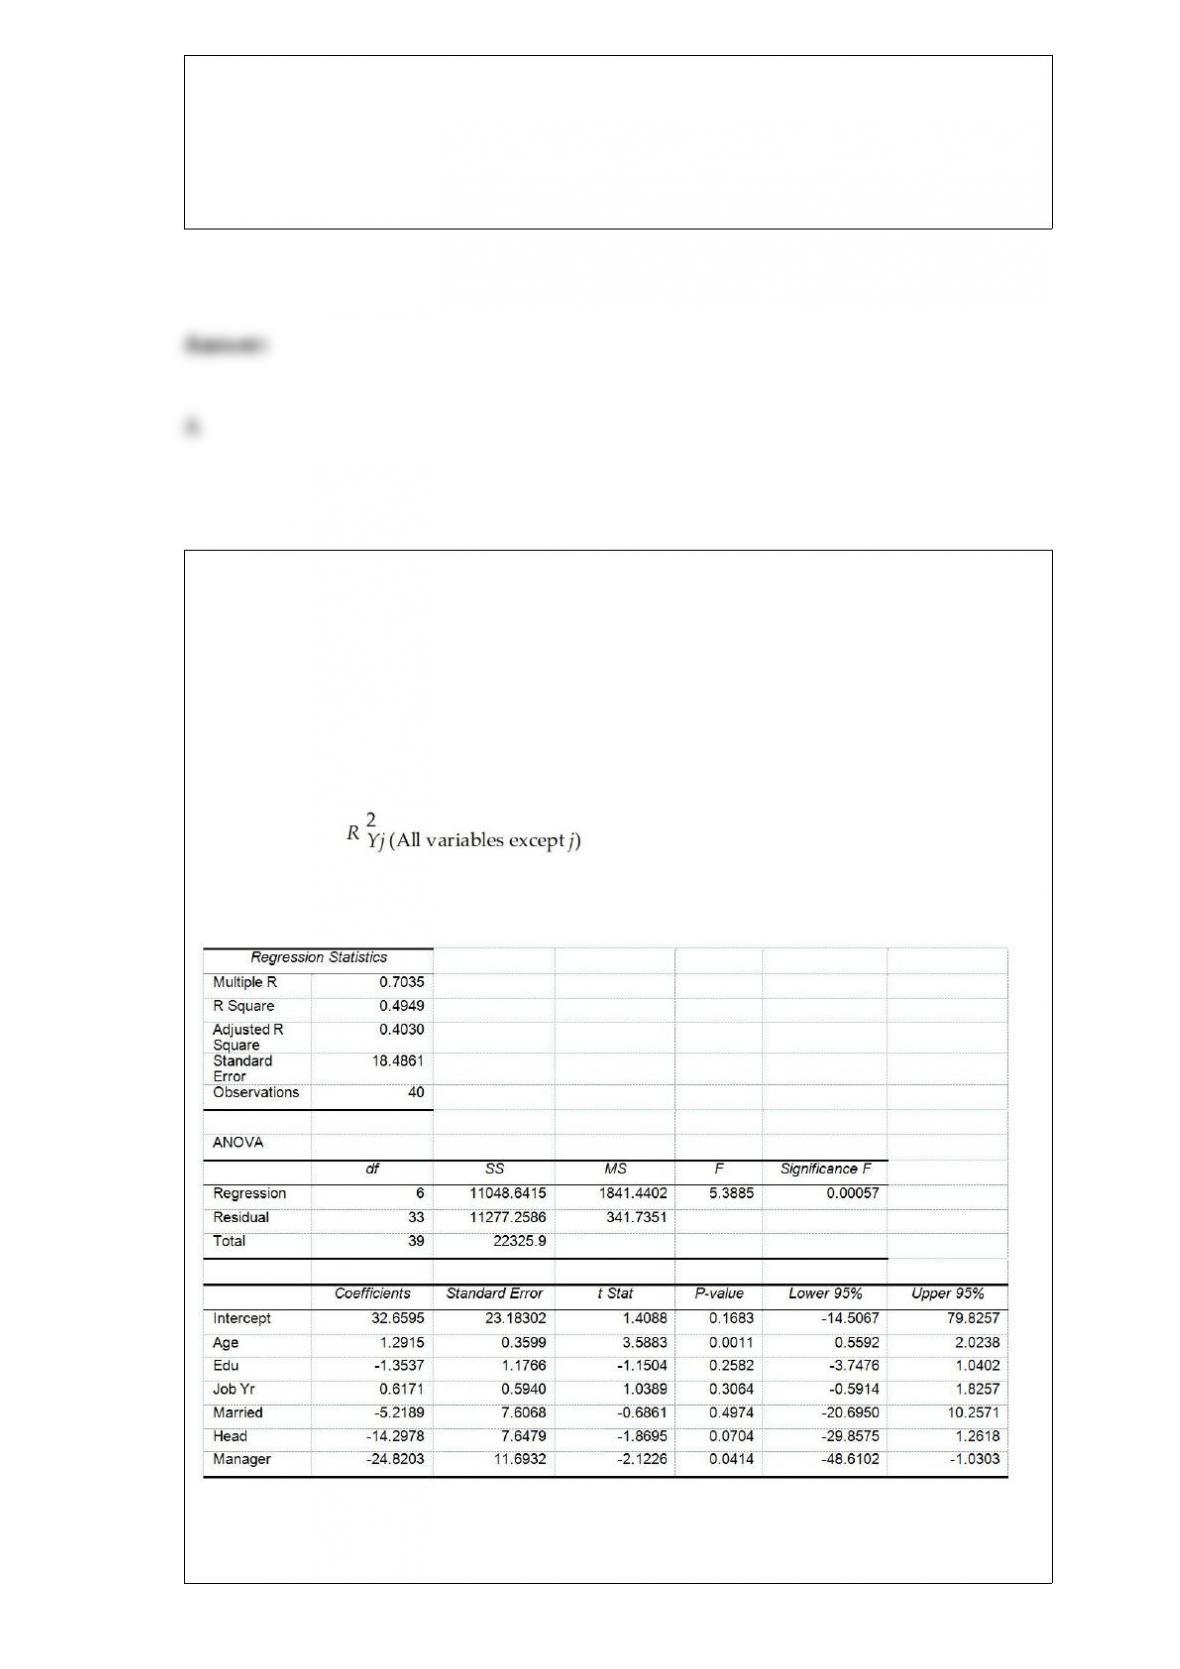
True or False: TABLE 17-10
Given below are results from the regression analysis where the dependent variable is
the number of weeks a worker is unemployed due to a layoff (Unemploy) and the
independent variables are the age of the worker (Age), the number of years of education
received (Edu), the number of years at the previous job (Job Yr), a dummy variable for
marital status (Married: 1 = married, 0 = otherwise), a dummy variable for head of
household (Head: 1 = yes, 0 = no) and a dummy variable for management position
(Manager: 1 = yes, 0 = no). We shall call this Model 1. The coefficient of partial
determination ( ) of each of the 6 predictors are, respectively,
0.2807, 0.0386, 0.0317, 0.0141, 0.0958, and 0.1201.
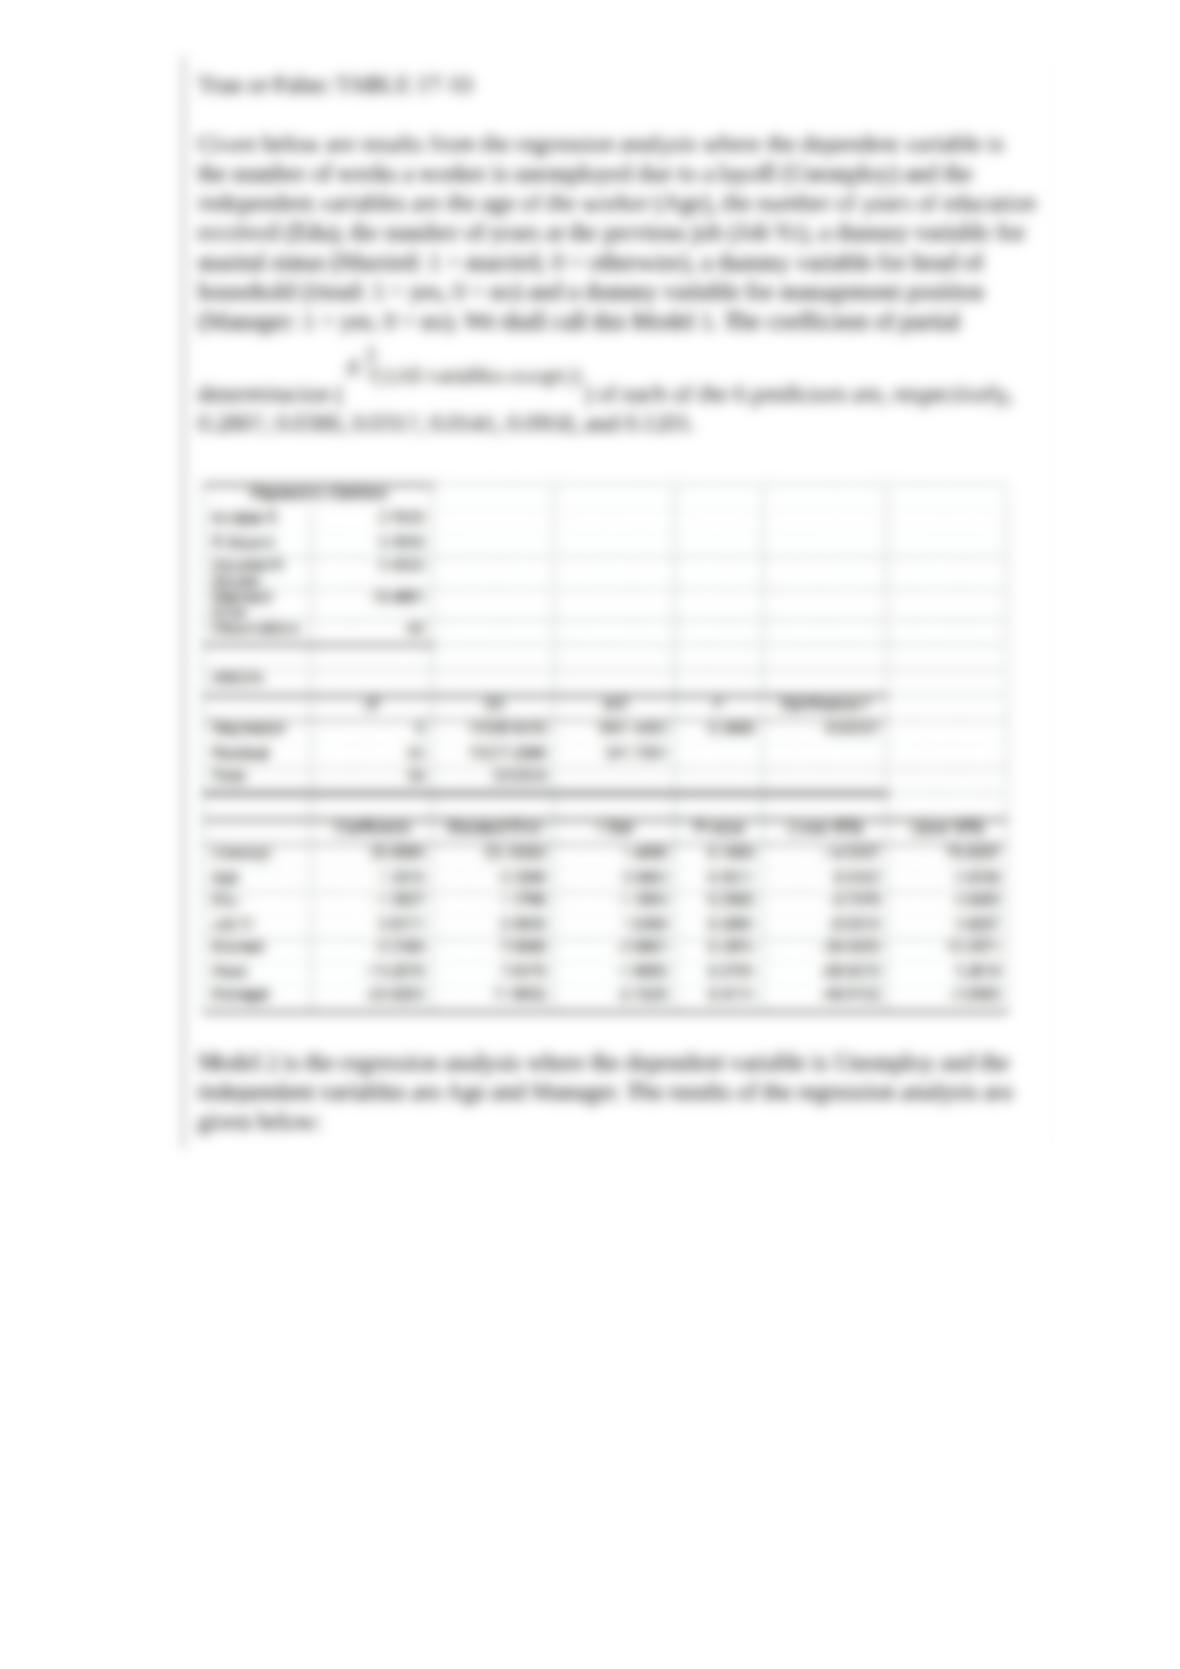
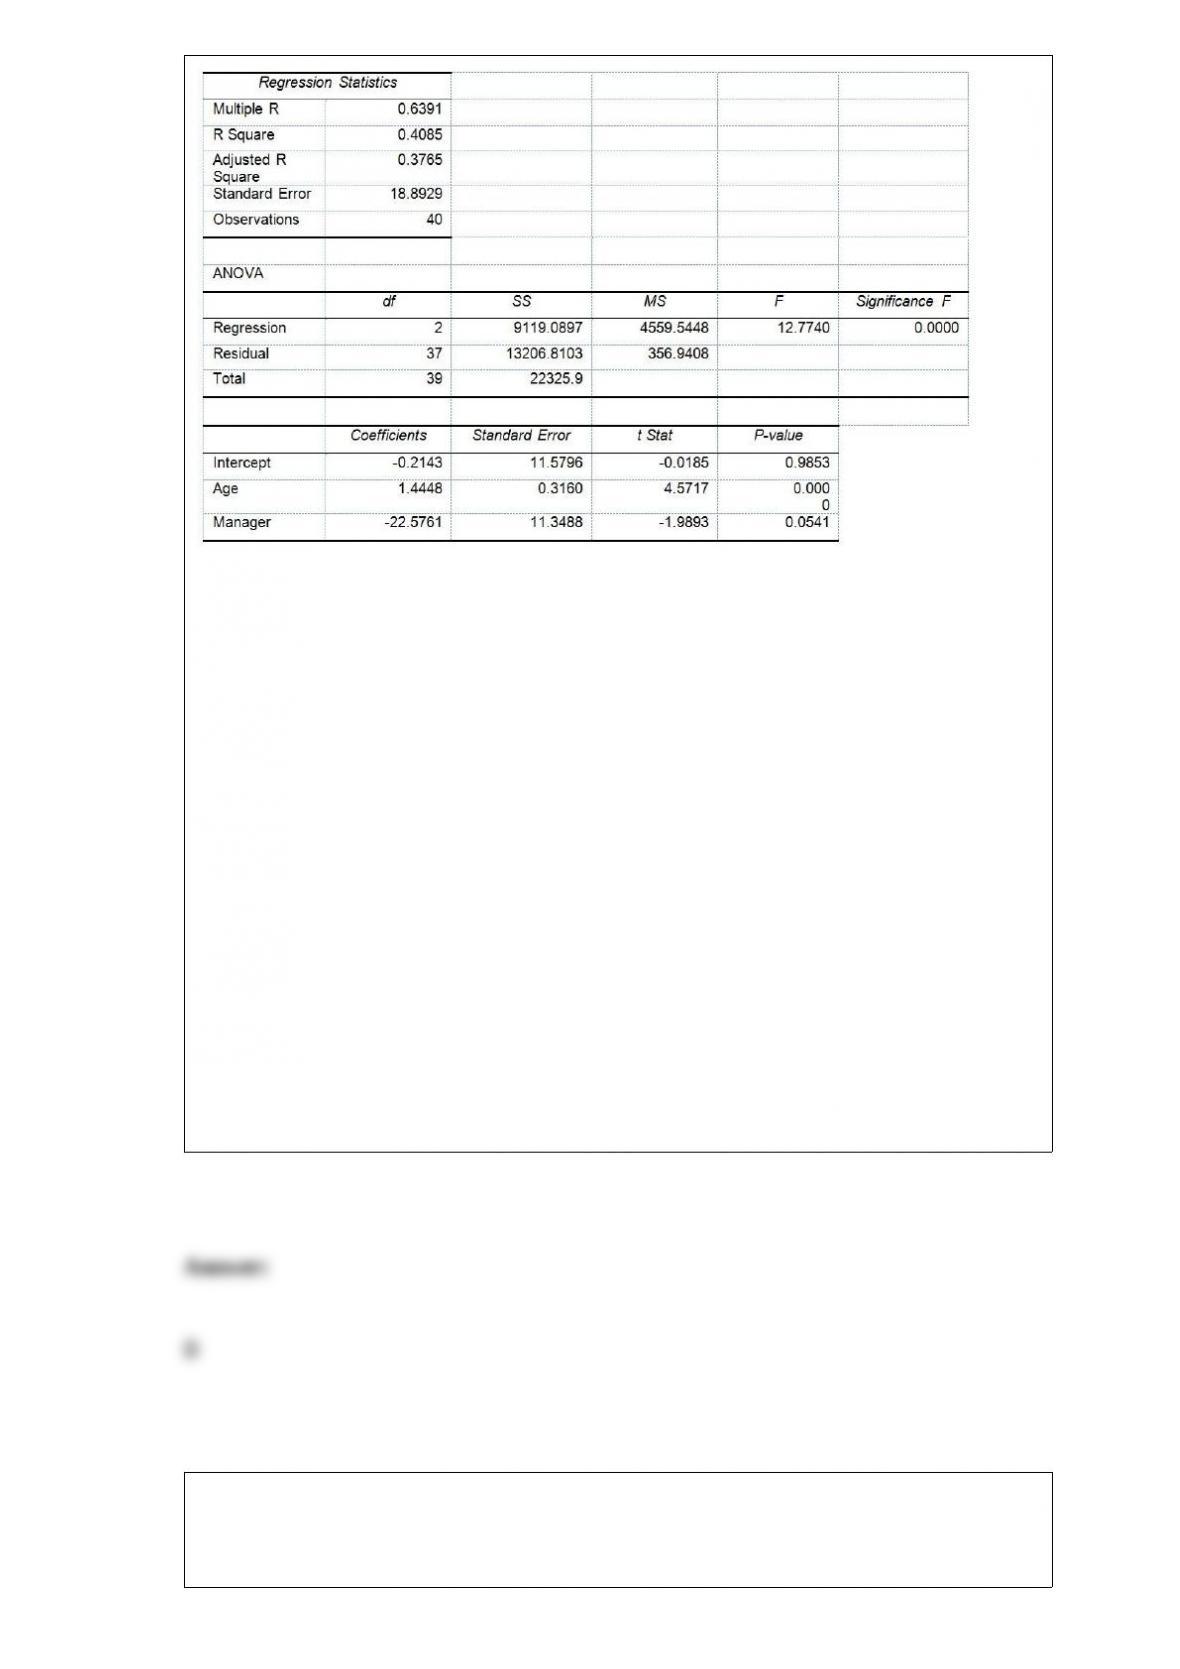
Model 2 is the regression analysis where the dependent variable is Unemploy and the
independent variables are Age and Manager. The results of the regression analysis are
given below:
Referring to Table 17-10, Model 1, the null hypothesis H0 : β1 = β2= β3 = β4 = β5 = β6
= 0 implies that the number of weeks a worker is unemployed due to a layoff is not
affected by any of the explanatory variables.
TABLE 14-11
A weight-loss clinic wants to use regression analysis to build a model
for weight loss of a client (measured in pounds). Two variables
thought to a”ect weight loss are client’s length of time on the
weight-loss program and time of session. These variables are
described below:
Y = Weight loss (in pounds)
X1 = Length of time in weight-loss program (in months)
X2 = 1 if morning session, 0 if not
Data for 25 clients on a weight-loss program at the clinic were
collected and used to ,t the interaction model:
Y = β0 + β1X1 + β2X2 + β3X1X2 + ε
Output from Microsoft Excel follows:

True or False: Referring to Table 14-11, the overall model for
predicting weight loss (Y) is statistically signi,cant at the 0.05 level.
TABLE 8-11
A poll was conducted by the marketing department of a video game company to
determine the popularity of a new game that was targeted to be launched in three
months. Telephone interviews with 1,500 young adults were conducted which revealed
that 49% said they would purchase the new game. The margin of error was 3
percentage points.
True or False: Referring to Table 8-11, the sampling error is 3%.
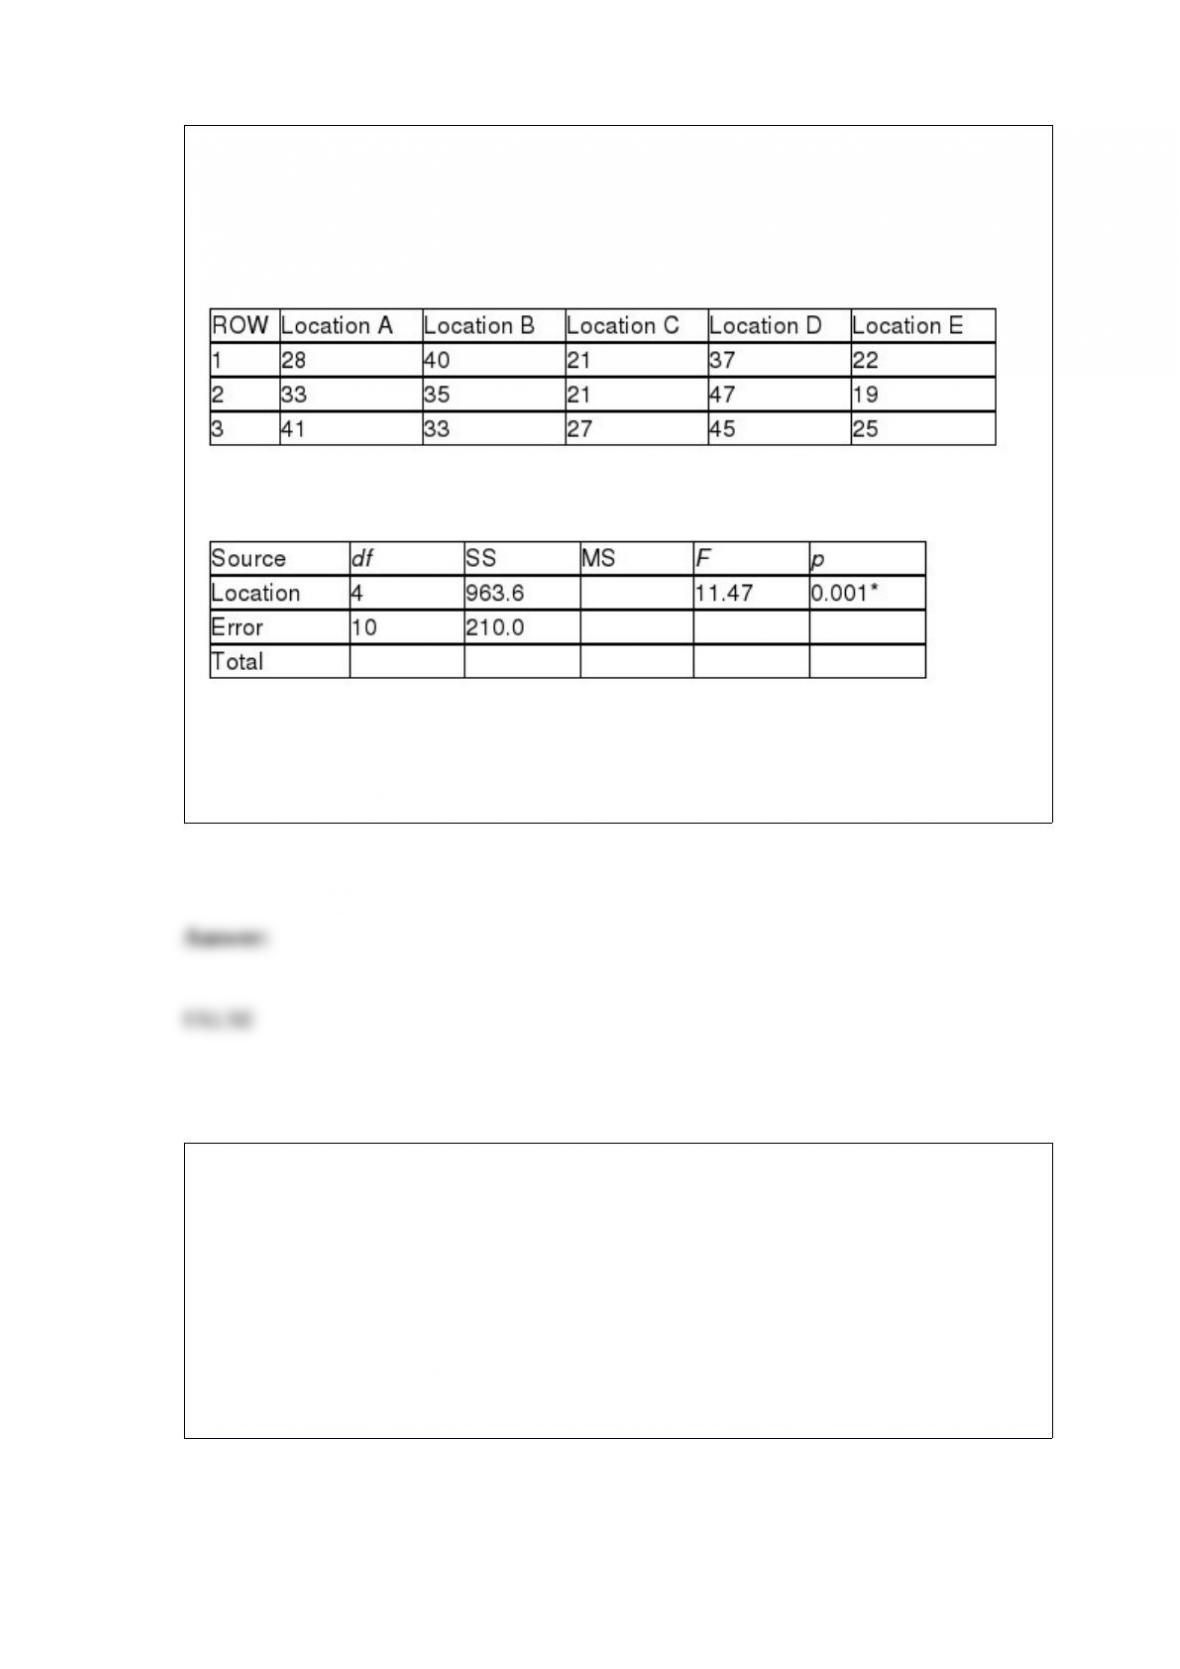
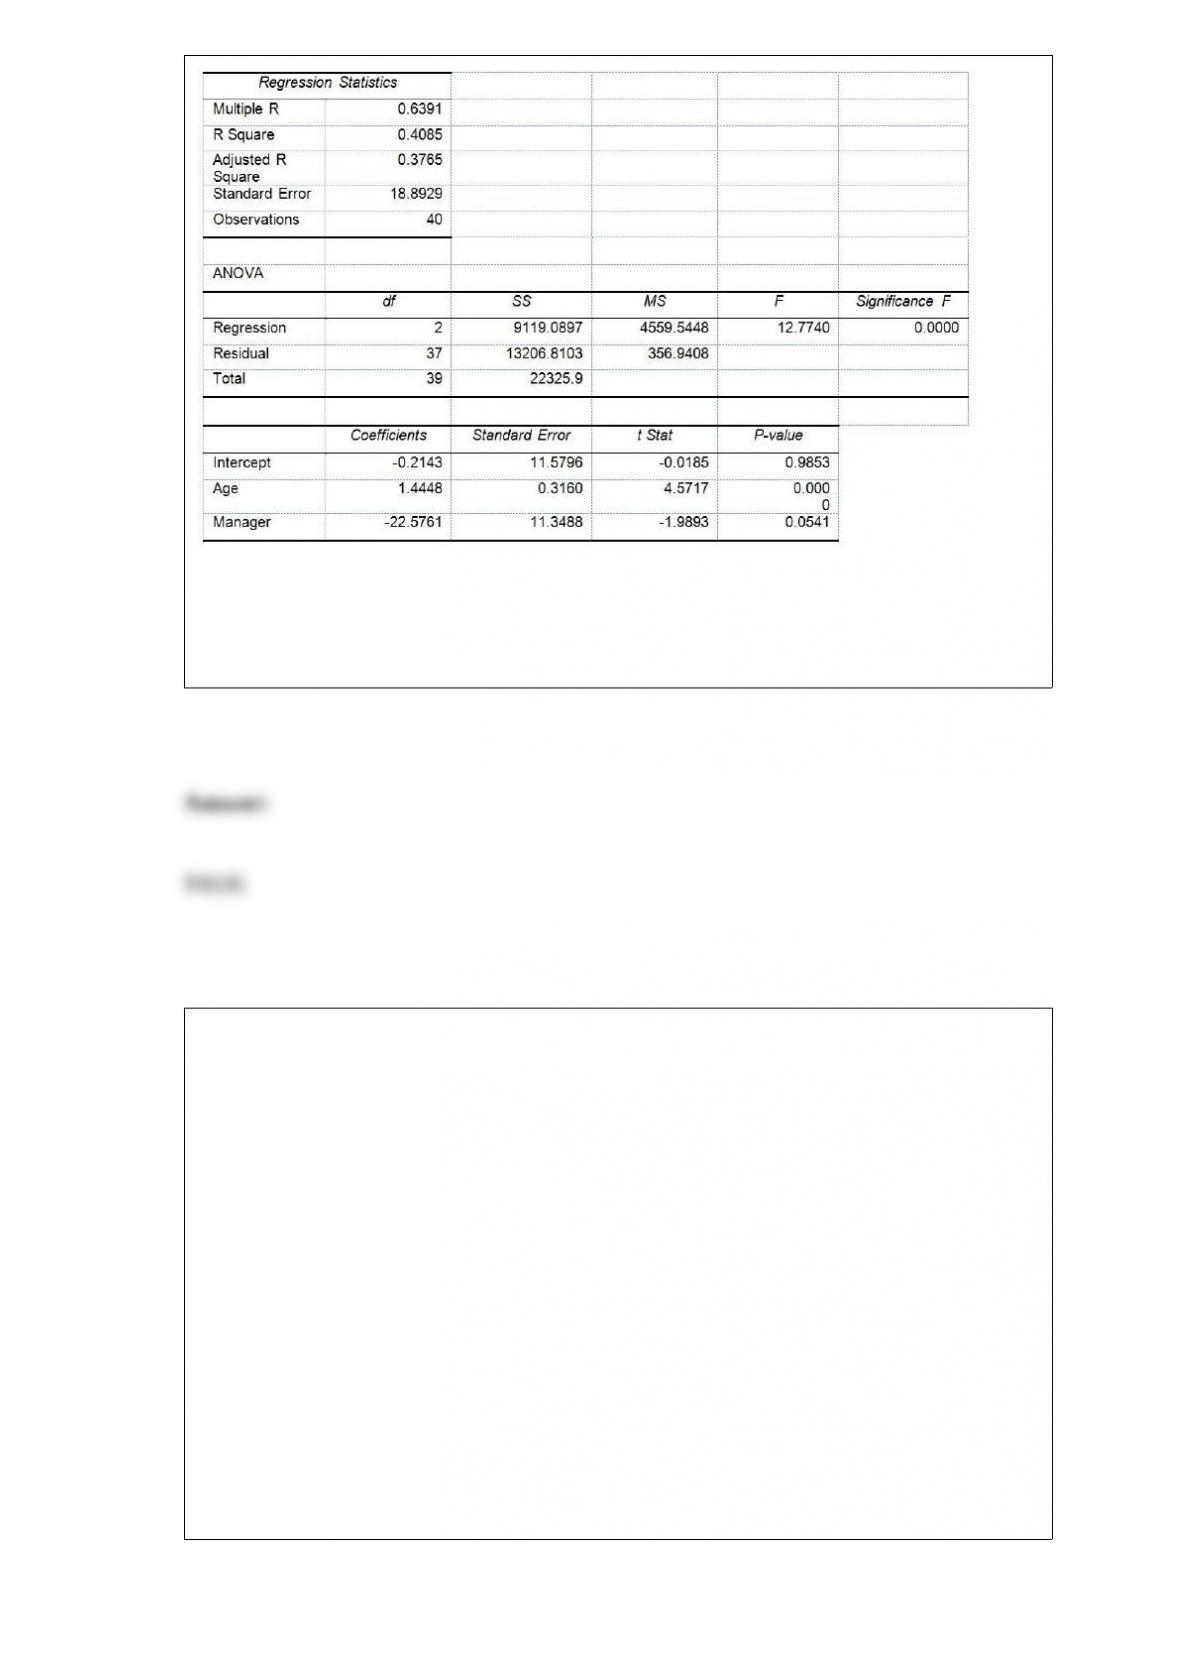
TABLE 11-5
A hotel chain has identically small sized resorts in 5 locations in different small islands.
The data that follow resulted from analyzing the hotel occupancies on randomly
selected days in the 5 locations.
Analysis of Variance
* or p < 0.005, tabular value
True or False: Referring to Table 11-5, the total mean squares is 261.90.
TABLE 14-17
Given below are results from the regression analysis where the
dependent variable is the number of weeks a worker is unemployed
due to a layo” (Unemploy) and the independent variables are the age
of the worker (Age) and a dummy variable for management position
(Manager: 1 = yes, 0 = no).
The results of the regression analysis are given below:

True or False: Referring to Table 14-17, the null hypothesis should be
rejected at a 10% level of signi,cance when testing whether age has
any e”ect on the number of weeks a worker is unemployed due to a
layo” while holding constant the e”ect of the other independent
variable.
The variation attributable to factors other than the relationship between the independent
variables and the explained variable in a regression analysis is represented by
A) regression sum of squares.
B) error sum of squares.
C) total sum of squares.
D) regression mean squares.
TABLE 12-12
Parents complain that children read too few storybooks and watch too much television
nowadays. A survey of 1,000 children reveals the following information on average
time spent watching TV and average time spent reading storybooks.
Referring to Table 12-12, if the null hypothesis of no connection between time spent
watching TV and time spent reading story books is true, how many children watching
less than 2 hours of TV and reading no more than 2 hours of story books on average can
we expect?
A) 35.69
B) 227.23
C) 262.91
D) 969.75
Private colleges and universities rely on money contributed by individuals and
corporations for their operating expenses. Much of this money is put into a fund called
an endowment, and the college spends only the interest earned by the fund. A recent
survey of 8 private colleges in the United States collected information on the
endowment amount. Based on this information, which of the following will you
construct to learn about the mean endowment of all private colleges in the United
States?
A) Confidence interval estimate for the total using the Student’s t distribution
B) Confidence interval estimate for the mean using the Student’s t distribution
C) Confidence interval estimate for the proportion using the standard normal

distribution
D) Confidence interval estimate for the difference between two means using the
standard normal distribution
Which of the following components in an ANOVA table are not additive?
A) Sum of squares
B) Degrees of freedom
C) Mean squares
D) It is not possible to tell.
TABLE 18-2
A political pollster randomly selects a sample of 100 voters each day for 8 successive
days and asks how many will vote for the incumbent. The pollster wishes to construct a
p chart to see if the percentage favoring the incumbent candidate is too erratic.
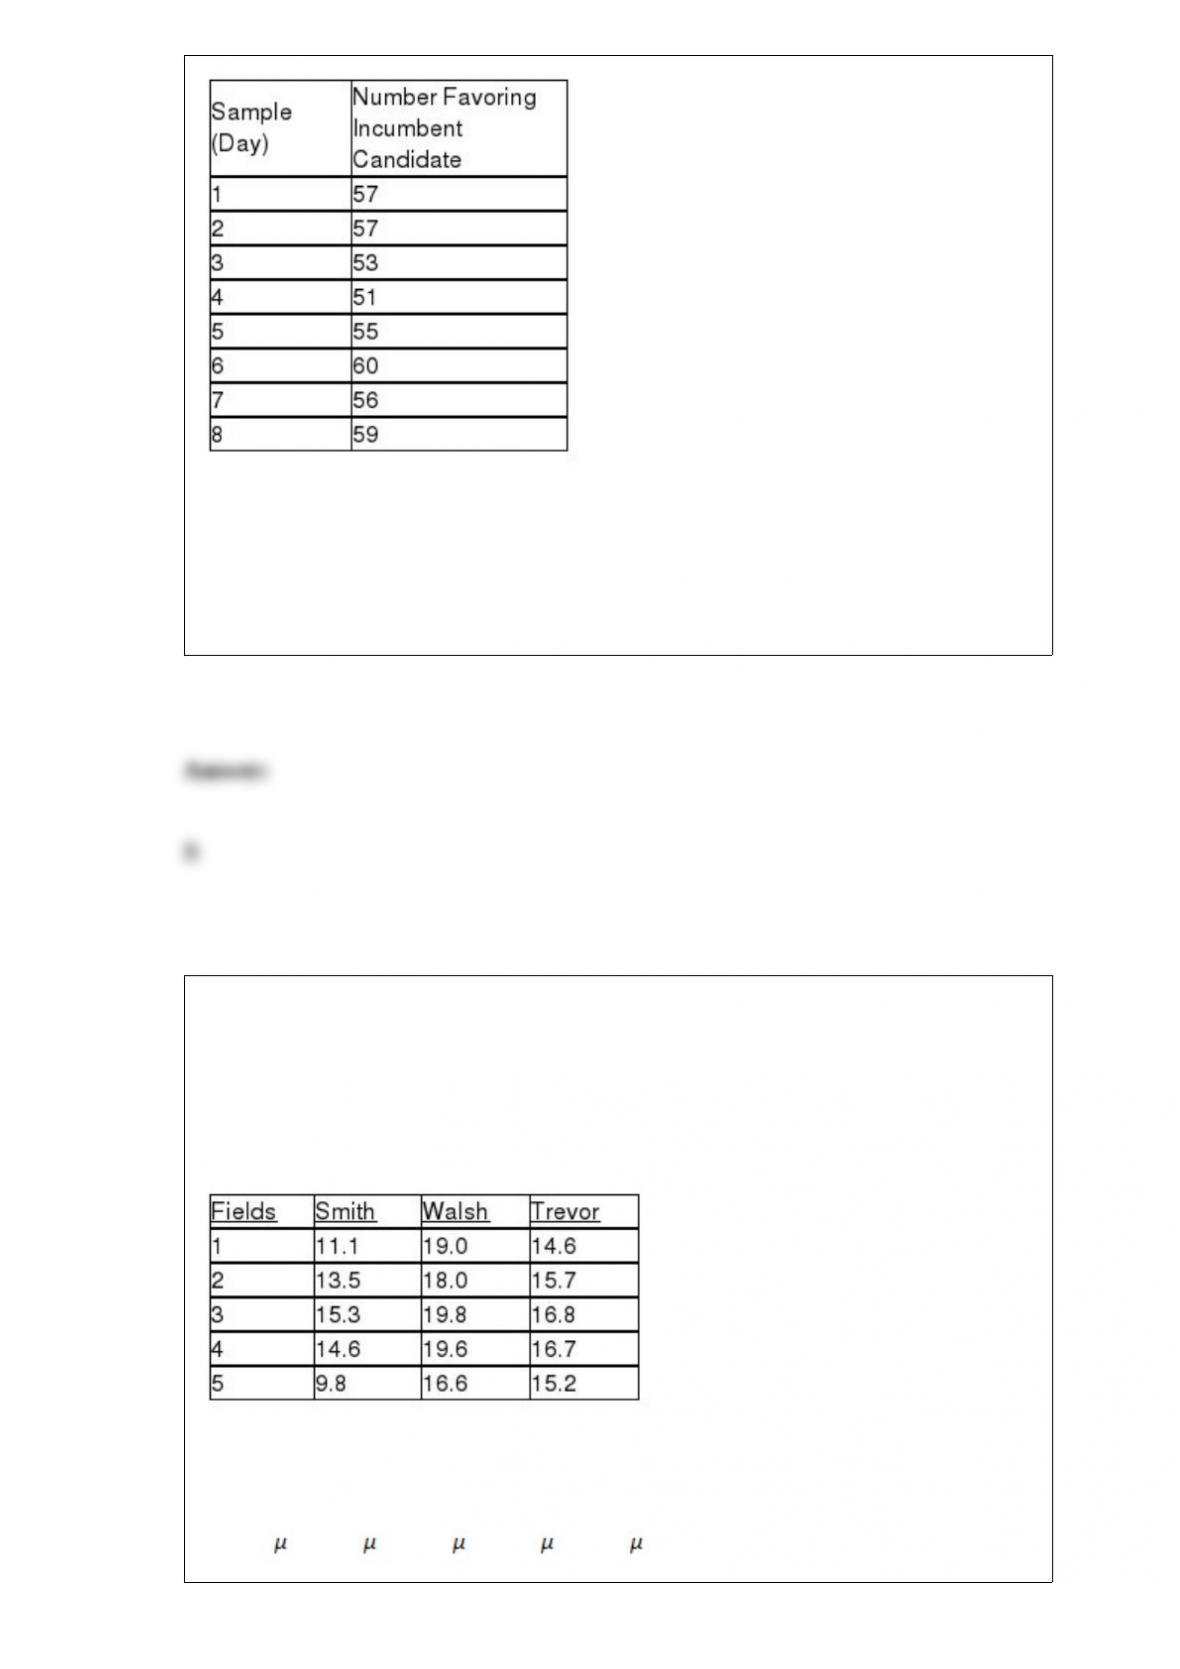
Referring to Table 18-2, what is the numerical value of the lower control limit for the p
chart?
A) 0.37
B) 0.41
C) 0.50
D) 0.71
TABLE 11-10
An agronomist wants to compare the crop yield of 3 varieties of chickpea seeds. She
plants all 3 varieties of the seeds on each of 5 different patches of fields. She then
measures the crop yield in bushels per acre. Treating this as a randomized block design,
the results are presented in the table that follows.
Referring to Table 11-10, the null hypothesis for the randomized block F test for the
difference in the means is
A) H0 : Field1 = Field2 = Field3 = Field4 = Field5
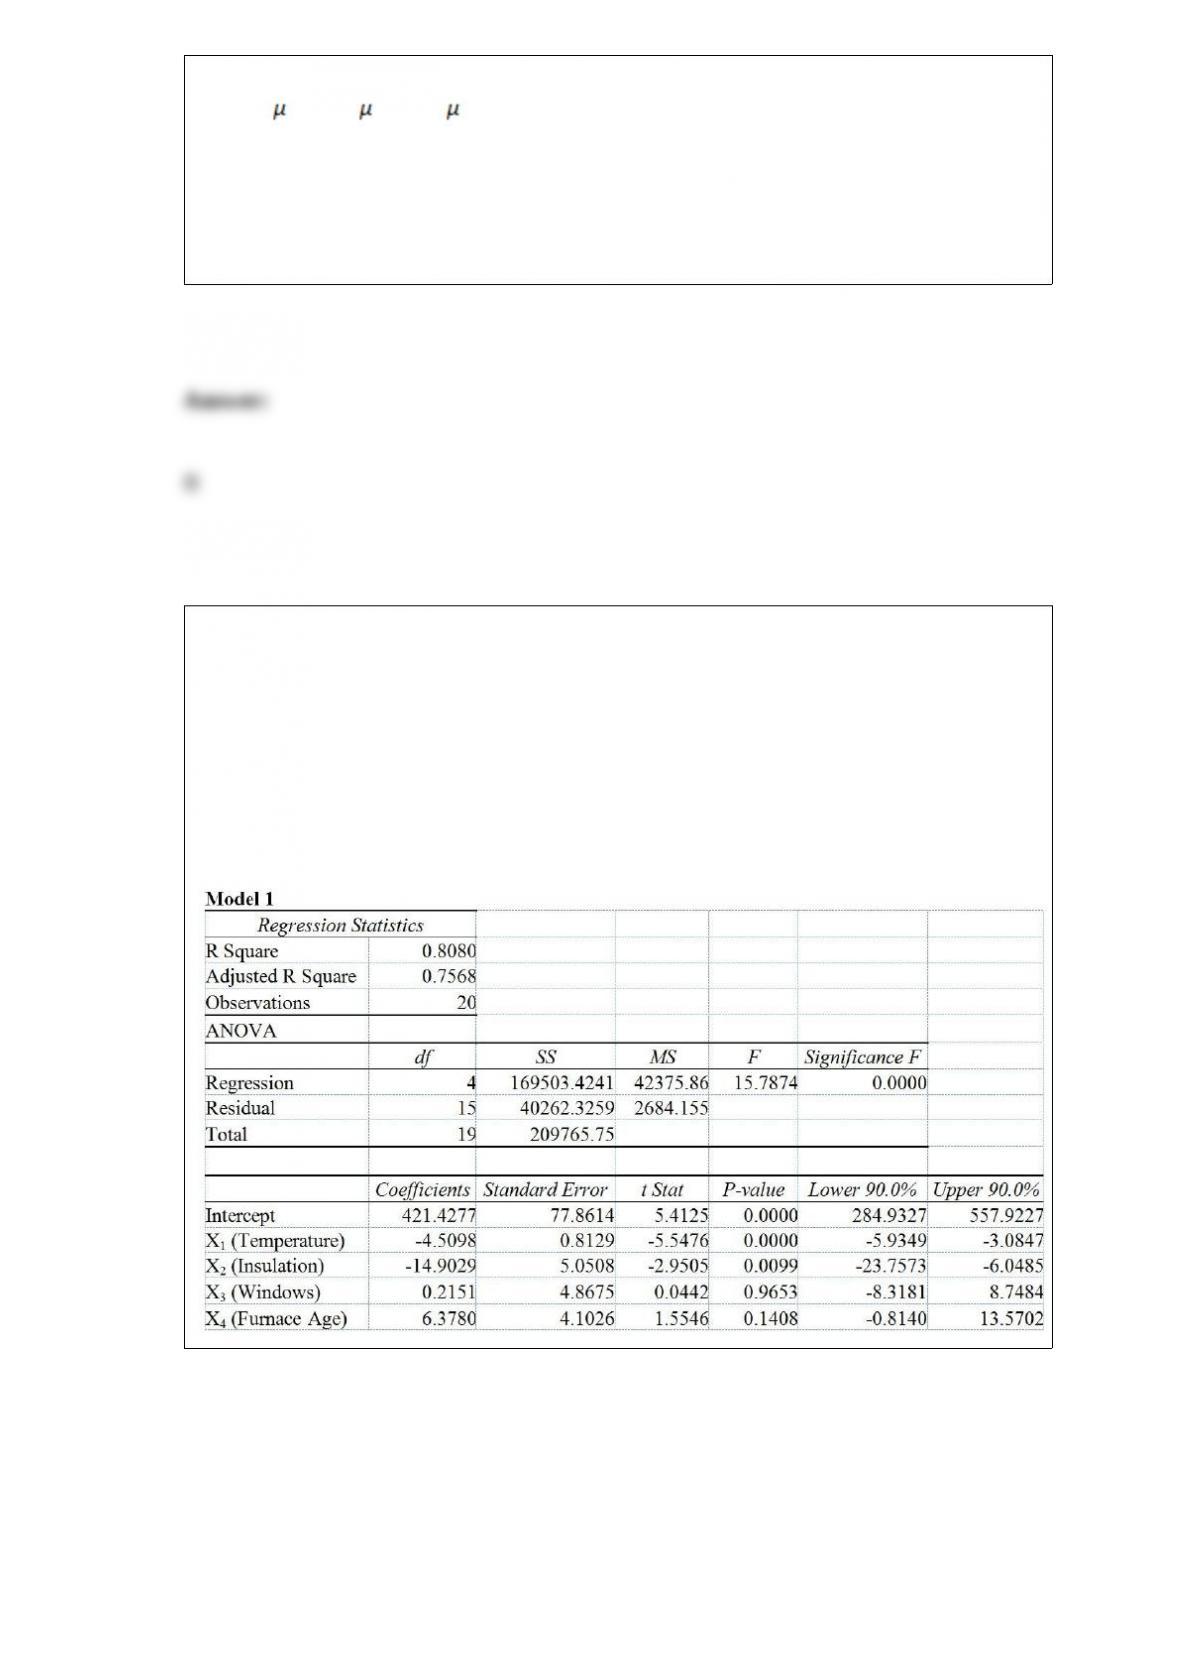
B) H0 : Smith = Walsh = Trevor
C) H0 : MField1 = MField2 = MField3 = MField4 = MField5
D) H0 : MSmith = MWalsh = MTrevor
TABLE 17-2
One of the most common questions of prospective house buyers pertains to the cost of
heating in dollars (Y). To provide its customers with information on that matter, a large
real estate firm used the following 4 variables to predict heating costs: the daily
minimum outside temperature in degrees of Fahrenheit (X1), the amount of insulation in
inches (X2), the number of windows in the house (X3), and the age of the furnace in
years (X4). Given below are the EXCEL outputs of two regression models.
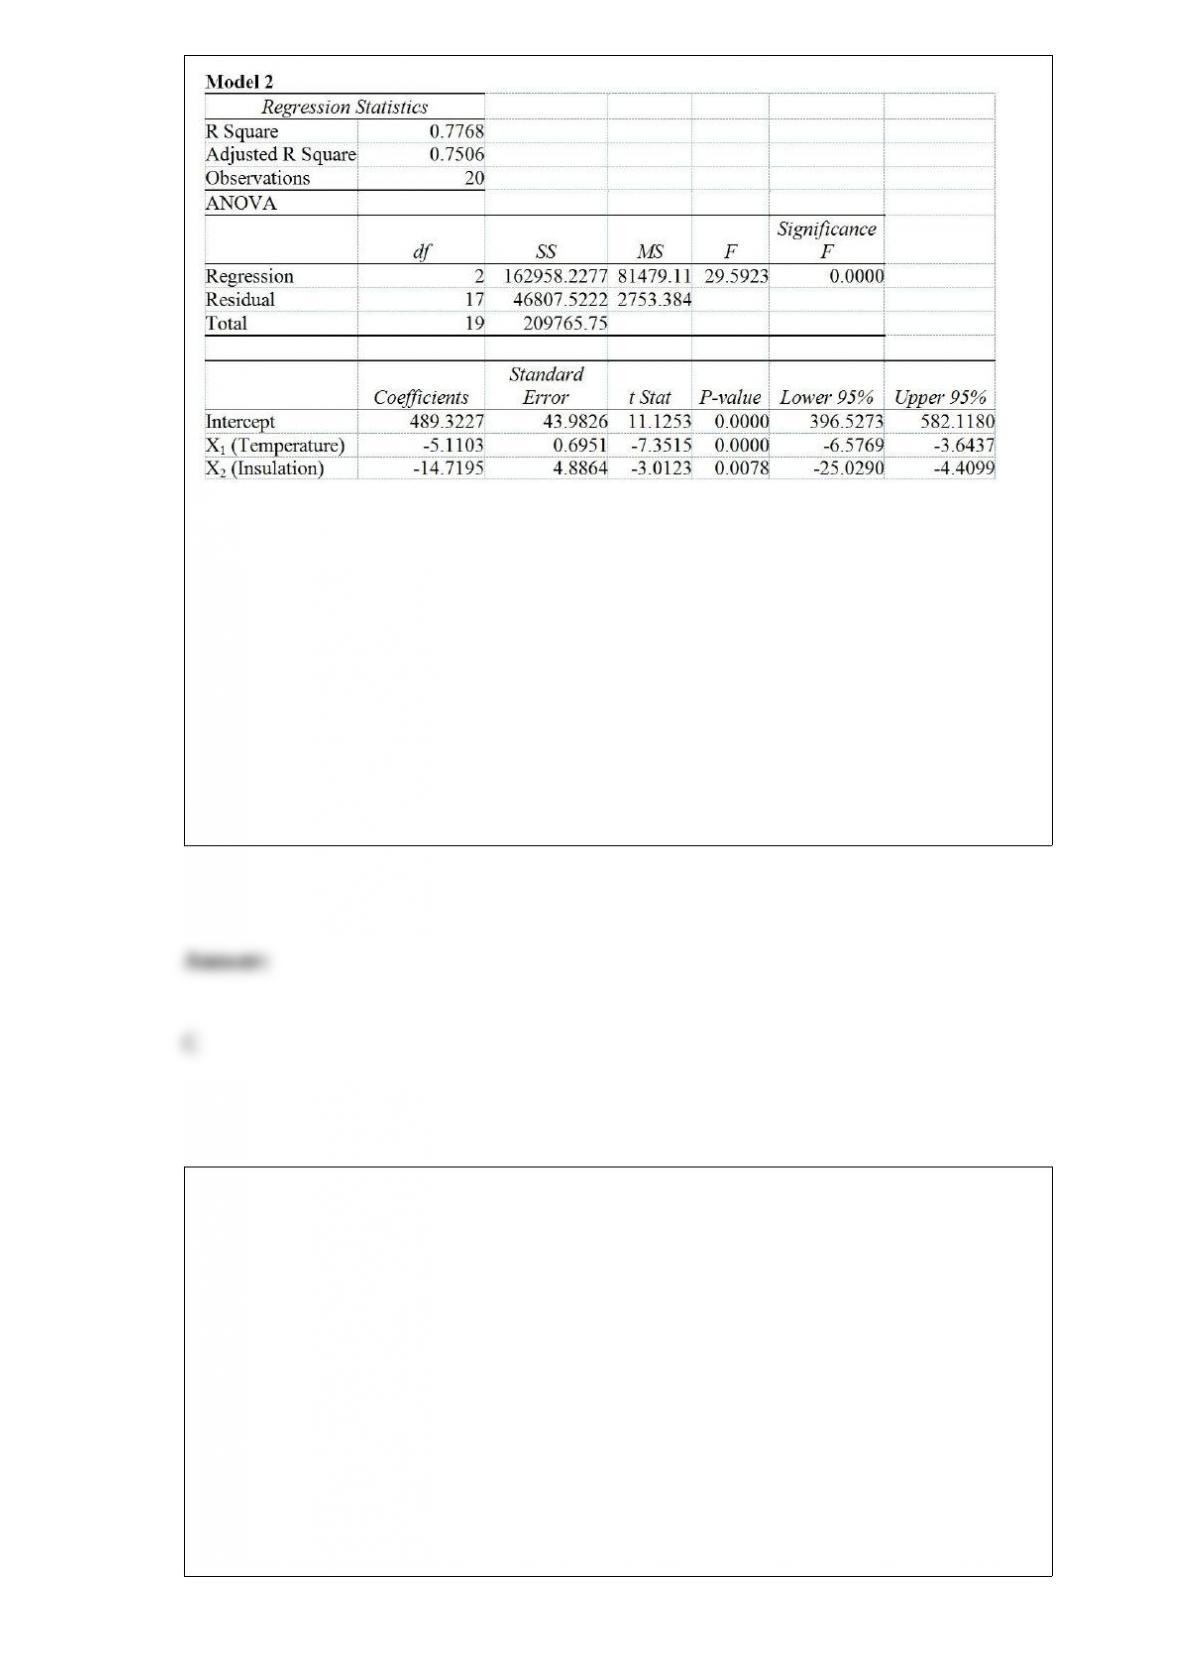
Referring to Table 17-2, what is your decision and conclusion for the test H0 : β2 = 0
vs. H1 : β2 < 0 at the α = 0.01 level of significance using Model 1?
A) Do not reject H0 and conclude that the amount of insulation has a linear effect on
heating cots.
B) Reject H0 and conclude that the amount of insulation does not have a linear effect on
heating costs.
C) Reject H0 and conclude that the amount of insulation has a negative linear effect on
heating costs.
D) Do not reject H0 and conclude that the amount of insulation has a negative linear
effect on heating costs.
The probability that a new advertising campaign will increase sales is assessed as being
0.80. The probability that the cost of developing the new ad campaign can be kept
within the original budget allocation is 0.40. Assuming that the two events are
independent, the probability that the cost is kept within budget and the campaign will
increase sales is
A) 0.20.
B) 0.32.
C) 0.40.
D) 0.88.
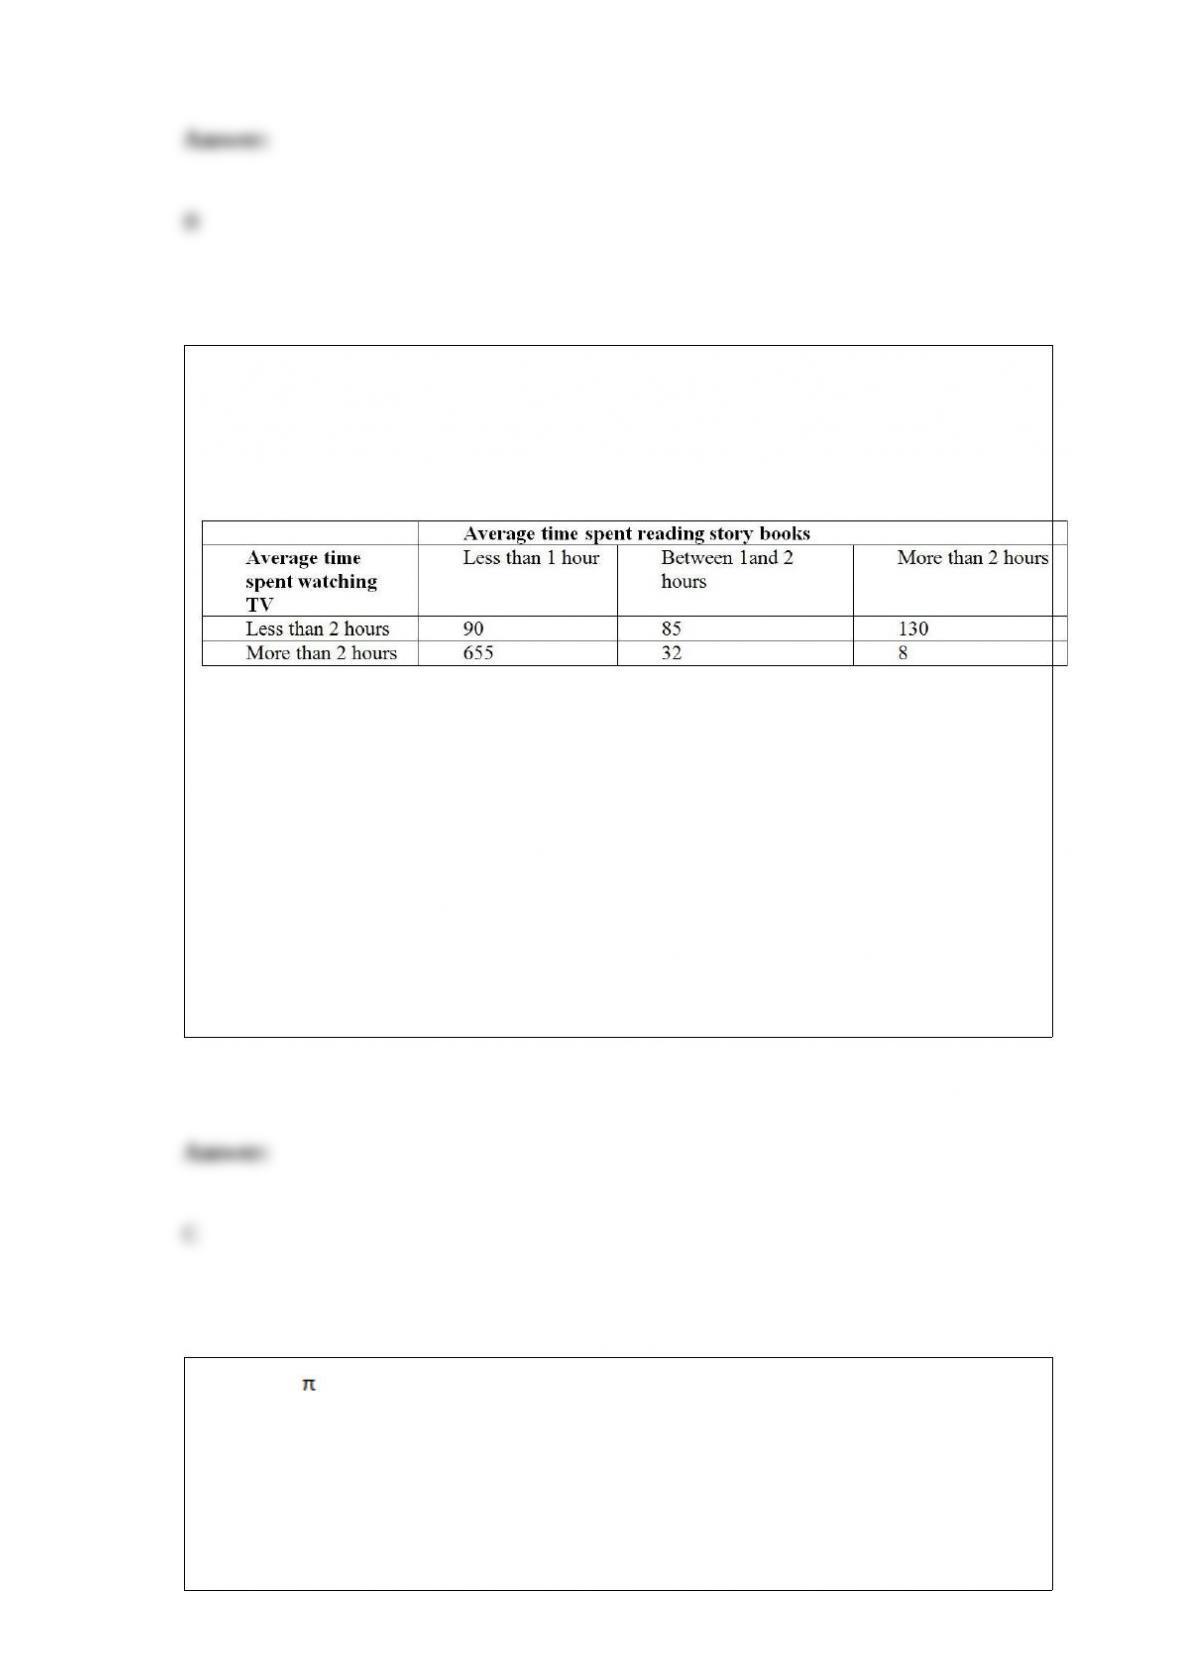
TABLE 12-12
Parents complain that children read too few storybooks and watch too much television
nowadays. A survey of 1,000 children reveals the following information on average
time spent watching TV and average time spent reading storybooks.
Referring to Table 12-12, to test whether there is any relationship between average time
spent watching TV and average time spent reading story books, the value of the
measured test statistic is
A) -12.59.
B) 1.61.
C) 481.49.
D) 1,368.06.
Whenever = 0.1 and n is small, the binomial distribution will be
A) symmetric.
B) right-skewed.
C) left-skewed.

D) None of the above.
TABLE 1-2
A Wall Street Journal poll asked 2,150 adults in the United States a series of questions
to find out their view on the U.S. economy.
Referring to Table 1-2, the possible responses to the question “In which year do you
think the last recession in the United States started?” are values from a
A) discrete numerical variable.
B) continuous numerical variable.
C) categorical variable.
D) table of random numbers.
The ________ curve represents the expected monetary value approach.
A) risk averter’s
B) risk taker’s
C) risk neutral
D) Bernoulli
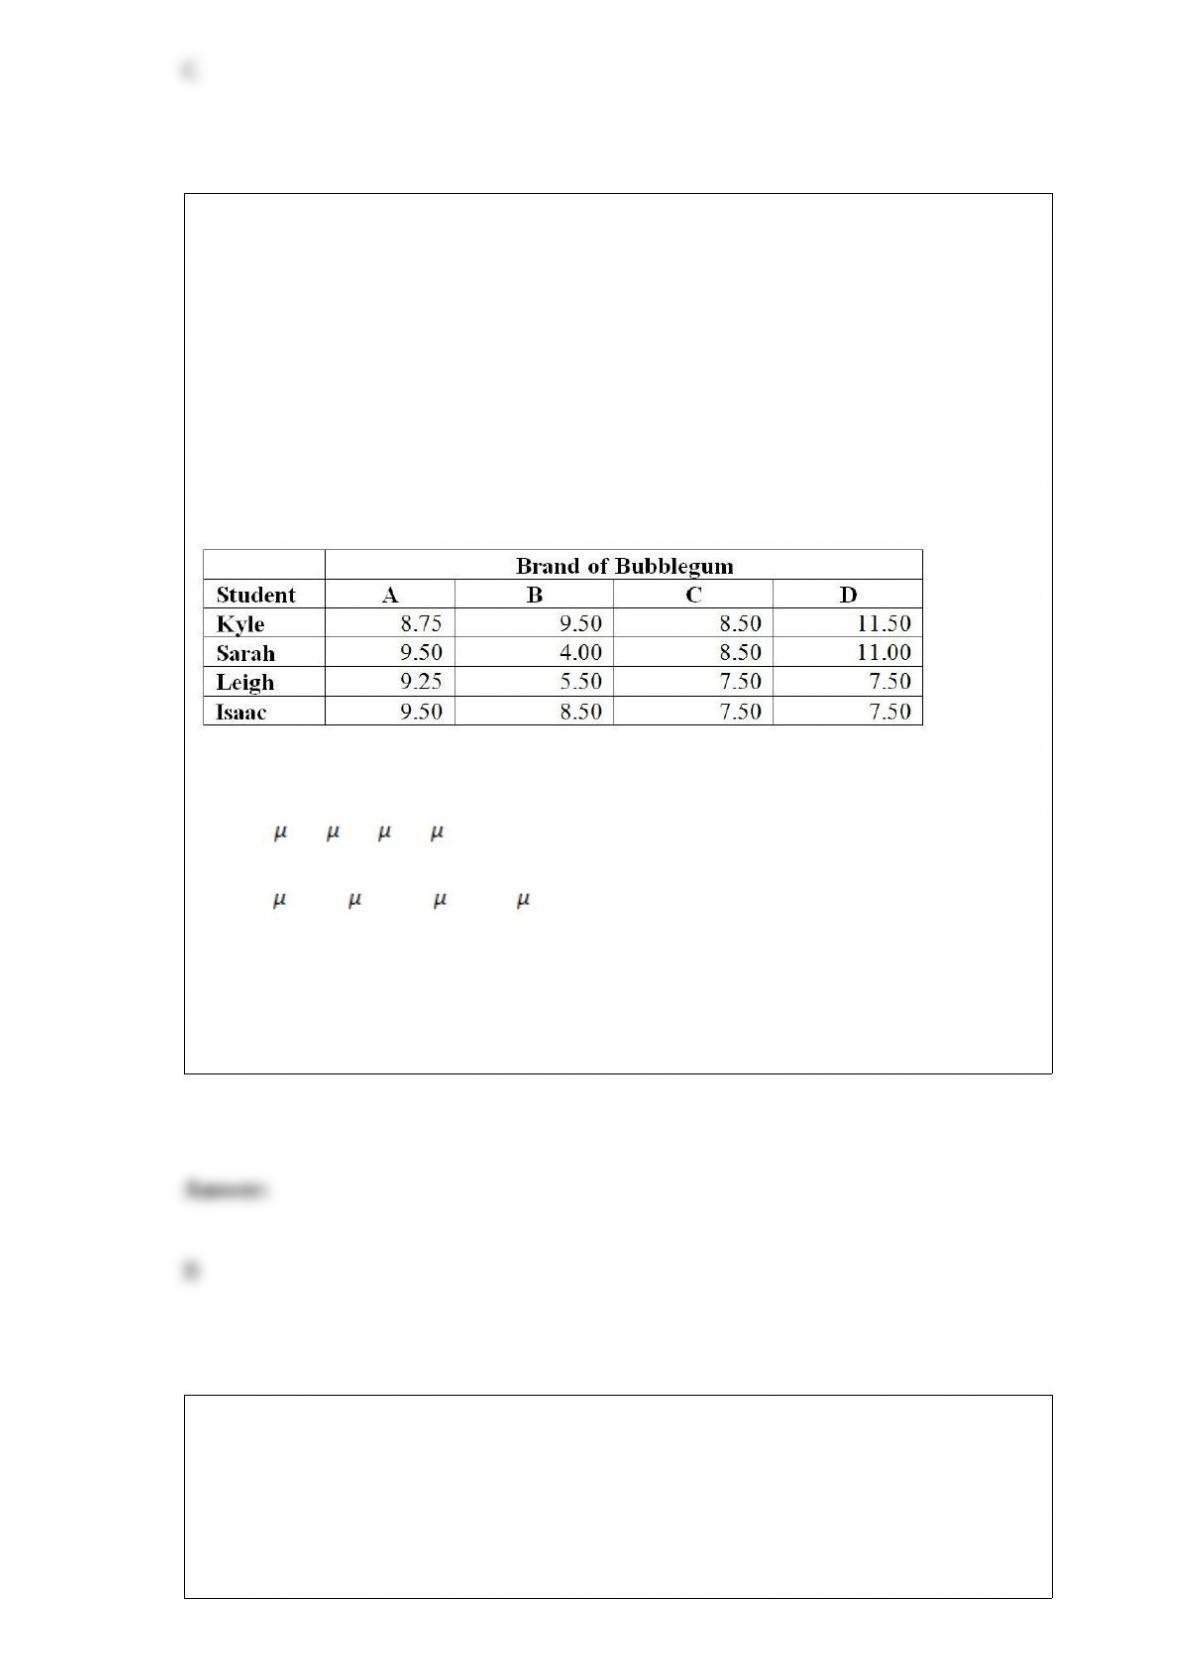
TABLE 11-11
A student team in a business statistics course designed an experiment to investigate
whether the brand of bubblegum used affected the size of bubbles they could blow. To
reduce the person-to-person variability, the students decided to use a randomized block
design using themselves as blocks.
Four brands of bubblegum were tested. A student chewed two pieces of a brand of gum
and then blew a bubble, attempting to make it as big as possible. Another student
measured the diameter of the bubble at its biggest point. The following table gives the
diameters of the bubbles (in inches) for the 16 observations.
Referring to Table 11-11, what is the null hypothesis for testing the block effects?
A) H0 : A = B = C = D
B) H0 : Kyle = Sarah = Leigh = Isaac
C) H0 : MA = MB = MC = MD
D) H0 : MKyle = MSarah = MLeigh = MIsaac
An entrepreneur is considering the purchase of a coin-operated laundry. The current
owner claims that over the past 5 years, the mean daily revenue was $675 with a
population standard deviation of $75. A sample of 30 days reveals a daily mean revenue
of $625. If you were to test the null hypothesis that the daily mean revenue was $675
and decide not to reject the null hypothesis, what can you conclude?

A) There is not enough evidence to conclude that the daily mean revenue was $675.
B) There is not enough evidence to conclude that the daily mean revenue was not $675.
C) There is enough evidence to conclude that the daily mean revenue was $675.
D) There is enough evidence to conclude that the daily mean revenue was not $675.
Referring to Table 14-15, which of the following is the correct
alternative hypothesis to test whether mean teacher salary has any
e”ect on percentage of students passing the pro,ciency test, taking
into account the e”ect of instructional spending per pupil?
TABLE 14-15
The superintendent of a school district wanted to predict the
percentage of students passing a sixth-grade pro,ciency test. She
obtained the data on percentage of students passing the pro,ciency
test (% Passing), mean teacher salary in thousands of dollars
(Salaries), and instructional spending per pupil in thousands of dollars
(Spending) of 47 schools in the state.
Following is the multiple regression output with Y = % Passing as the
dependent variable, X1 = Salaries and X2 = Spending:

A) H1 : β0 ≠0
B) H1 : β1 ≠0
C) H1 : β2 ≠0
D) H1 : β3 ≠0
TABLE 12-12
Parents complain that children read too few storybooks and watch too much television
nowadays. A survey of 1,000 children reveals the following information on average
time spent watching TV and average time spent reading storybooks.
Referring to Table 12-12, suppose we want to constrain the probability of committing a

Type I error to 5% when testing whether there is any relationship between average time
spent watching TV and average time spent reading story books, the critical value will be
A) 5.991.
B) 7.378.
C) 12.592.
D) 14.449.
To gather information on the preferences of instructors at universities on topics for a
business statistics textbook that it will publish, a publishing company invited 10 faculty
members who have adopted one of the textbooks that it has published. This is an
example of a
A) systematic sample.
B) judgment sample.
C) simple random sample.
D) stratified sample.
A survey of 150 executives were asked what they think is the most common mistake
candidates make during job interviews. Six different mistakes were given. Which of the
following is the best for presenting the information?
A) a bar chart.
B) a histogram
C) a stem-and-leaf display
D) a contingency table
TABLE 17-10
Given below are results from the regression analysis where the dependent variable is
the number of weeks a worker is unemployed due to a layoff (Unemploy) and the
independent variables are the age of the worker (Age), the number of years of education
received (Edu), the number of years at the previous job (Job Yr), a dummy variable for
marital status (Married: 1 = married, 0 = otherwise), a dummy variable for head of
household (Head: 1 = yes, 0 = no) and a dummy variable for management position
(Manager: 1 = yes, 0 = no). We shall call this Model 1. The coefficient of partial
determination ( ) of each of the 6 predictors are, respectively,
0.2807, 0.0386, 0.0317, 0.0141, 0.0958, and 0.1201.
Model 2 is the regression analysis where the dependent variable is Unemploy and the
independent variables are Age and Manager. The results of the regression analysis are
given below:
Referring to Table 17-10, Model 1, which of the following is a correct statement?
A) 40.30% of the total variation in the number of weeks a worker is unemployed due to
a layoff can be explained by the age of the worker, the number of years of education
received, the number of years at the previous job, marital status, whether the worker is
the head of household and whether the worker is a manager.
B) 40.30% of the total variation in the number of weeks a worker is unemployed due to
a layoff can be explained by the age of the worker, the number of years of education
received, the number of years at the previous job, marital status, whether the worker is
the head of household and whether the worker is a manager after adjusting for the
number of predictors and sample size.
C) 40.30% of the total variation in the number of weeks a worker is unemployed due to
a layoff can be explained by the age of the worker, the number of years of education
received, the number of years at the previous job, marital status, whether the worker is
the head of household and whether the worker is a manager after adjusting for the level
of significance.
D) 40.30% of the total variation in the number of weeks a worker is unemployed due to
a layoff can be explained by the age of the worker, the number of years of education
received, the number of years at the previous job, marital status, whether the worker is
the head of household and whether the worker is a manager holding constant the effect
of all the independent variables.
TABLE 16-12
A local store developed a multiplicative time-series model to forecast its revenues in
future quarters, using quarterly data on its revenues during the 5-year period from 2008
to 2012. The following is the resulting regression equation:
log10 = 6.102 + 0.012 X – 0.129 1 – 0.054 2 + 0.098 3
where is the estimated number of contracts in a quarter
X is the coded quarterly value with X = 0 in the first quarter of 2008
1 is a dummy variable equal to 1 in the first quarter of a year and 0 otherwise
2 is a dummy variable equal to 1 in the second quarter of a year and 0 otherwise
is a dummy variable equal to 1 in the third quarter of a year and 0 otherwise
Referring to Table 16-12, in testing the significance of the coefficient for Q1 in the
regression equation (-0.129) which has a p-value of 0.492. Which of the following is
the best interpretation of this result?
A) The revenues in the first quarter of the year are significantly different from the
revenues in an average quarter ( = 0.05).
B) The revenues in the first quarter of the year are not significantly different from the
revenues in an average quarter ( = 0.05).
C) The revenues in the first quarter of the year are significantly different from the
revenues in the fourth quarter ( = 0.05).
D) The revenues in the first quarter of the year are not significantly different from the
revenues in the fourth quarter ( = 0.05).
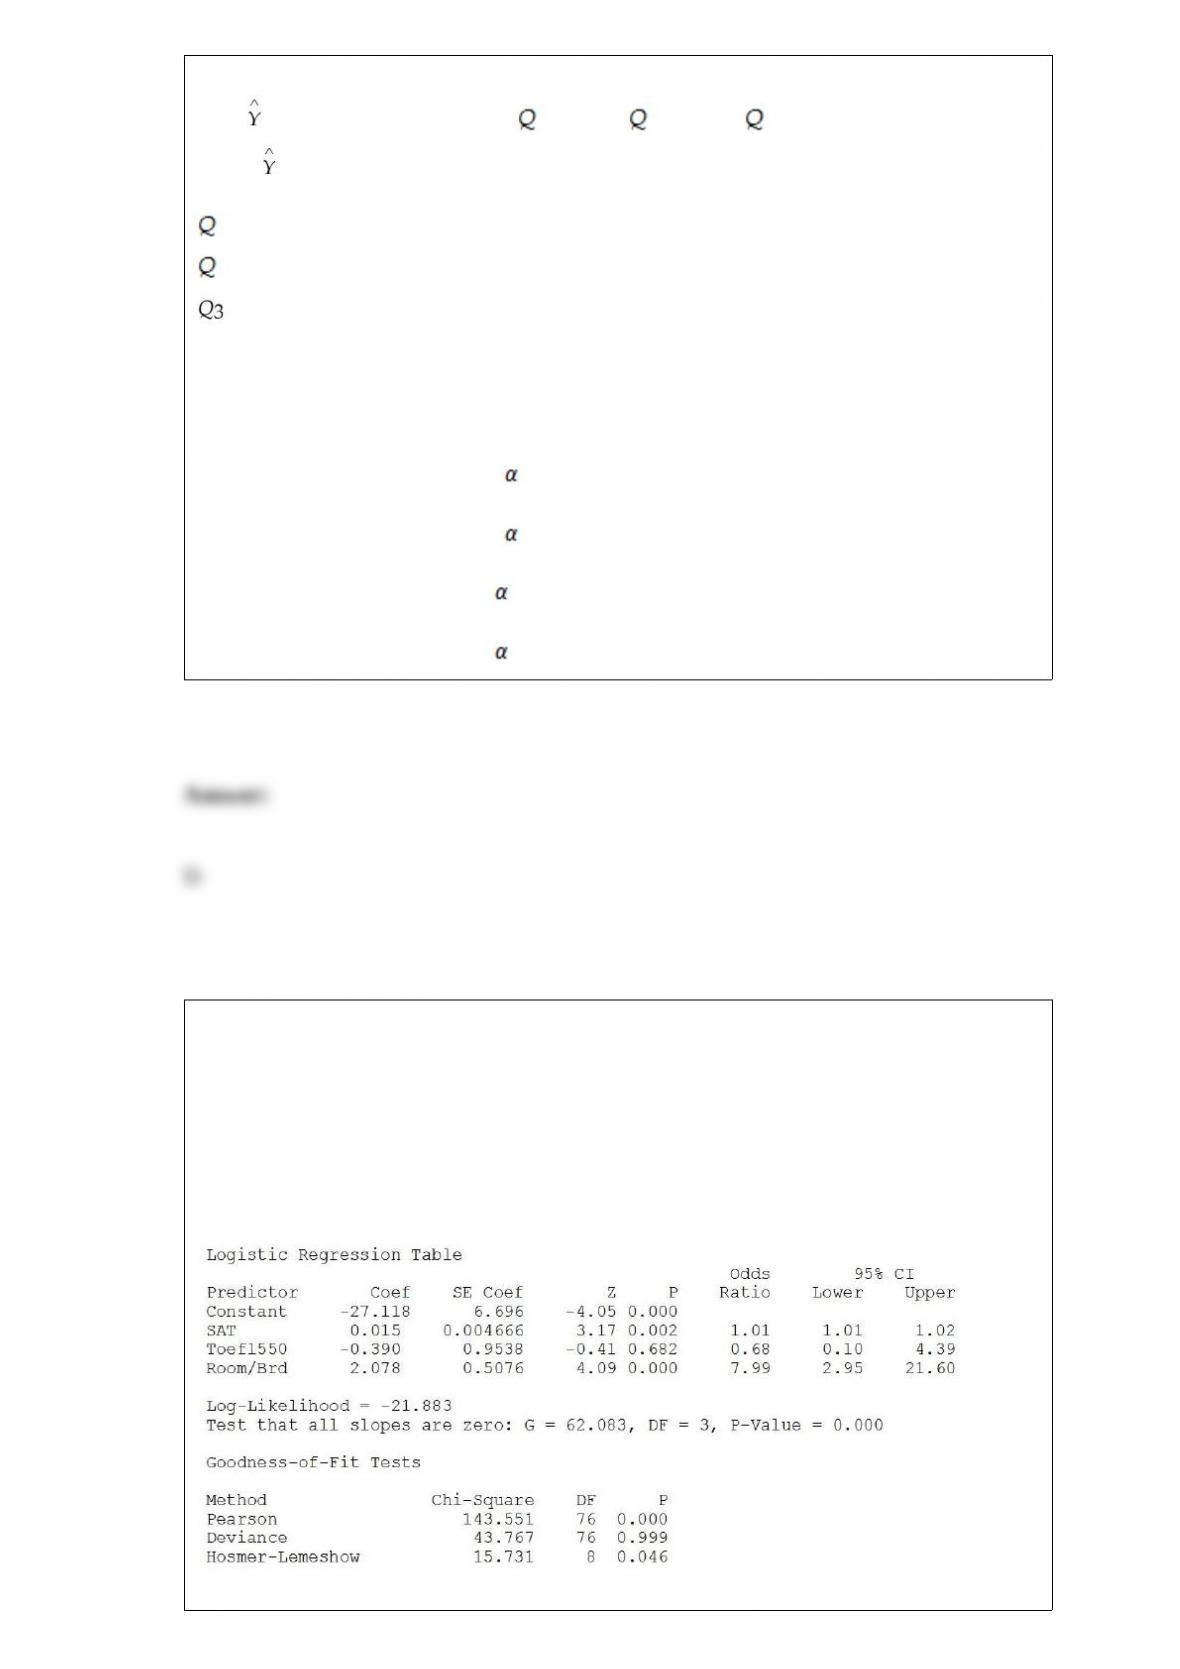
TABLE 17-11
A logistic regression model was estimated in order to predict the probability that a
randomly chosen university or college would be a private university using information
on mean total Scholastic Aptitude Test score (SAT) at the university or college, the
room and board expense measured in thousands of dollars (Room/Brd), and whether the
TOEFL criterion is at least 550 (Toefl550 = 1 if yes, 0 otherwise.) The dependent
variable, Y, is school type (Type = 1 if private and 0 otherwise).
Referring to Table 17-11, what should be the decision (‘reject’ or ‘do not reject’) on the

null hypothesis when testing whether Toefl500 makes a significant contribution to the
model in the presence of the other independent variables at a 0.05 level of significance?
The interval between patients arriving at an outpatient clinic follows an exponential
distribution at a rate of 1 patient per hour. What is the probability of that randomly
chosen arrival interval will be more than 1 hour?
TABLE 13-4
The managers of a brokerage firm are interested in finding out if the number of new
clients a broker brings into the firm affects the sales generated by the broker. They
sample 12 brokers and determine the number of new clients they have enrolled in the
last year and their sales amounts in thousands of dollars. These data are presented in the
table that follows.
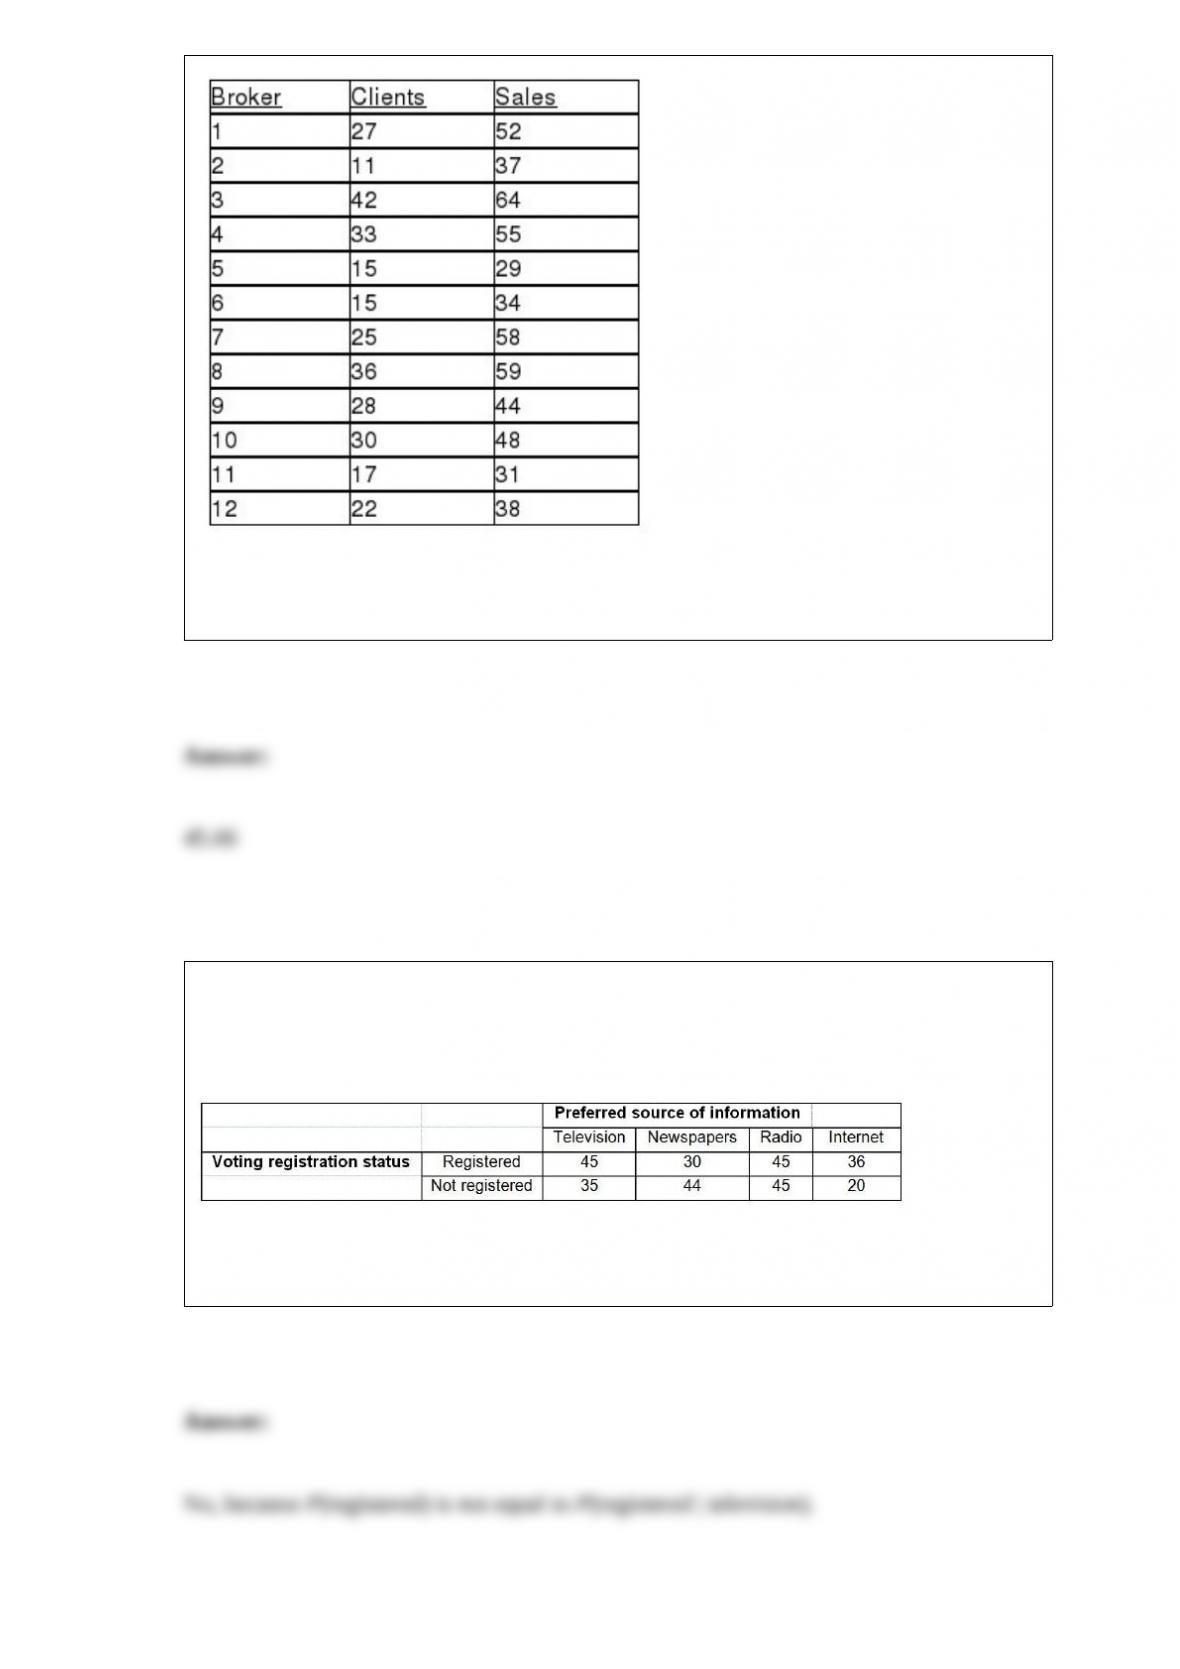
Referring to Table 13-4, the prediction for the amount of sales (in $1,000s) for a person
who brings 25 new clients into the firm is ________.
TABLE 4-11
A sample of 300 adults is selected. The contingency table below shows their registration
status and their preferred source of information on current events.
Referring to Table 4-11, is the preferred source of current information independent of
the voting registration status?
The interval between patients arriving at an outpatient clinic follows an exponential
distribution at a rate of 1 patient per hour. What is the probability that a randomly
chosen arrival interval will be more than 2.5 hours?
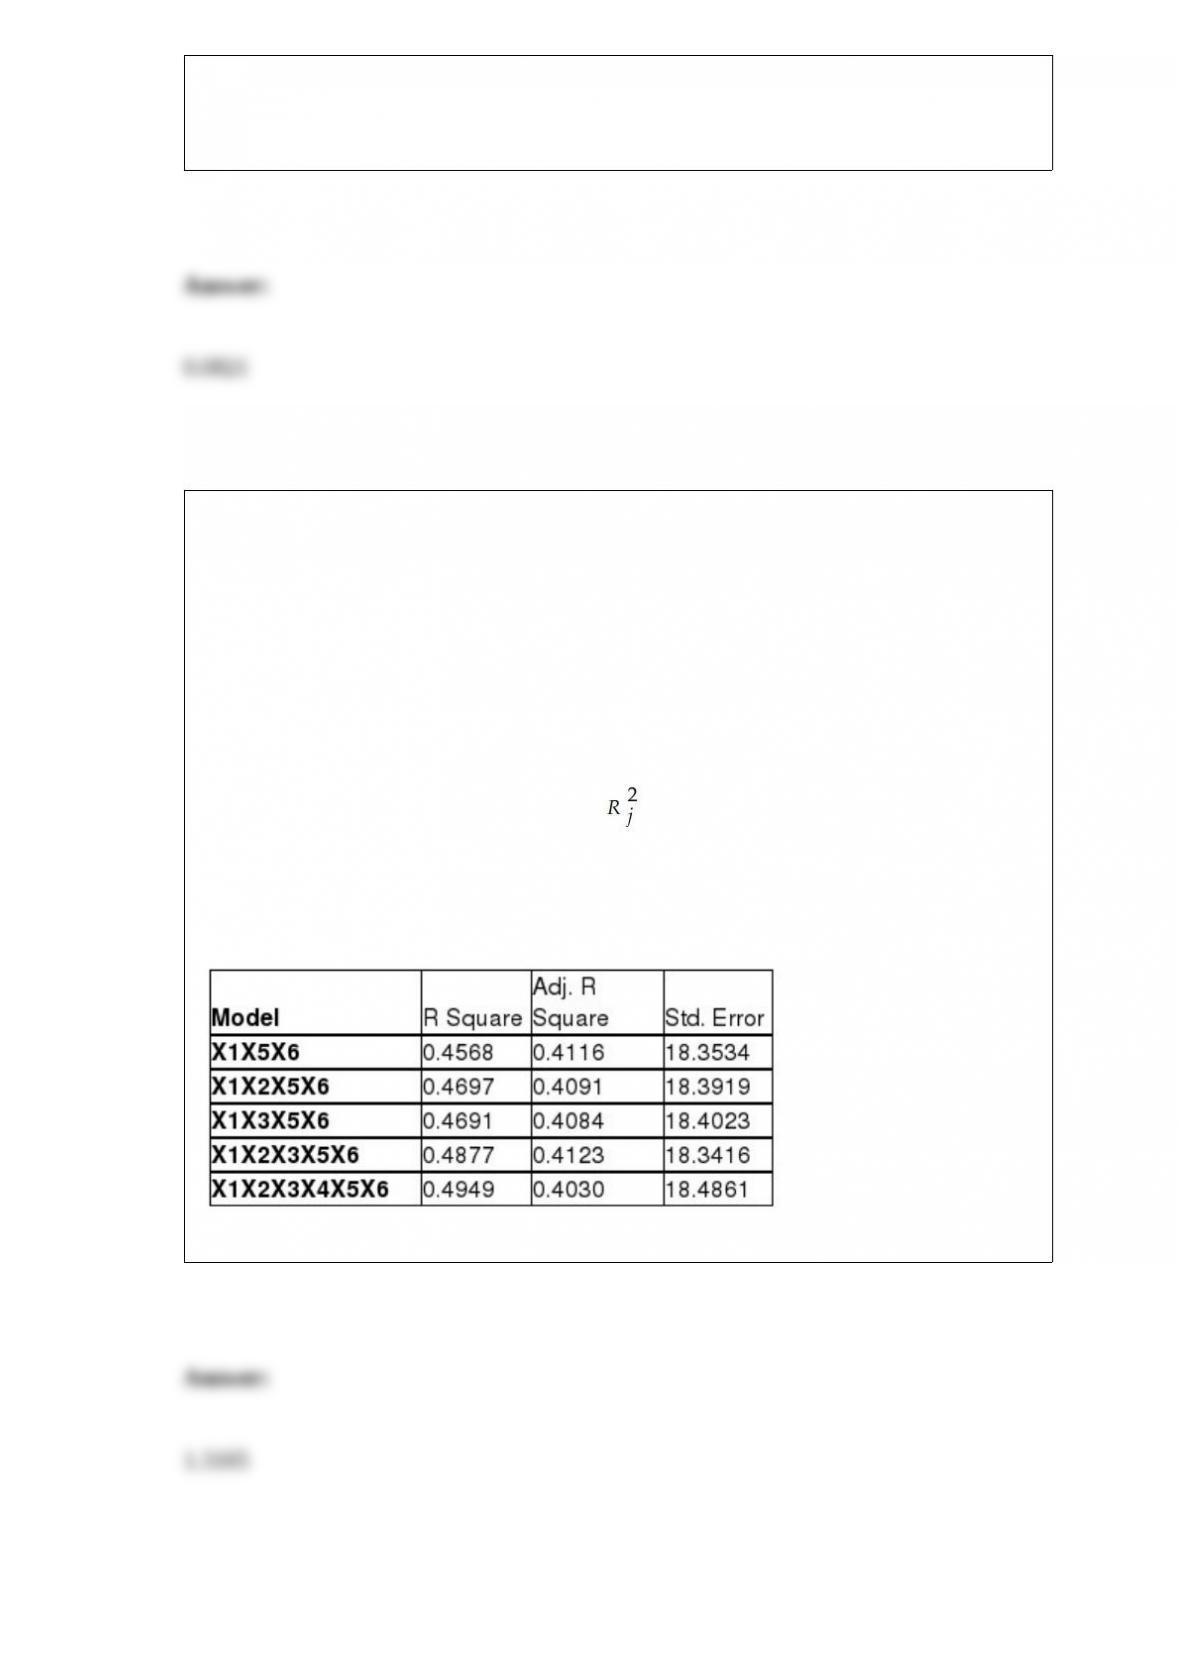
TABLE 15-6
Given below are results from the regression analysis on 40 observations where the
dependent variable is the number of weeks a worker is unemployed due to a layoff (Y)
and the independent variables are the age of the worker (X1), the number of years of
education received (X2), the number of years at the previous job (X3), a dummy variable
for marital status (X4: 1 = married, 0 = otherwise), a dummy variable for head of
household (X5: 1 = yes, 0 = no) and a dummy variable for management position (X6: 1
= yes, 0 = no).
The coefficient of multiple determination ( ) for the regression model using each of
the 6 variables Xj as the dependent variable and all other X variables as independent
variables are, respectively, 0.2628, 0.1240, 0.2404, 0.3510, 0.3342 and 0.0993.
The partial results from best-subset regression are given below:
Referring to Table 15-6, what is the value of the variance inflationary factor of Job Yr?

TABLE 7-5
According to an article, 19% of the entire population in a developing country has
high-speed access to the Internet. Random sample sizes of 200 are selected from the
country’s population.
Referring to Table 7-5, among all the random sample sizes of 200, 90% will have more
than ________% who have high-speed access to the Internet.
Referring to Table 14-7, the department head wants to test H0 : β1 =
β2 = 0. The critical value of the F test for a level of signi,cance of
0.05 is ________.
TABLE 14-7
The department head of the accounting department wanted to see if
she could predict the GPA of students using the number of course
units (credits) and total SAT scores of each. She takes a sample of
students and generates the following Microsoft Excel output:

TABLE 16-5
The number of passengers arriving at San Francisco on the Amtrak cross-country
express on 6 successive Mondays were: 60, 72, 96, 84, 36, and 48.
Referring to Table 16-5, the number of arrivals will be smoothed with a 5-term moving
average. The first smoothed value will be ________.