True or False: You have just computed a regression model in which the value of
coefficient of multiple determination is 0.57. To determine if this indicates that the
independent variables explain a significant portion of the variation in the dependent
variable, you would perform an F test.
True or False: Common causes of variation represent variation due to the inherent
variability in the system.
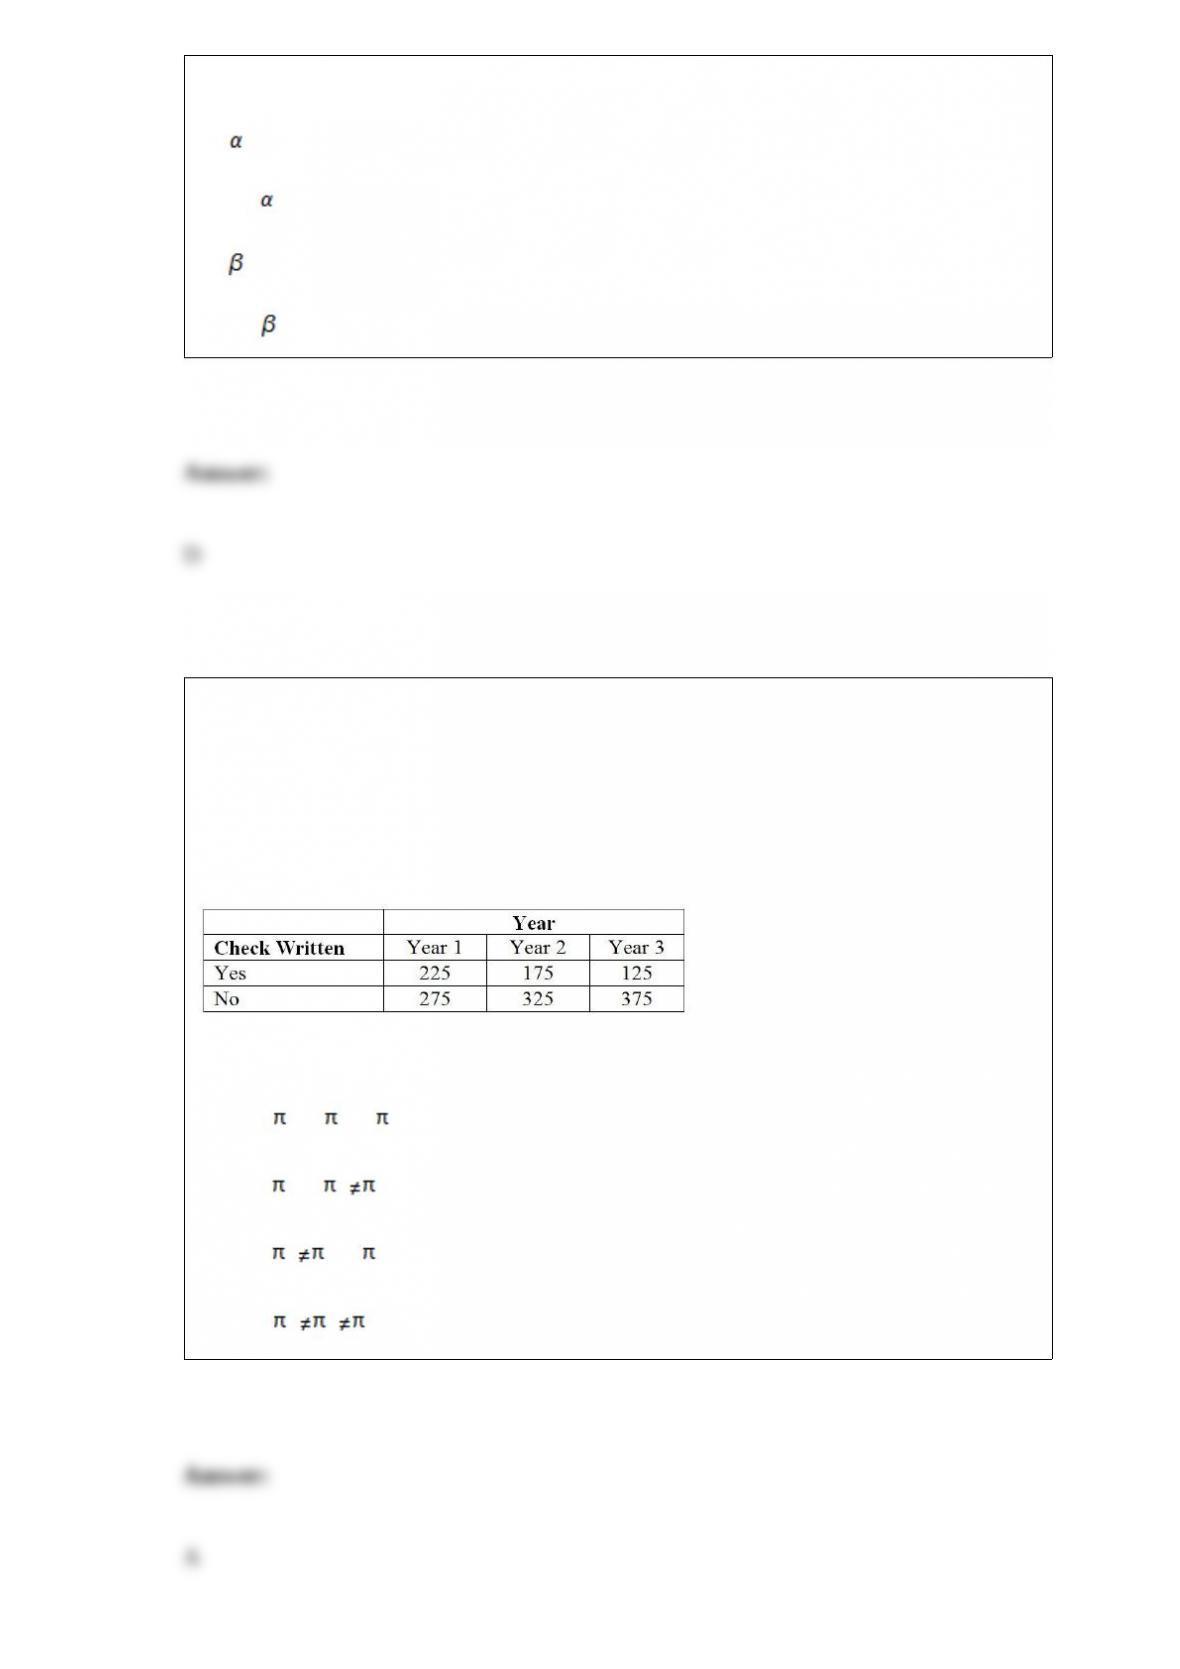
TABLE 12-6
According to an article in Marketing News, fewer checks are being written at the
grocery store checkout than in the past. To determine whether there is a difference in
the proportion of shoppers who pay by check among three consecutive years at a 0.05
level of significance, the results of a survey of 500 shoppers in three consecutive years
are obtained and presented below.
True or False: Referring to Table 12-6, the assumptions needed to perform the test are
satisfied.
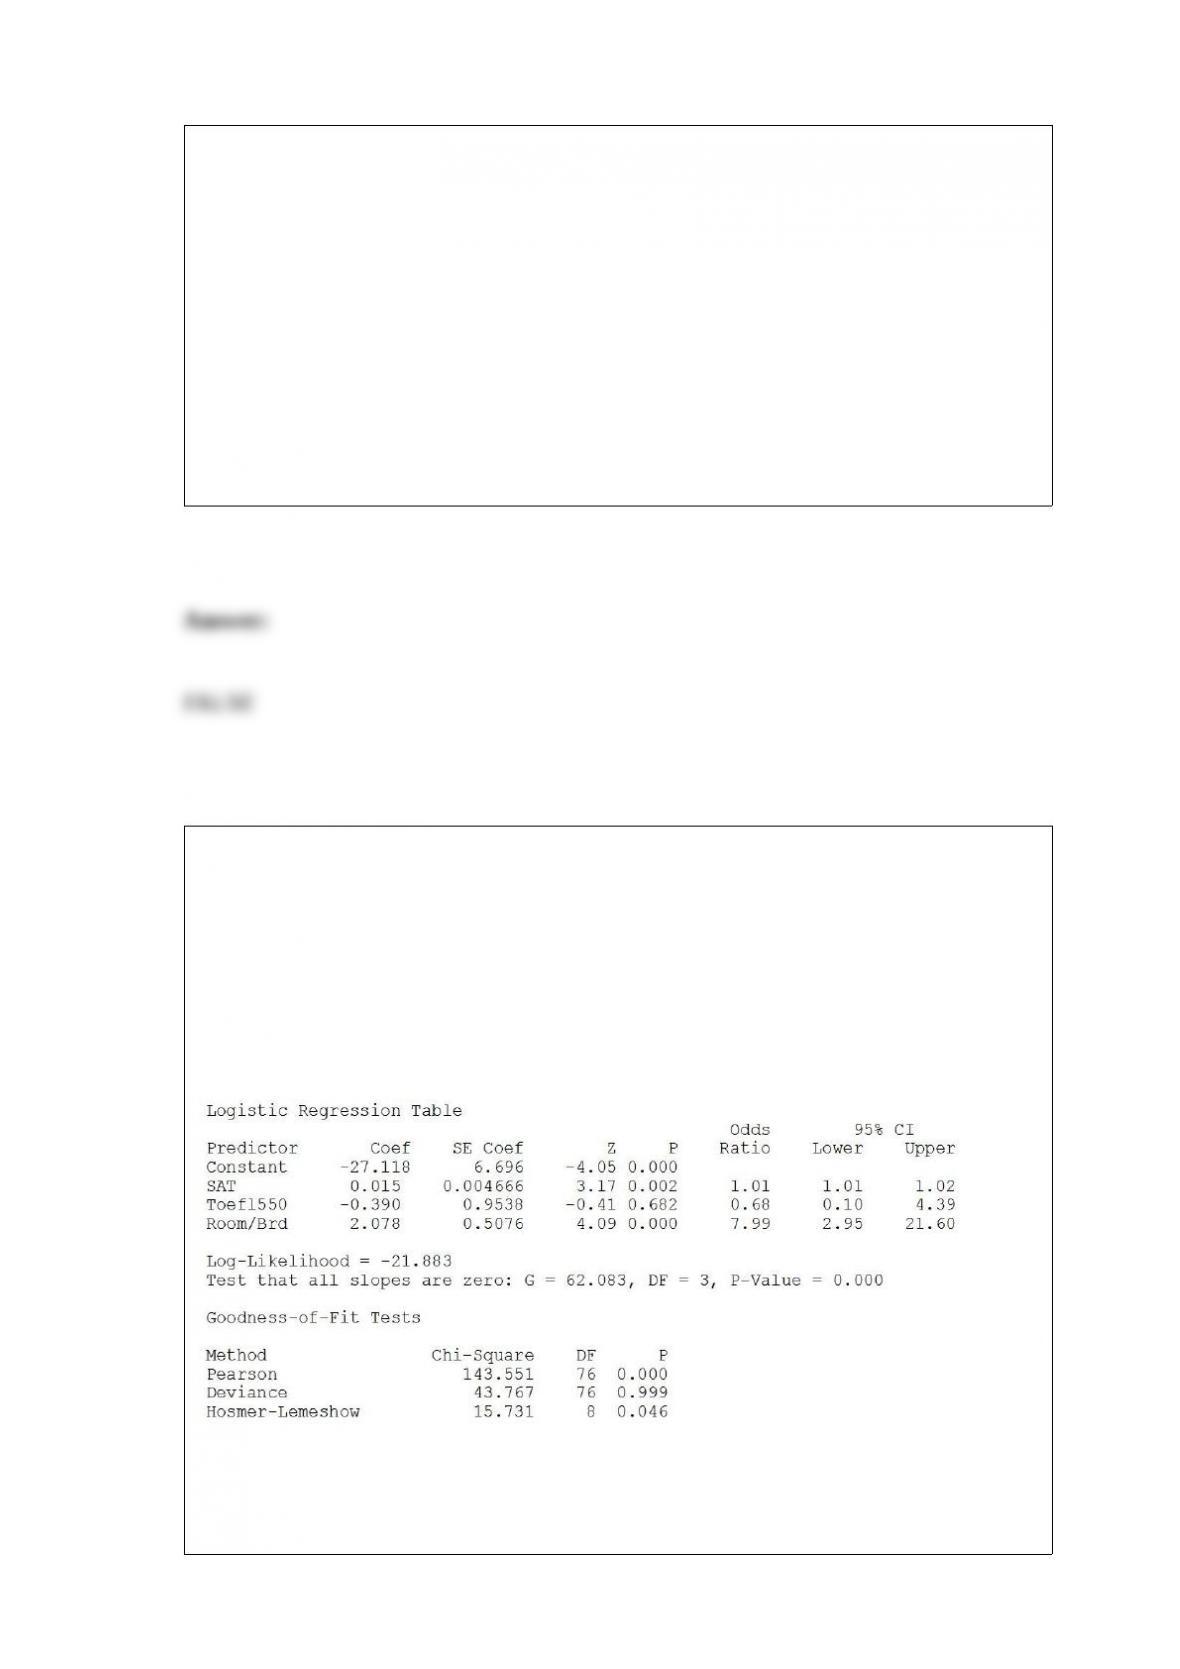
TABLE 9-9
The president of a university claimed that the entering class this year appeared to be
larger than the entering class from previous years but their mean SAT score is lower
than previous years. He took a sample of 20 of this year’s entering students and found
that their mean SAT score is 1,501 with a standard deviation of 53. The university’s
record indicates that the mean SAT score for entering students from previous years is
1,520. He wants to find out if his claim is supported by the evidence at a 5% level of
significance.
True or False: Referring to Table 9-9, the null hypothesis would be rejected if a 1%
probability of committing a Type I error is allowed.
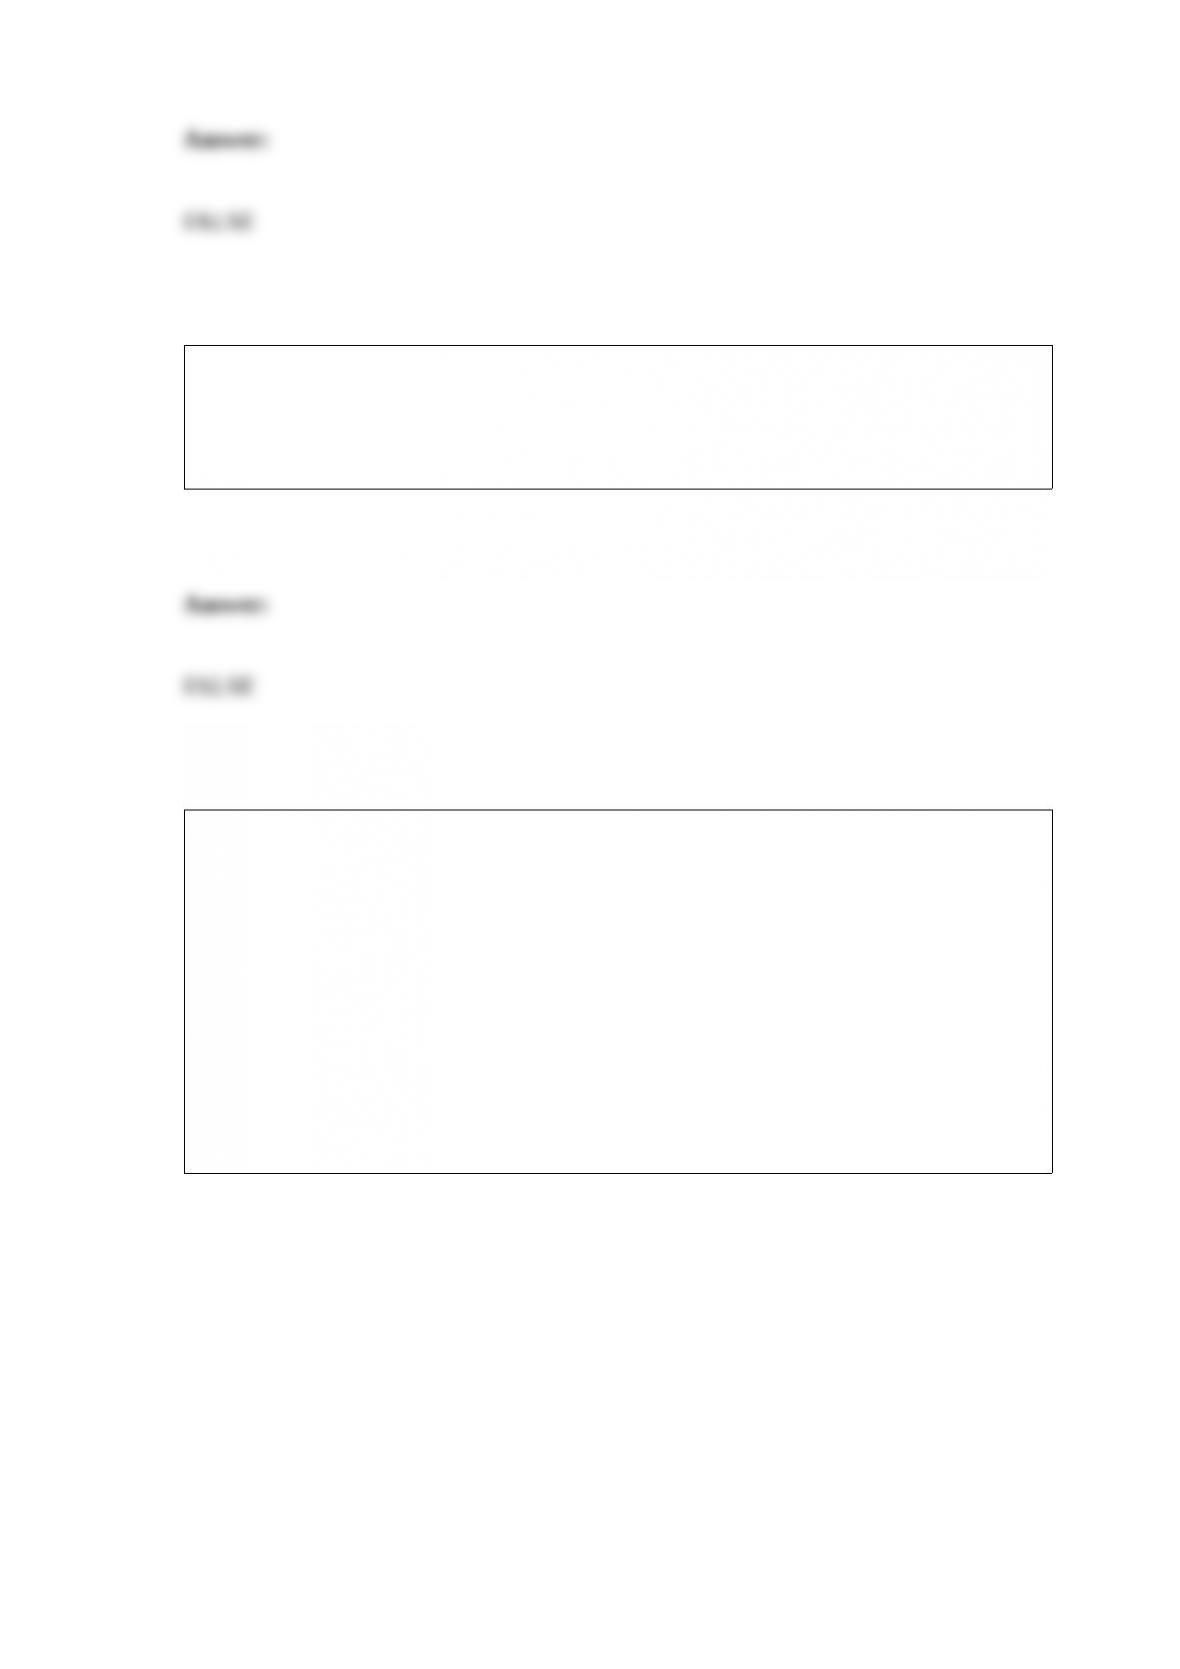
True or False: TABLE 17-11
A logistic regression model was estimated in order to predict the probability that a
randomly chosen university or college would be a private university using information
on mean total Scholastic Aptitude Test score (SAT) at the university or college, the
room and board expense measured in thousands of dollars (Room/Brd), and whether the
TOEFL criterion is at least 550 (Toefl550 = 1 if yes, 0 otherwise.) The dependent
variable, Y, is school type (Type = 1 if private and 0 otherwise).
Referring to Table 17-11, there is not enough evidence to conclude that SAT score
makes a significant contribution to the model in the presence of the other independent
variables at a 0.05 level of significance.
True or False: A statistics professor wanted to test whether the grades on a statistics test
were the same for upper and lower classmen. The professor took a random sample size
of 10 from each, conducted a test and found out that the variances were equal. For this
situation, the professor should use a t test with related samples.
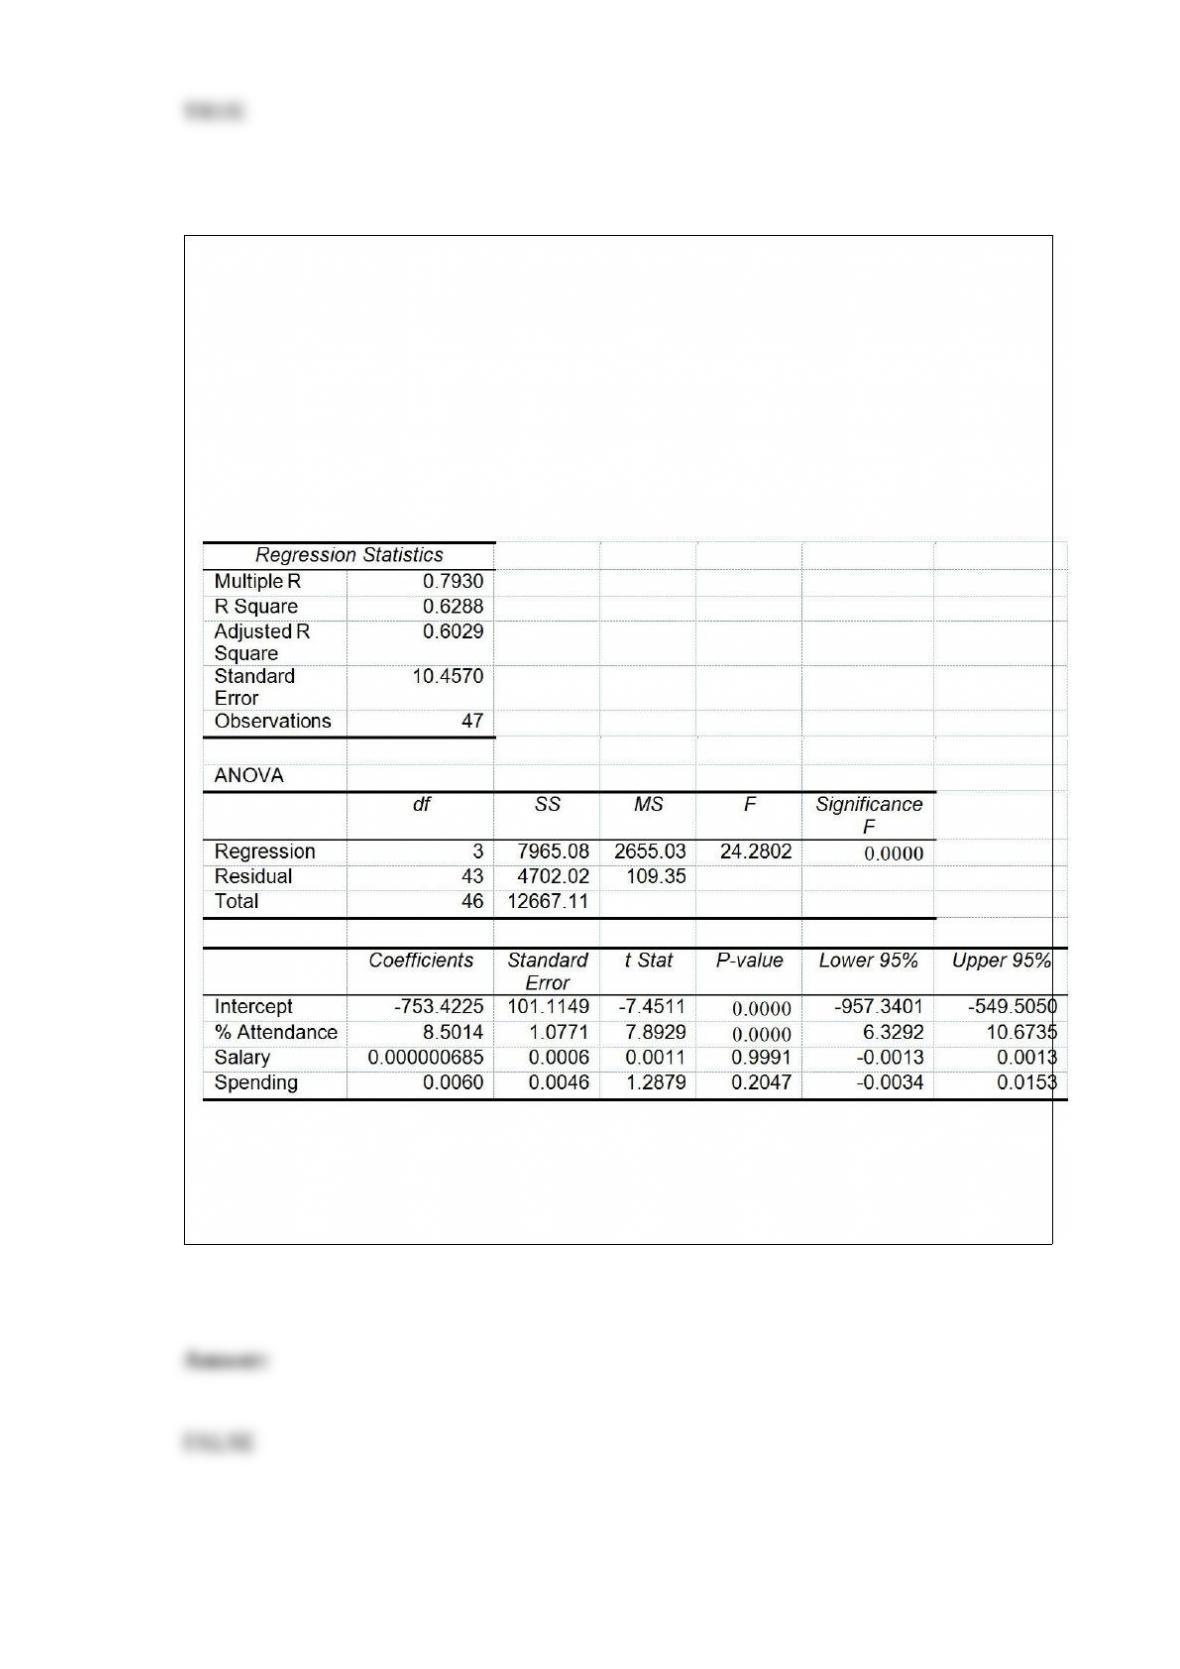
TABLE 14-15
The superintendent of a school district wanted to predict the
percentage of students passing a sixth-grade proficiency test. She
obtained the data on percentage of students passing the proficiency
test (% Passing), mean teacher salary in thousands of dollars
(Salaries), and instructional spending per pupil in thousands of dollars
(Spending) of 47 schools in the state.
Following is the multiple regression output with Y = % Passing as the
dependent variable, X1 = Salaries and X2 = Spending:

True or False: Referring to Table 14-15, the null hypothesis should be
rejected at a 5% level of significance when testing whether mean
teacher salary has any effect on percentage of students passing the
proficiency test, taking into account the effect of instructional
spending per pupil.
True or False: The amount of bleach a machine pours into bottles has a mean of 36 oz.
with a standard deviation of 0.15 oz. Suppose we take a random sample of 36 bottles
filled by this machine. The sampling distribution of the sample mean has a standard
error of 0.15.
True or False: The A in the DCOVA framework stands for “analyze.”
True or False: The t distribution is used to develop a confidence interval estimate of the
population mean when the population standard deviation is unknown.
True or False: Apple Computer, Inc. collected information on the age of their
customers. Suppose the youngest customer was 12 and the oldest was 72. To study the
distribution of the age among its customers, it can use a Pareto chart.
True or False: At a meeting of information systems officers for regional offices of a
national company, a survey was taken to determine the number of employees the
officers supervise in the operation of their departments, where X is the number of
employees overseen by each information systems officer. A stem-and-leaf display can
be used to present this information.
True or False: TABLE 17-8
The superintendent of a school district wanted to predict the percentage of students
passing a sixth-grade proficiency test. She obtained the data on percentage of students
passing the proficiency test (% Passing), daily mean of the percentage of students
attending class (% Attendance), mean teacher salary in dollars (Salaries), and
instructional spending per pupil in dollars (Spending) of 47 schools in the state.
Following is the multiple regression output with Y = % Passing as the dependent
variable, X1 = % Attendance, X2 = Salaries and X3 = Spending:
Referring to Table 17-8, you can conclude that instructional spending per pupil
individually has no impact on the mean percentage of students passing the proficiency
test, taking into account the effect of all the other independent variables, at a 10% level
of significance based solely on the 95% confidence interval estimate for β3.
The symbol for the power of a statistical test is
A) .
B) 1 – .
C) .
D) 1 – .
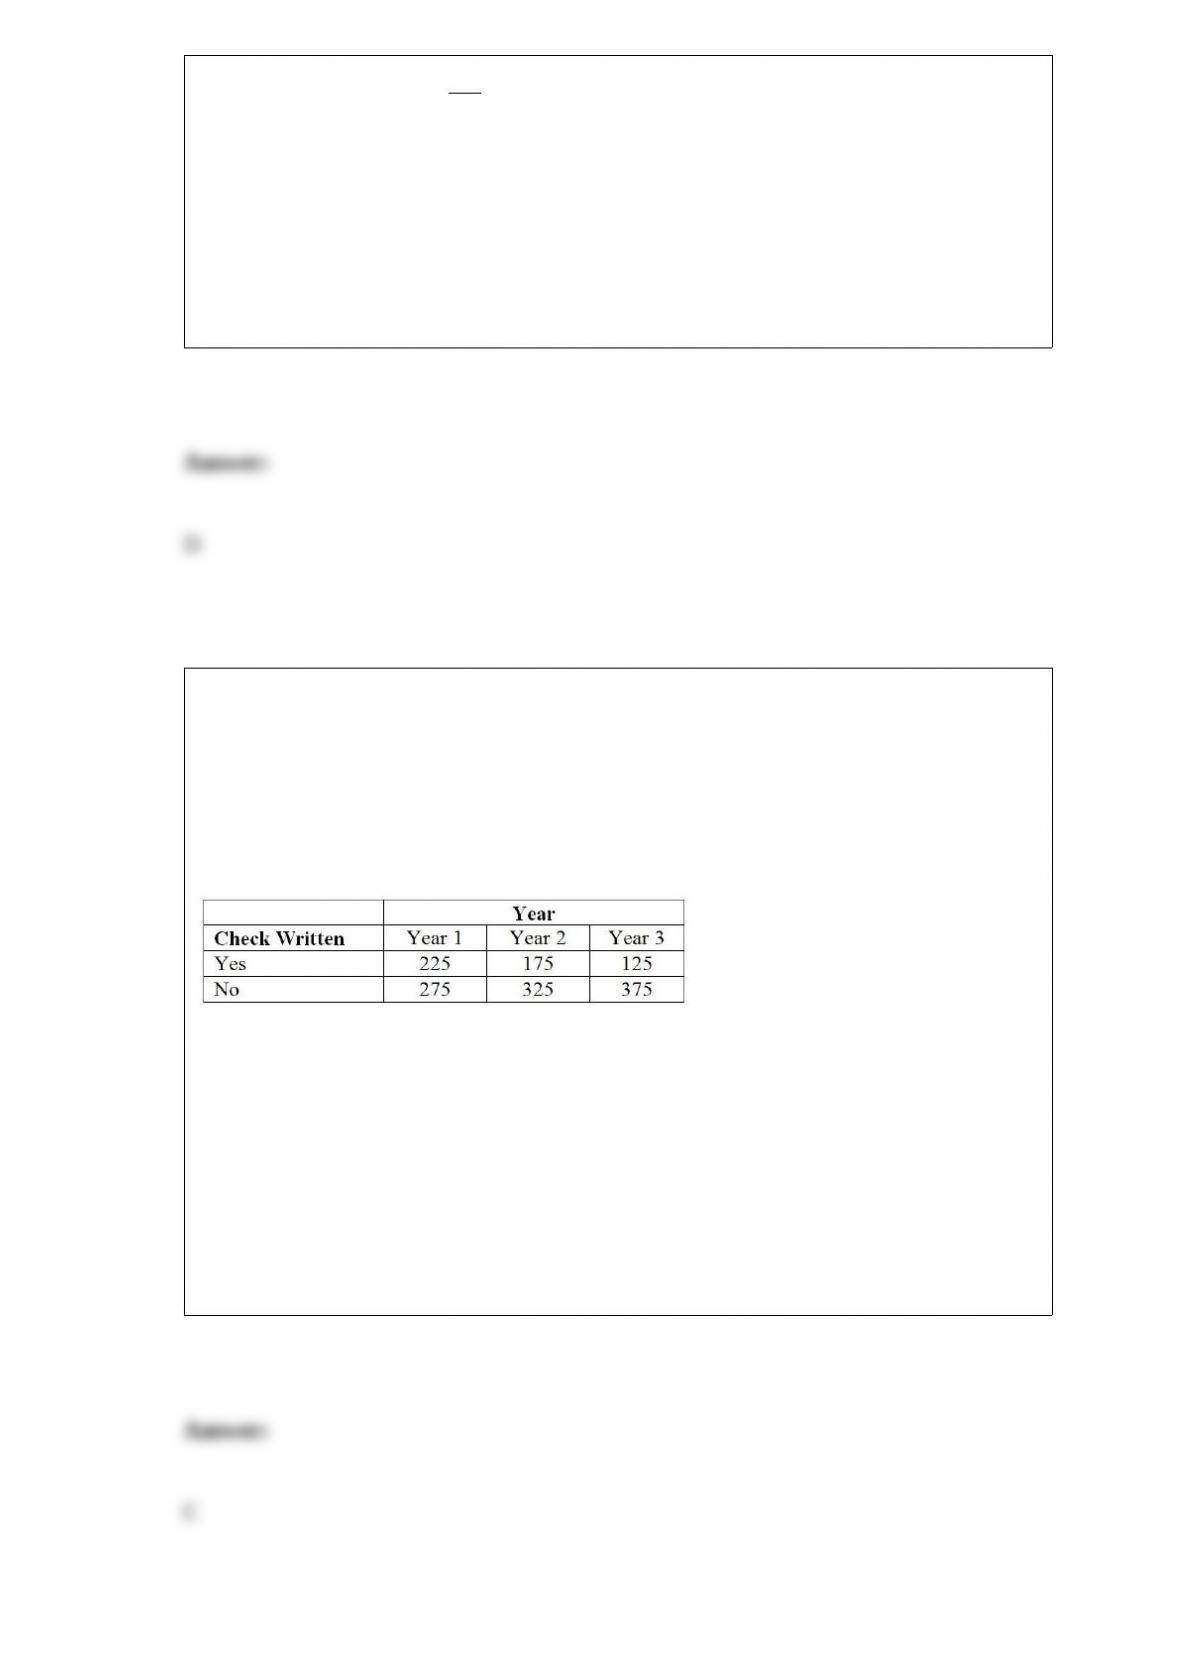
TABLE 12-6
According to an article in Marketing News, fewer checks are being written at the
grocery store checkout than in the past. To determine whether there is a difference in
the proportion of shoppers who pay by check among three consecutive years at a 0.05
level of significance, the results of a survey of 500 shoppers in three consecutive years
are obtained and presented below.
Referring to Table 12-6, what is the form of the null hypothesis?
A) H0 : 1 = 2 = 3
B) H0 : 1 = 2 3
C) H0 : 1 2 = 3
D) H0 : 123
True or False: Special or assignable causes of variation are signaled by individual
fluctuations or patterns in the data.
Let X represent the amount of time until the next student will arrive in the library
parking lot at the university. If we know that the distribution of arrival time can be
modeled using an exponential distribution with a mean of 4 minutes (i.e. the mean
number of arrivals is per minute), find the probability that it will take more than 10
minutes for the next student to arrive at the library parking lot.
A) 0.917915
B) 0.670320
C) 0.329680
D) 0.082085
Interaction in an experimental design can be tested in
A) a completely randomized model.
B) a two-factor model.
C) a Tukey-Kramer procedure.
D) all ANOVA models.
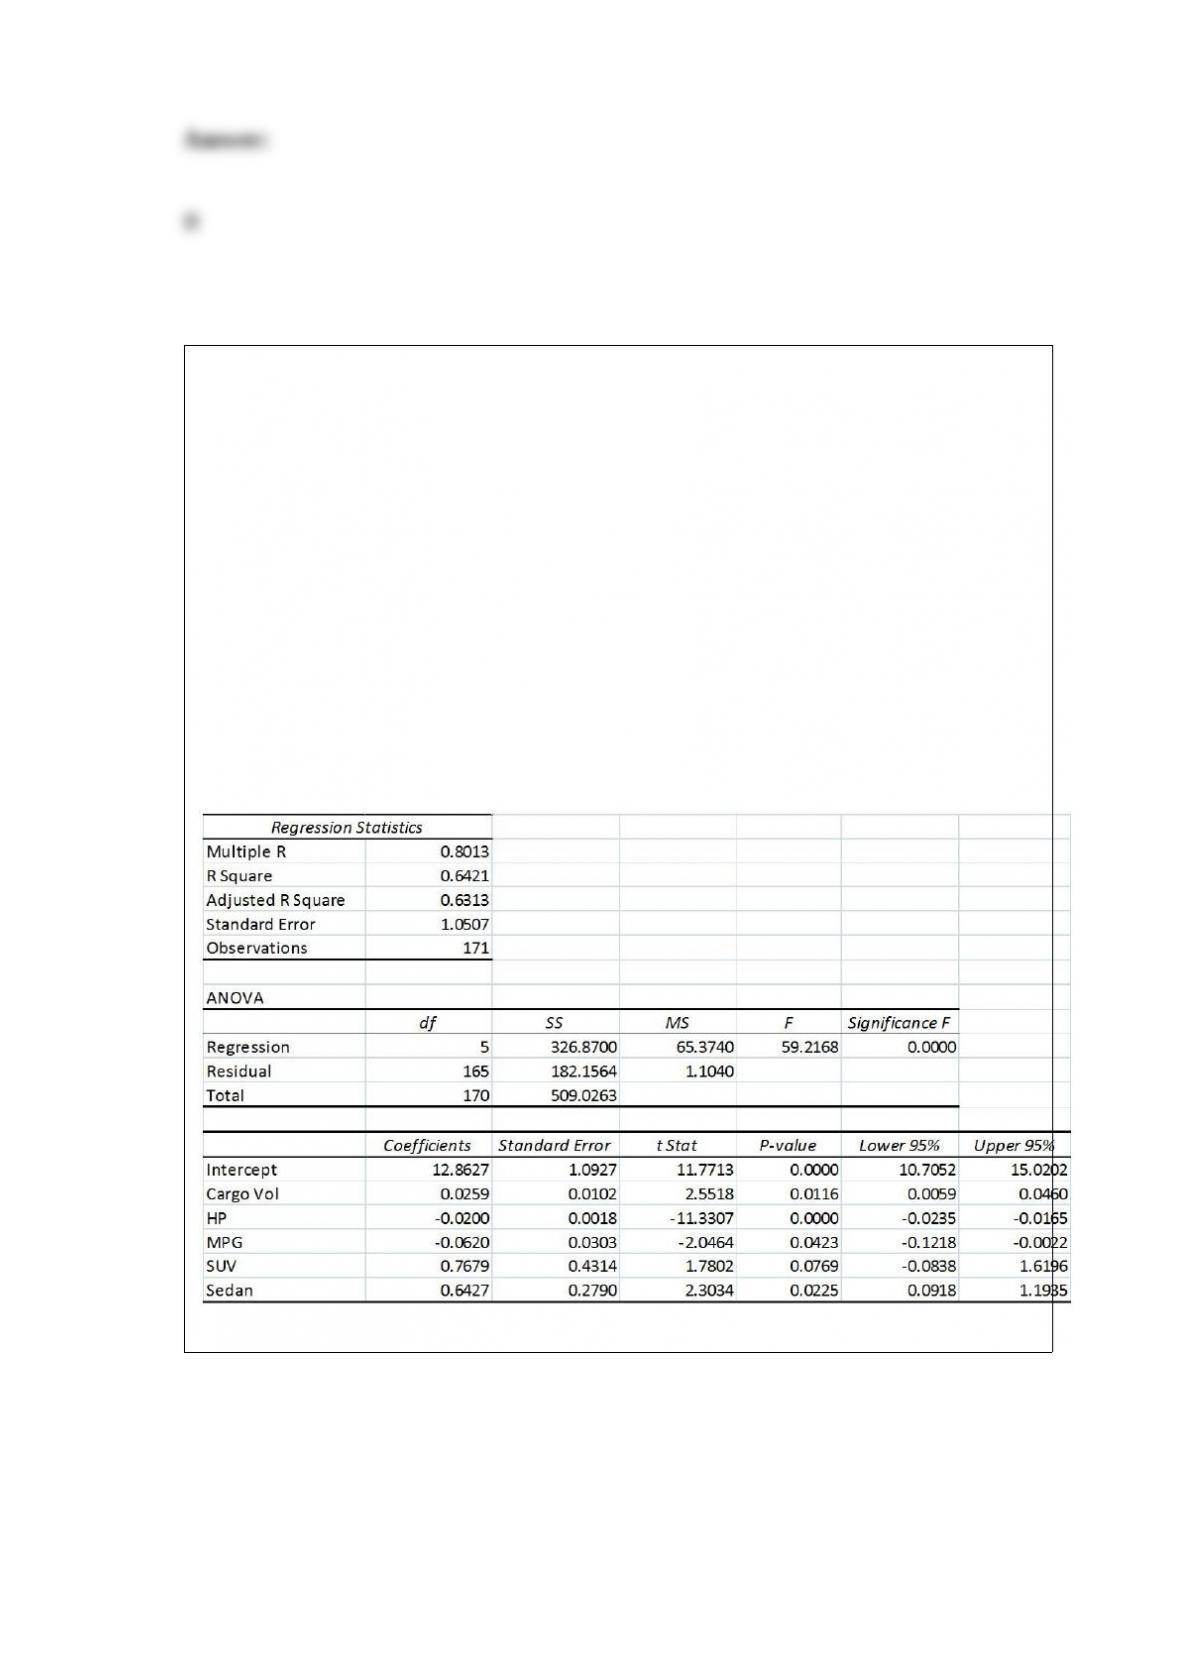
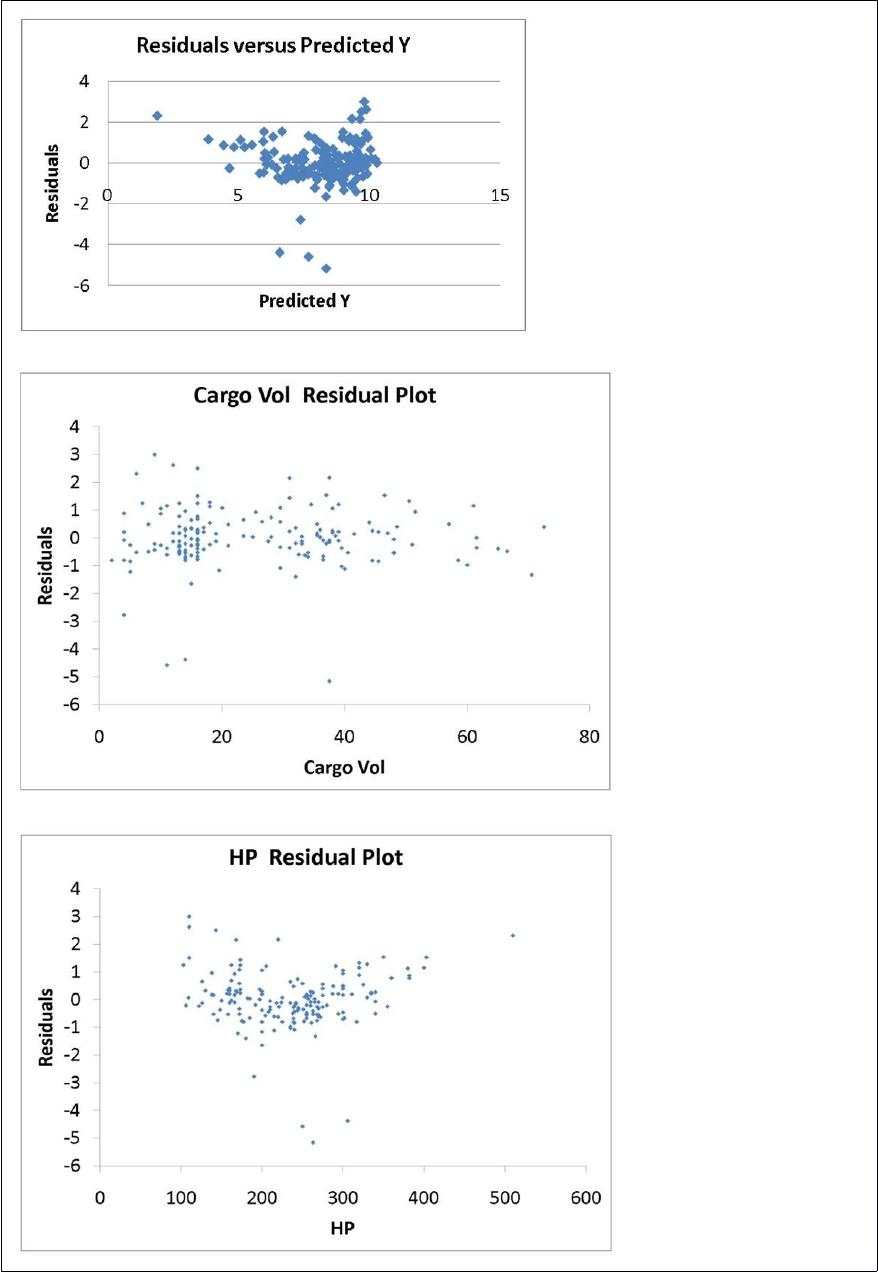
TABLE 17-9
What are the factors that determine the acceleration time (in sec.) from 0 to 60 miles per
hour of a car? Data on the following variables for 171 different vehicle models were
collected:
Accel Time: Acceleration time in sec.
Cargo Vol: Cargo volume in cu. ft.
HP: Horsepower
MPG: Miles per gallon
SUV: 1 if the vehicle model is an SUV with Coupe as the base when SUV and Sedan
are both 0
Sedan: 1 if the vehicle model is a sedan with Coupe as the base when SUV and Sedan
are both 0
The regression results using acceleration time as the dependent variable and the
remaining variables as the independent variables are presented below.
The various residual plots are as shown below.
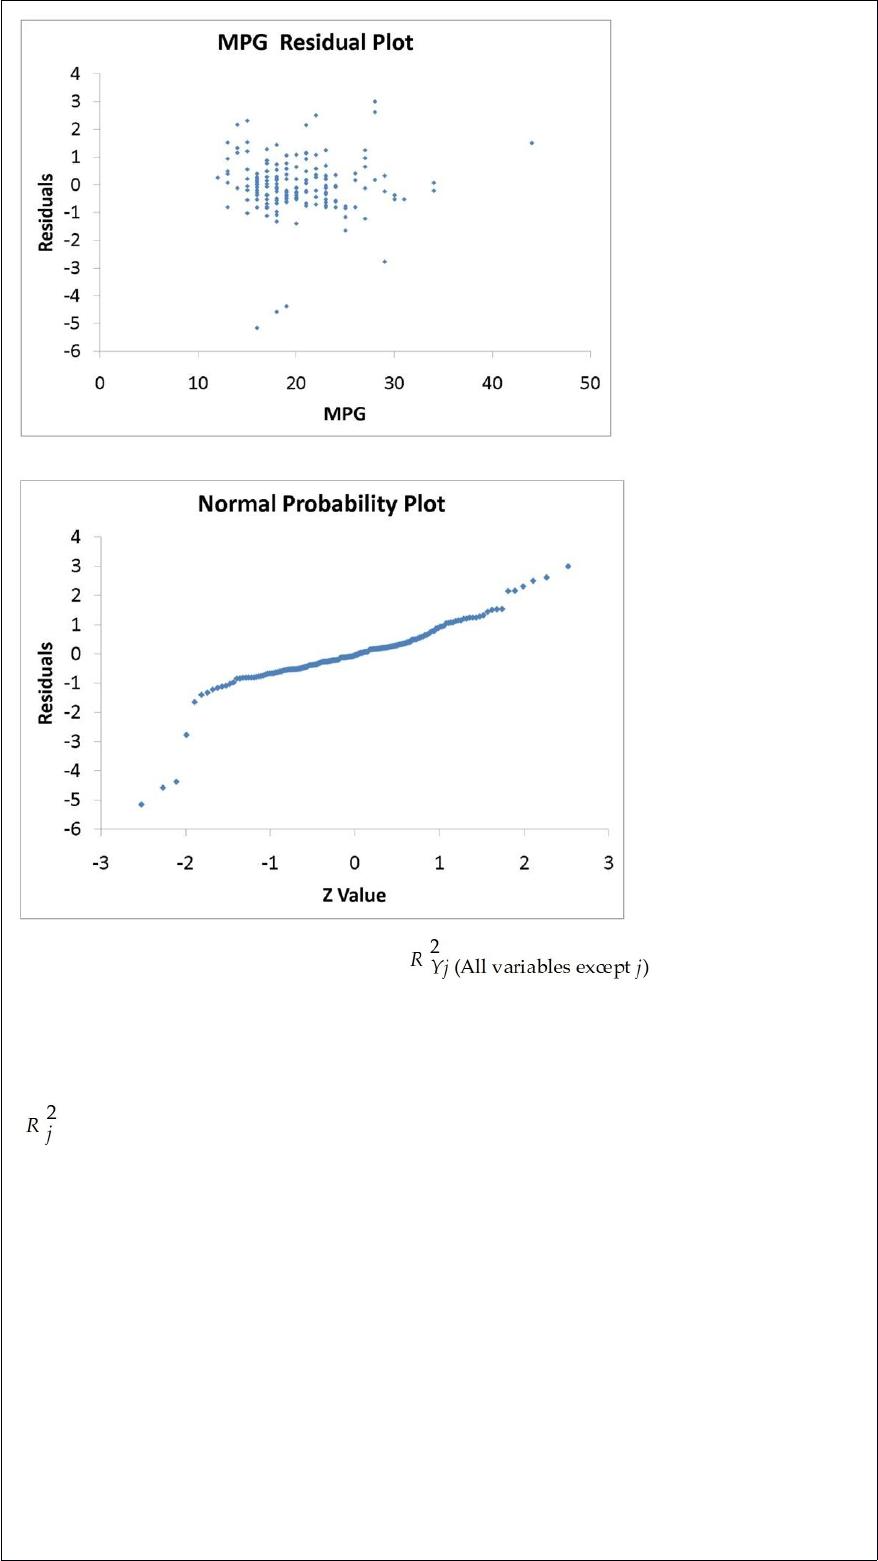
The coefficient of partial determination ( ) of each of the 5
predictors are, respectively, 0.0380, 0.4376, 0.0248, 0.0188, and 0.0312.
The coefficient of multiple determination for the regression model using each of the 5
variables Xj as the dependent variable and all other X variables as independent variables
( ) are, respectively, 0.7461, 0.5676, 0.6764, 0.8582, 0.6632.
Referring to Table 17-9, what is the correct interpretation for the estimated coefficient
for SUV?
A) The mean 0 to 60 miles per hour acceleration time of an SUV is estimated to be
0.7679 seconds higher than that of a coupe after considering the effect of all the other
independent variables in the model.
B) The mean 0 to 60 miles per hour acceleration time of an SUV is estimated to be
0.7679 seconds higher than that of a sedan after considering the effect of all the other
independent variables in the model.
C) The mean 0 to 60 miles per hour acceleration time of an SUV is estimated to be
0.7679 seconds lower than that of a coupe after considering the effect of all the other
independent variables in the model.
D) The mean 0 to 60 miles per hour acceleration time of an SUV is estimated to be
0.7679 seconds lower than that of a sedan after considering the effect of all the other
independent variables in the model.
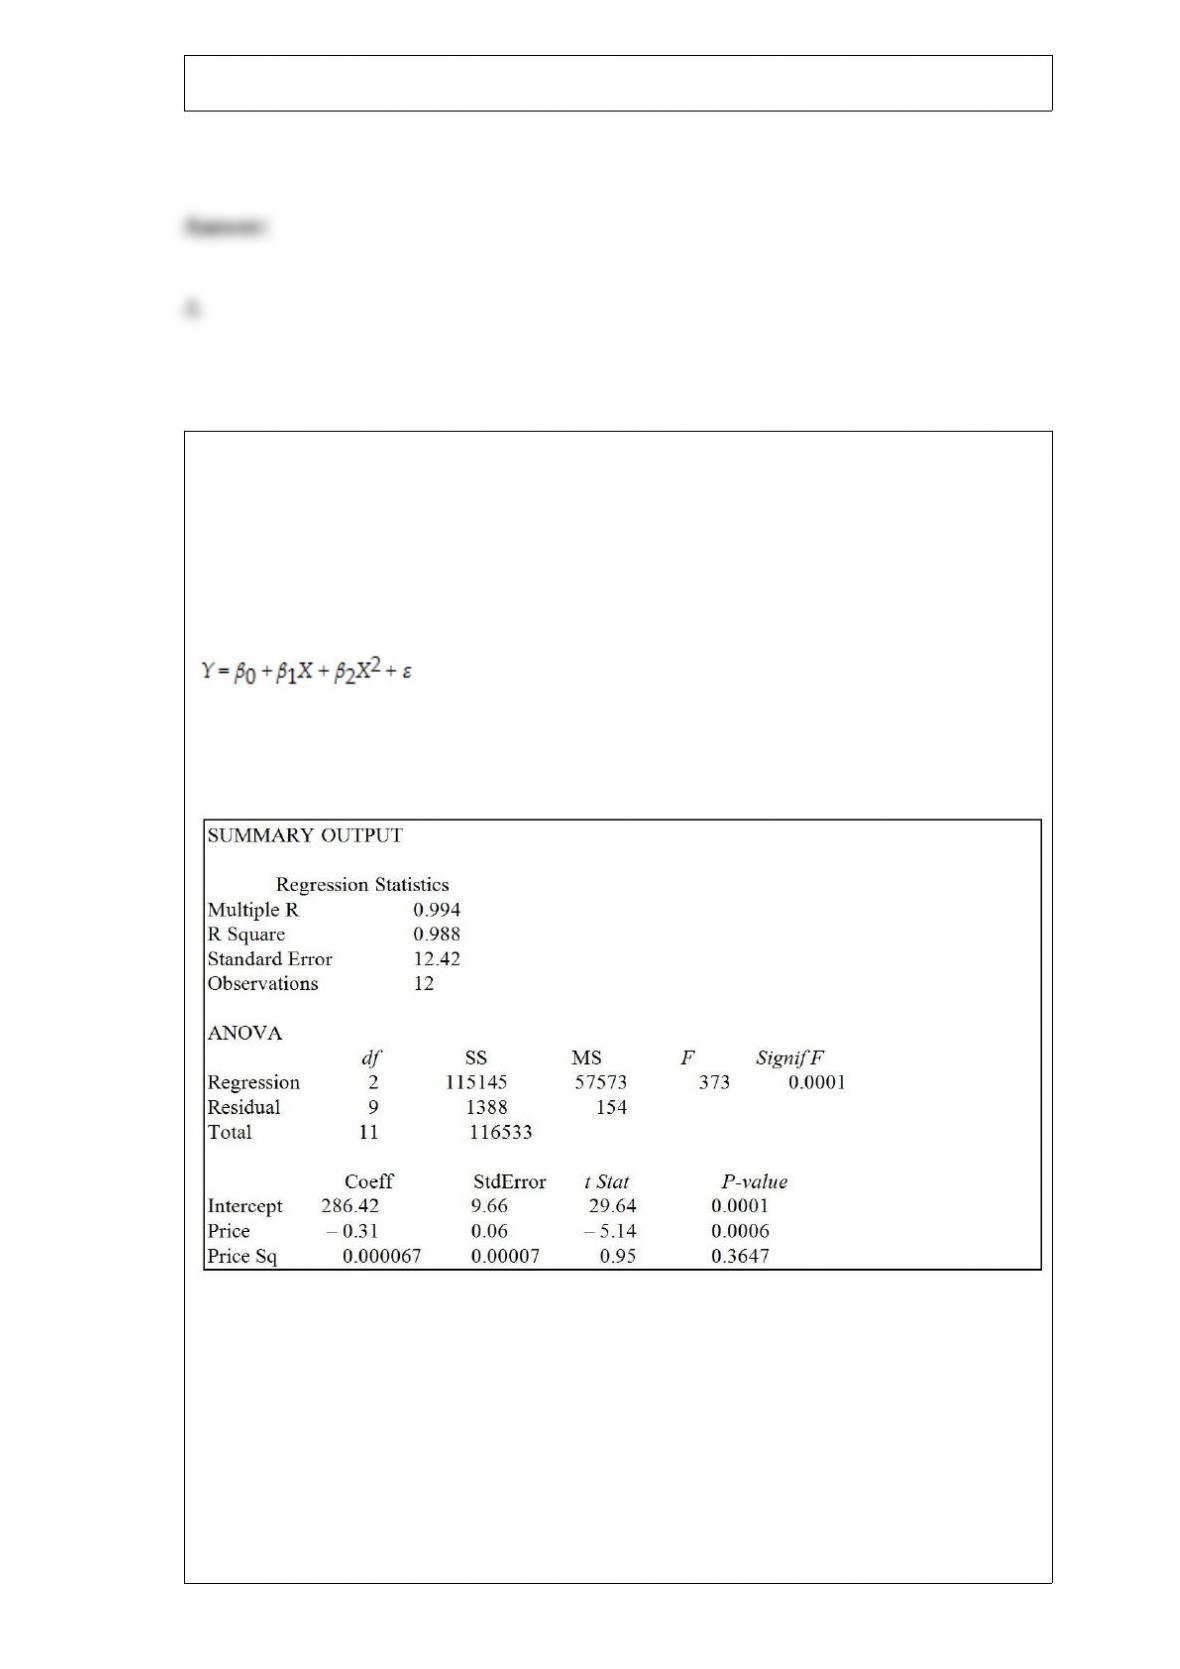
TABLE 15-1
A certain type of rare gem serves as a status symbol for many of its owners. In theory,
for low prices, the demand increases and it decreases as the price of the gem increases.
However, experts hypothesize that when the gem is valued at very high prices, the
demand increases with price due to the status owners believe they gain in obtaining the
gem. Thus, the model proposed to best explain the demand for the gem by its price is
the quadratic model:
where Y = demand (in thousands) and X = retail price per carat.
This model was fit to data collected for a sample of 12 rare gems of this type. A portion
of the computer analysis obtained from Microsoft Excel is shown below:
Referring to Table 15-1, what is the correct interpretation of the coefficient of multiple
determination?
A) 98.8% of the total variation in demand can be explained by the linear relationship
between demand and price.
B) 98.8% of the total variation in demand can be explained by the quadratic relationship
between demand and price.
C) 98.8% of the total variation in demand can be explained by the addition of the square
term in price.
D) 98.8% of the total variation in demand can be explained by just the square term in
price.
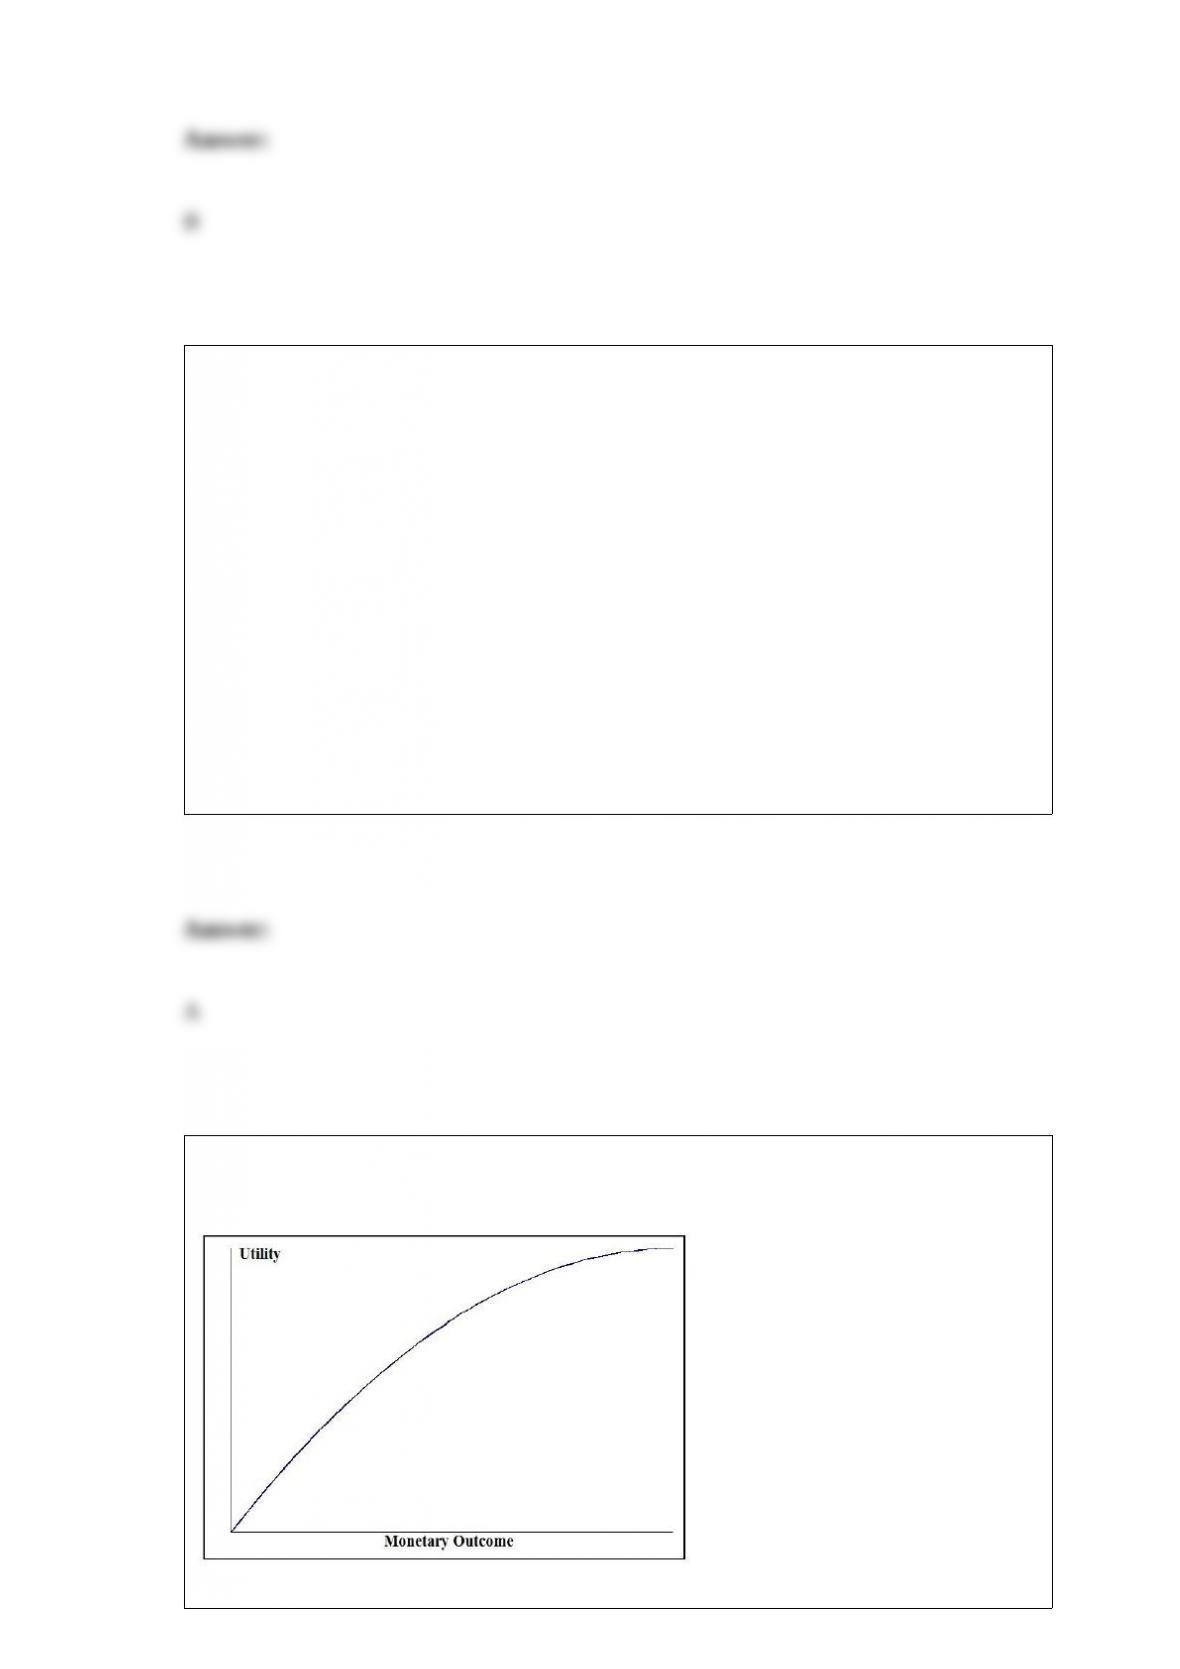
TABLE 1-2
A Wall Street Journal poll asked 2,150 adults in the United States a series of questions
to find out their view on the U.S. economy.
Referring to Table 1-2, the possible responses to the question “How many more months
do you think the U.S. economy will require to get out of a recession?” are values from a
A) discrete numerical variable.
B) continuous numerical variable.
C) categorical variable.
D) table of random numbers.
Look at the utility function graphed below and select the type of decision-maker that
corresponds to the graph.
A) Risk averter
B) Risk neutral
C) Risk taker
D) Risk player
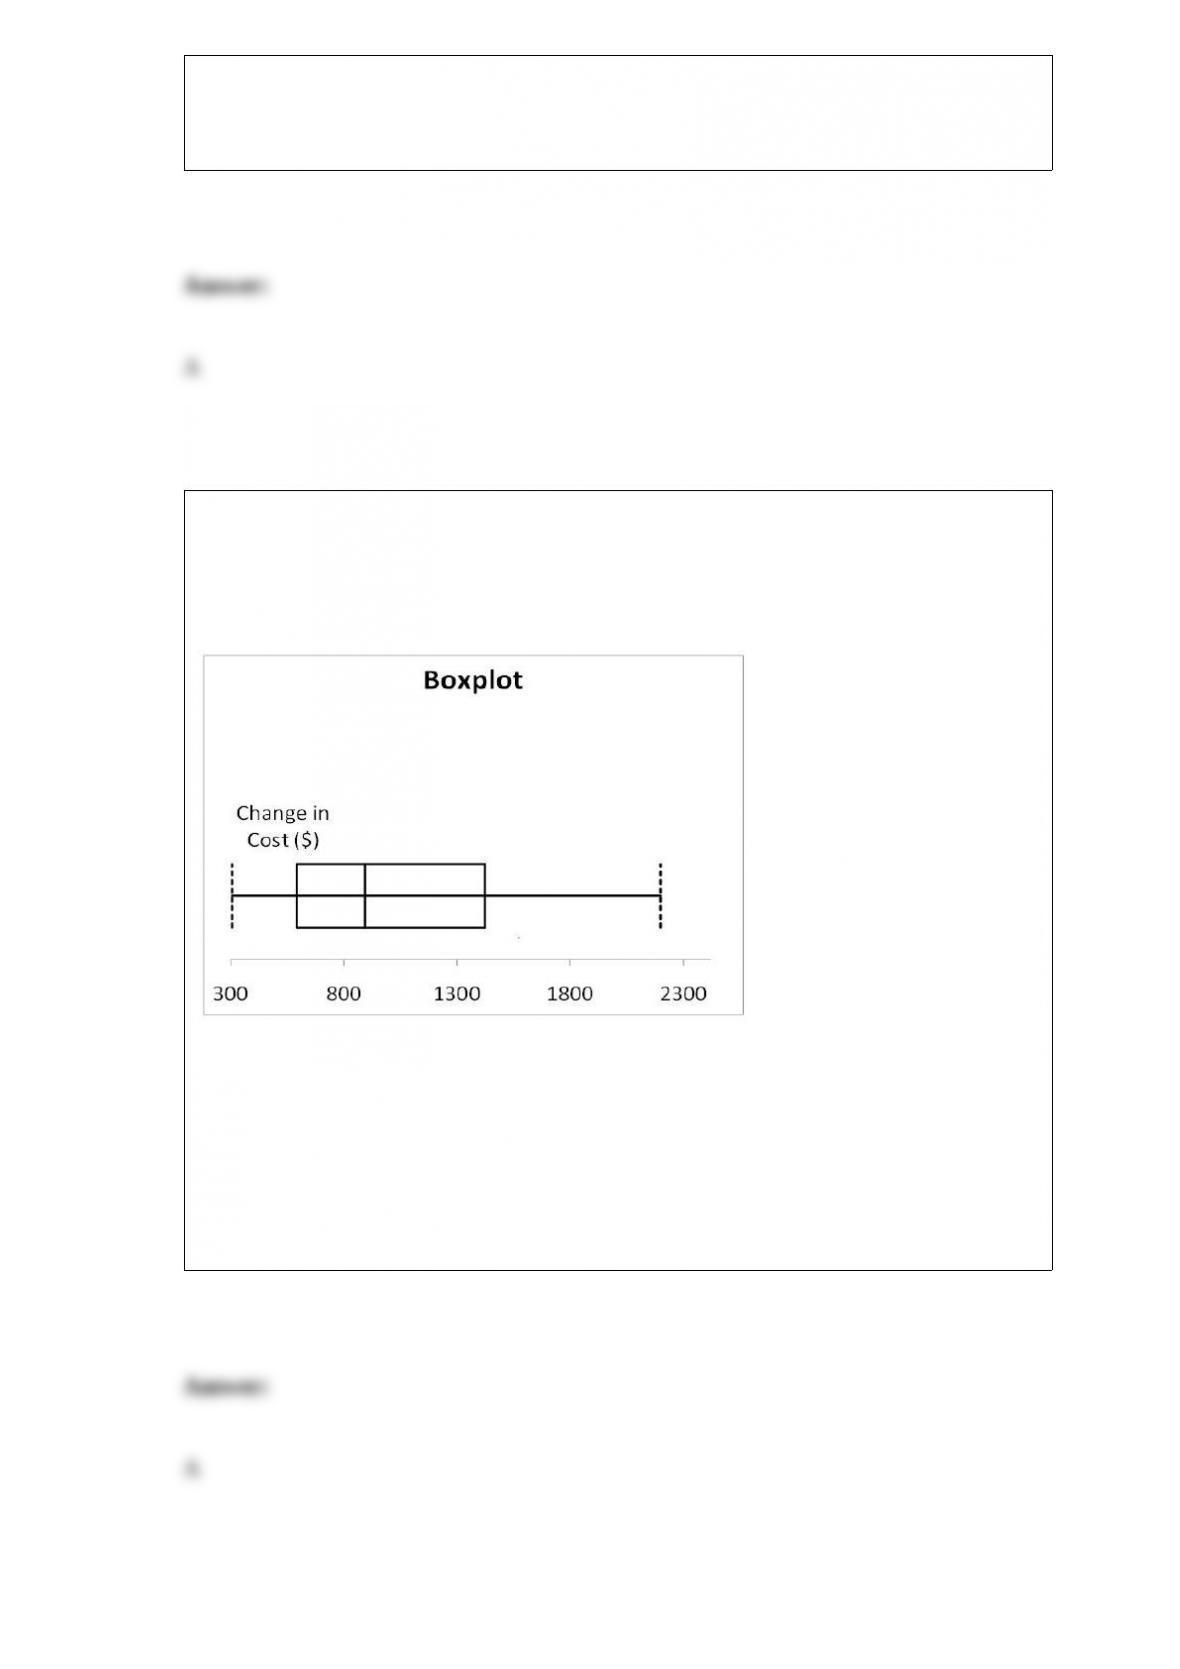
Data on the change in the cost of tuition, a shared dormitory room, and the most
popular meal plan from one academic year to the next academic year for a sample of
100 public universities were collected. Below is the boxplot for the change in cost in
dollars. The distribution of the change in cost is
A) right-skewed.
B) left-skewed.
C) symmetrical.
D) None of the above.
Which of the following is not a reason for the need for sampling?
A) It is usually too costly to study the whole population.
B) It is usually too time consuming to look at the whole population.
C) It is sometimes destructive to observe the entire population.
D) It is always more informative by investigating a sample than the entire population.
TABLE 12-6
According to an article in Marketing News, fewer checks are being written at the
grocery store checkout than in the past. To determine whether there is a difference in
the proportion of shoppers who pay by check among three consecutive years at a 0.05
level of significance, the results of a survey of 500 shoppers in three consecutive years
are obtained and presented below.
Referring to Table 12-6, what is the correct conclusion?
A) There is enough evidence that the proportions are all different in the 3 years.
B) There is not enough evidence that the proportions are all different in the 3 years.
C) There is enough evidence that at least two of the proportions are not equal.
D) There is not enough evidence that at least two of the proportions are not equal.
The annual multiplicative time-series model does not possess ________ component.
A) a trend
B) a cyclical
C) an irregular
D) a seasonal
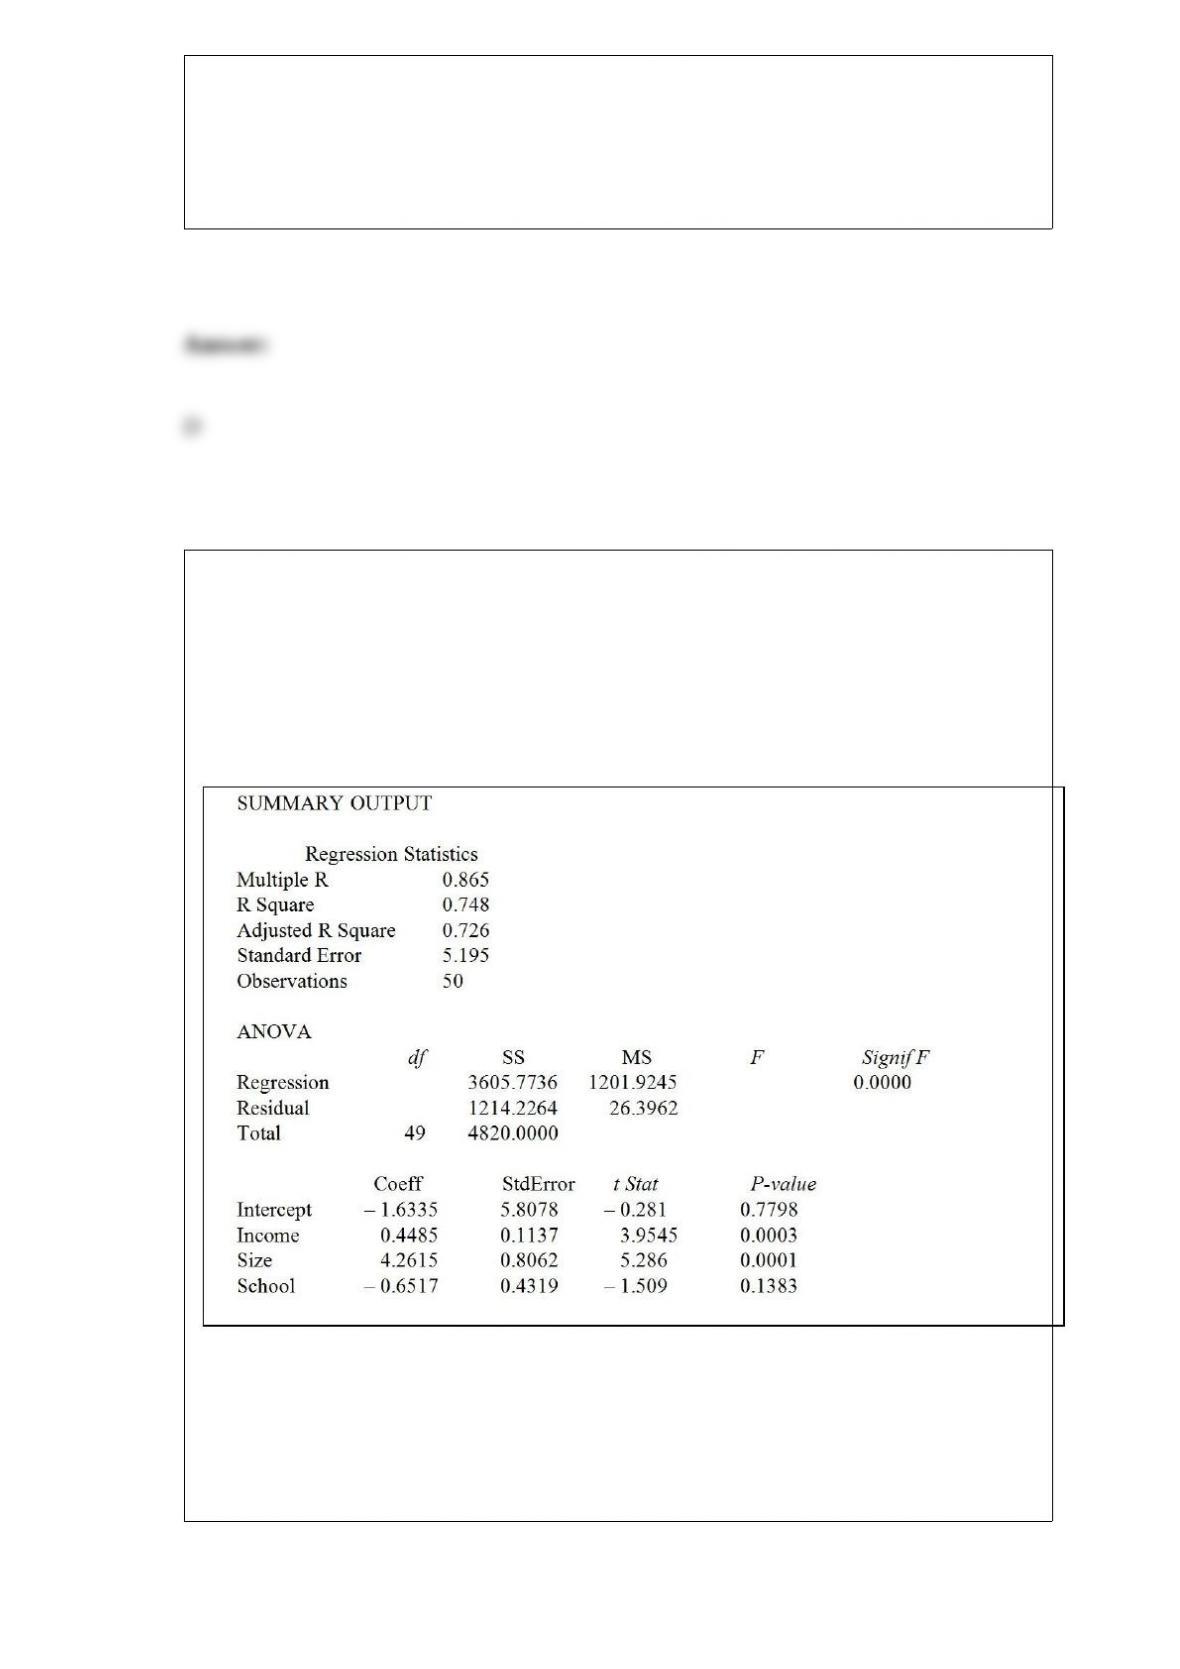
TABLE 17-1
A real estate builder wishes to determine how house size (House) is influenced by
family income (Income), family size (Size), and education of the head of household
(School). House size is measured in hundreds of square feet, income is measured in
thousands of dollars, and education is in years. The builder randomly selected 50
families and ran the multiple regression. Microsoft Excel output is provided below:
Referring to Table 17-1, suppose the builder wants to test whether the coefficient on
Income is significantly different from 0. What is the value of the relevant t-statistic?
A) 5.286
B) 5.195
C) 3.945
D) -1.509
Which of the following statements about the median is not true?
A) It is more affected by extreme values than the arithmetic mean.
B) It is a measure of central tendency.
C) It is equal to Q2.
D) It is equal to the mode in bell-shaped “normal” distributions.
TABLE 13-13
In this era of tough economic conditions, voters increasingly ask the question: “Is the
educational achievement level of students dependent on the amount of money the state
in which they reside spends on education?” The partial computer output below is the
result of using spending per student ($) as the independent variable and composite score
which is the sum of the math, science and reading scores as the dependent variable on
35 states that participated in a study. The table includes only partial results.
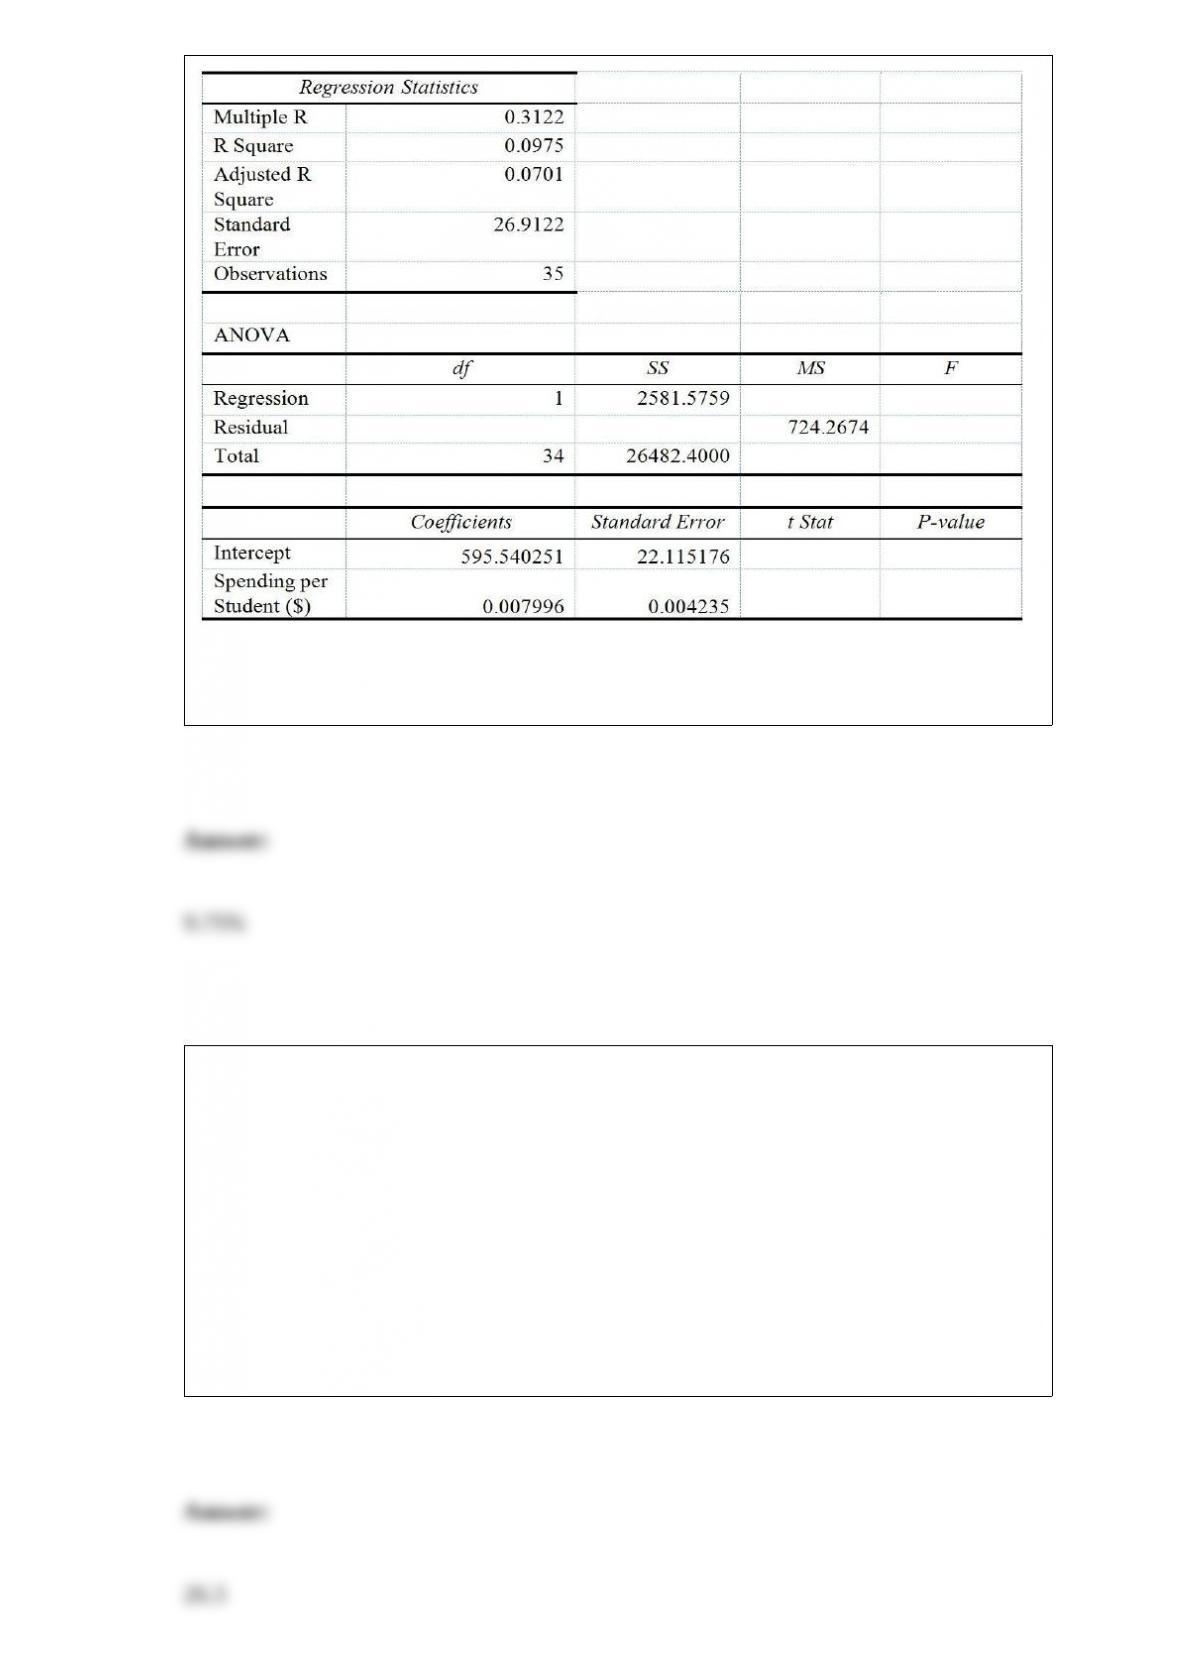
Referring to Table 13-13, what percentage of the variation in composite score can be
explained by the variation in spending per student?
TABLE 3-3
The ordered array below represents the number of vitamin supplements sold by a health
food store in a sample of 16 days.
19, 19, 20, 20, 22, 23, 25, 26, 27, 30, 33, 34, 35, 36, 38, 41
Note: For this sample, the sum of the values is 448, and the sum of the squared
differences between each value and the mean is 812.
Referring to Table 3-3, the coefficient of variation of the number of vitamin
supplements sold in this sample is ________ percent.
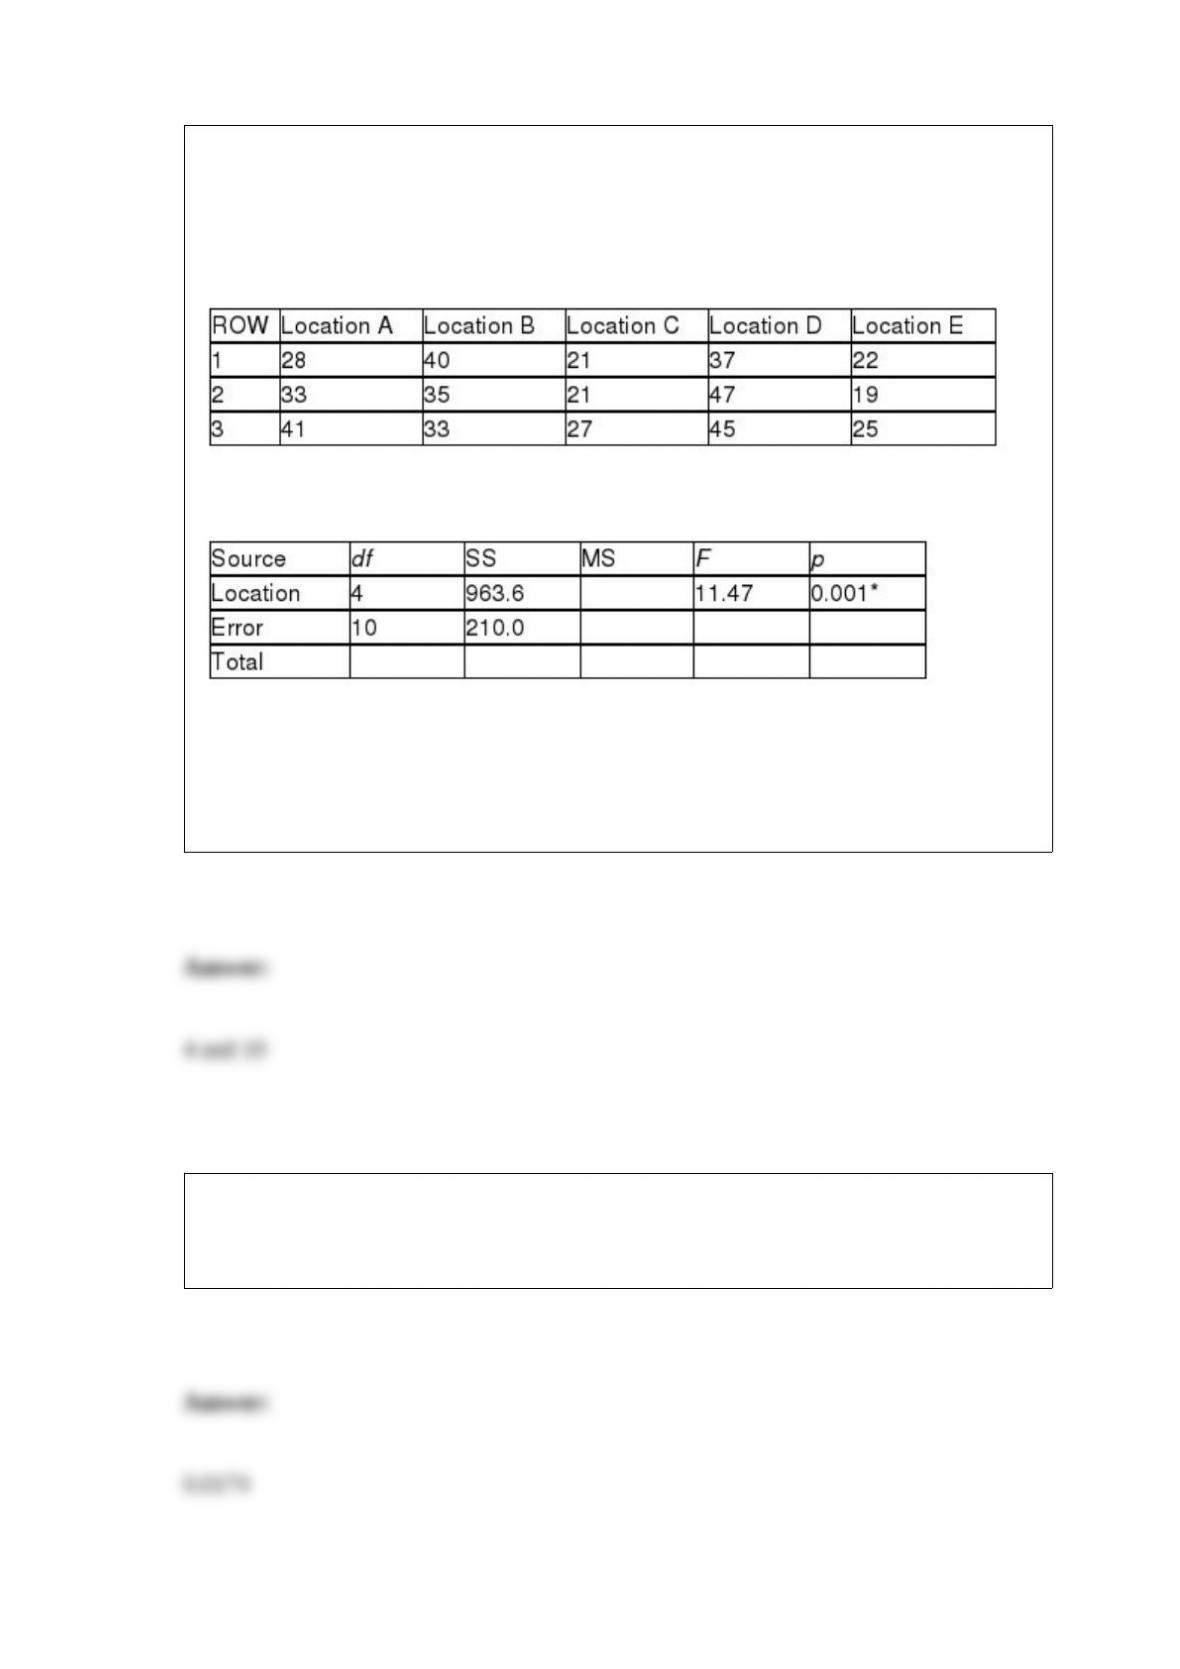
TABLE 11-5
A hotel chain has identically small sized resorts in 5 locations in different small islands.
The data that follow resulted from analyzing the hotel occupancies on randomly
selected days in the 5 locations.
Analysis of Variance
* or p < 0.005, tabular value
Referring to Table 11-5, the numerator and denominator degrees of freedom of the test
ratio are ________ and ________, respectively.
The number of power outages at a nuclear power plant has a Poisson distribution with a
mean of 6 outages per year. The probability that there will be no more than 1 power
outage in a year is ________.
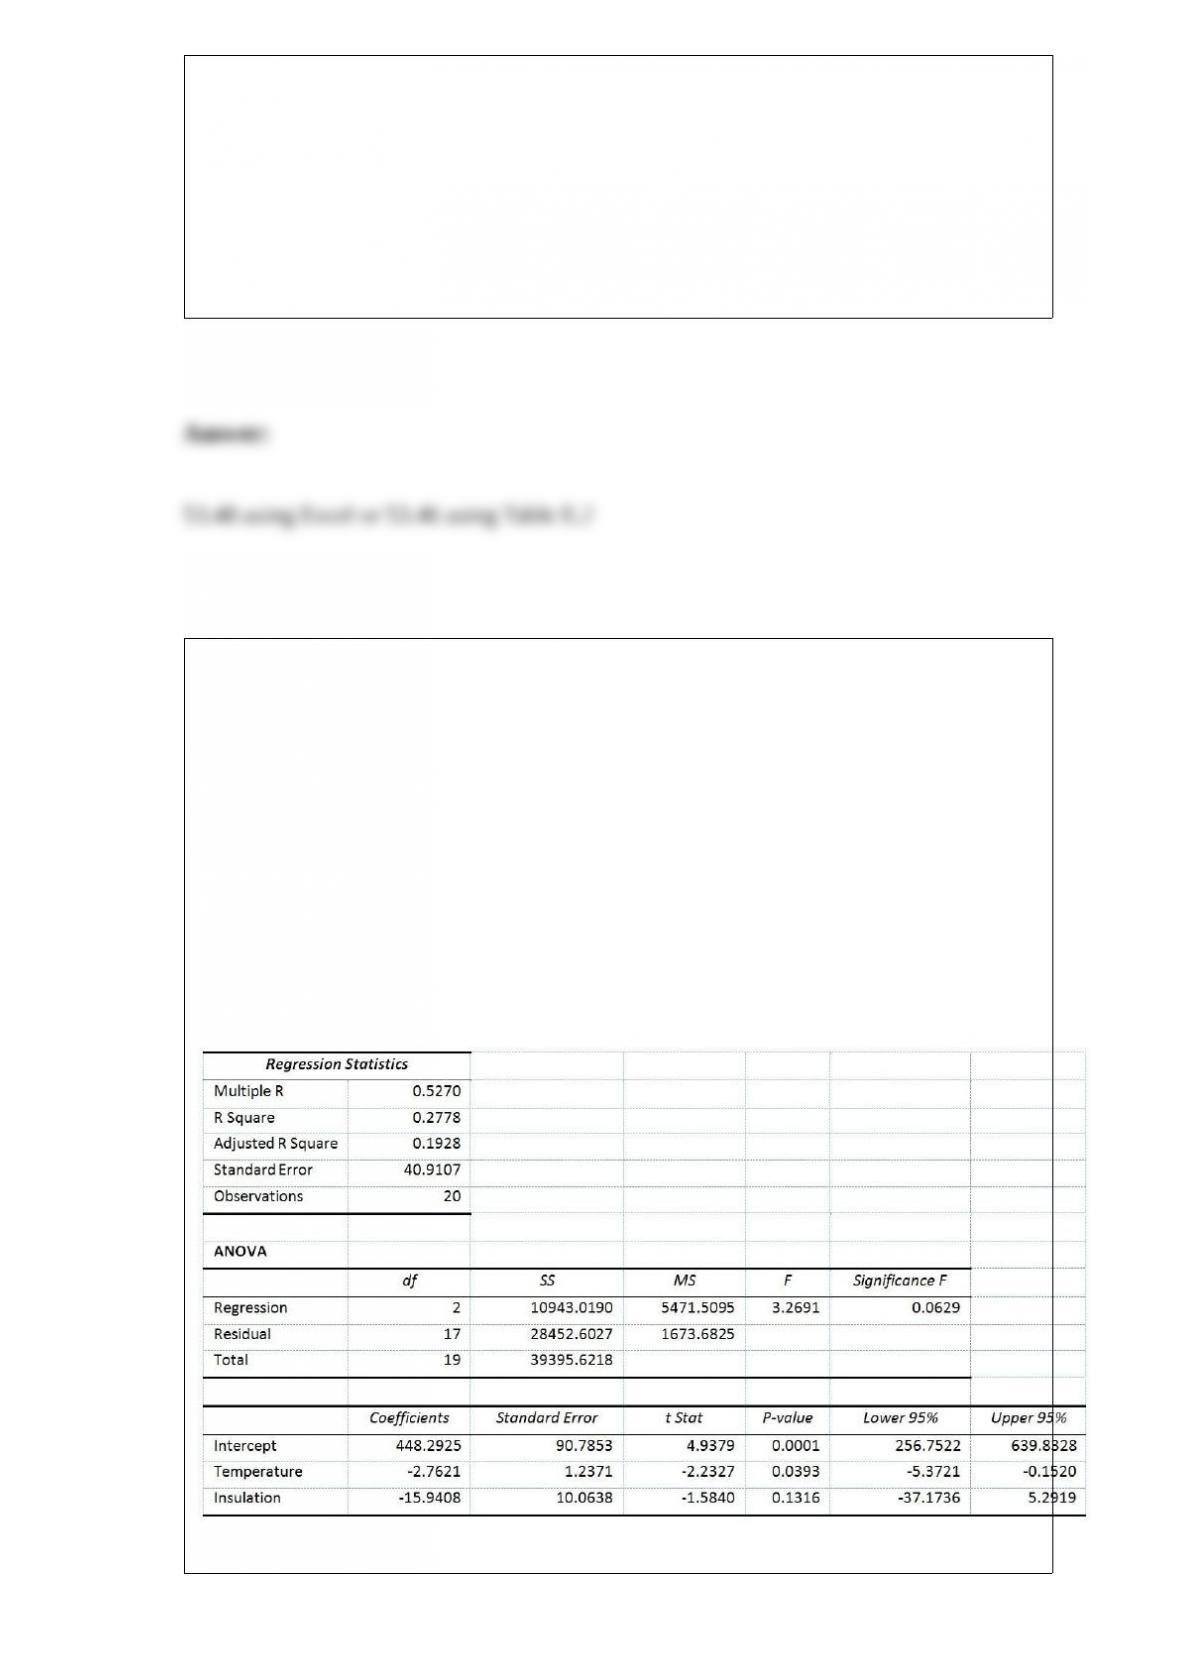
TABLE 7-6
Online customer service is a key element to successful online retailing. According to a
marketing survey, 37.5% of online customers take advantage of the online customer
service. Random samples of 200 customers are selected.
Referring to Table 7-6, ________% of the samples are likely to have between 35% and
40% who take advantage of online customer service.
Referring to Table 14-6, the partial F test for
H0 : Variable X1 does not significantly improve the model after variable X2 has been
included
H1 : Variable X1 significantly improves the model after variable X2 has been included
has ________ and ________ degrees of freedom.
TABLE 14-6
One of the most common questions of prospective house buyers pertains to the cost of
heating in dollars (Y). To provide its customers with information on that matter, a large
real estate firm used the following 2 variables to predict heating costs: the daily
minimum outside temperature in degrees of Fahrenheit (X1) and the amount of
insulation in inches (X2). Given below is EXCEL output of the regression model.
Also SSR (X1∣ X2) = 8343.3572 and SSR (X2∣ X1) = 4199.2672
In a game called Taxation and Evasion, a player rolls a pair of dice. If on any turn the
sum is 7, 11, or 12, the player gets audited. Otherwise, she avoids taxes. Suppose a
player takes 5 turns at rolling the dice. The expected number of times she will be
audited is ________.
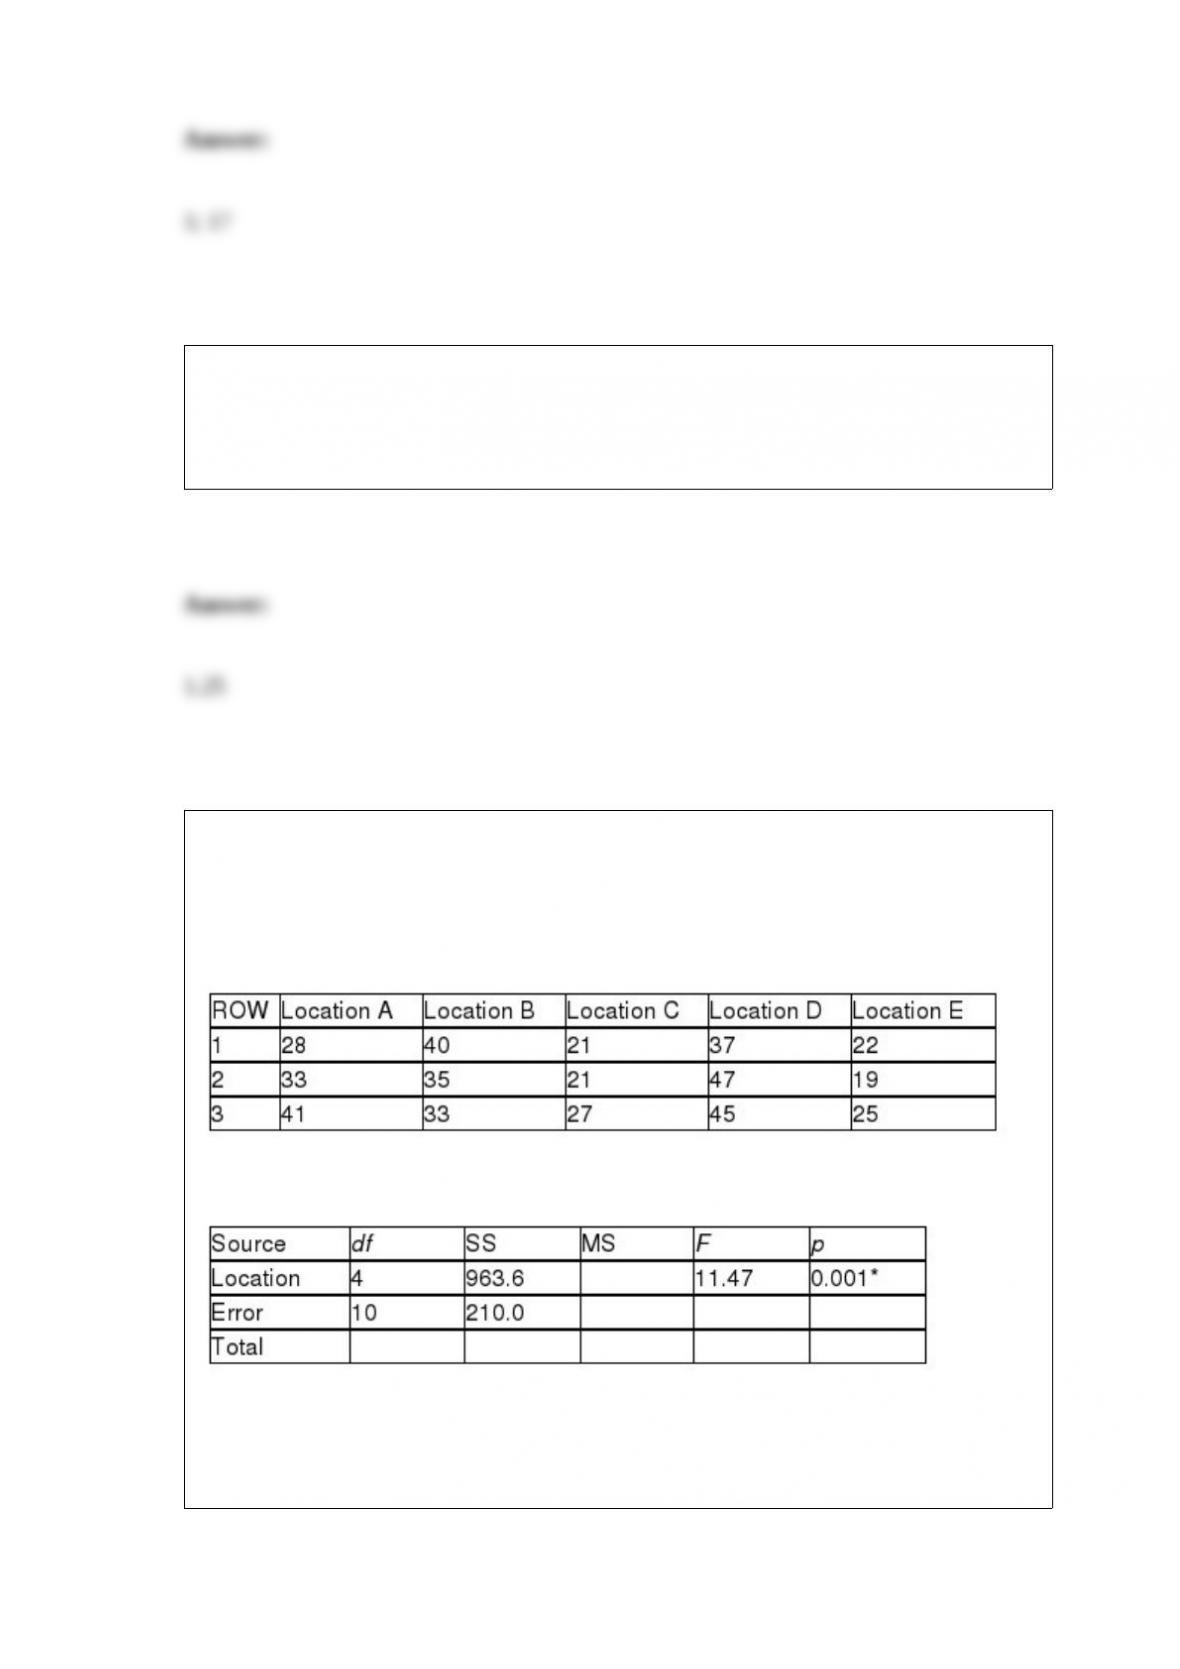
TABLE 11-5
A hotel chain has identically small sized resorts in 5 locations in different small islands.
The data that follow resulted from analyzing the hotel occupancies on randomly
selected days in the 5 locations.
Analysis of Variance
* or p < 0.005, tabular value
Referring to Table 11-5, the value of MSA is ________ while MSW is ________.