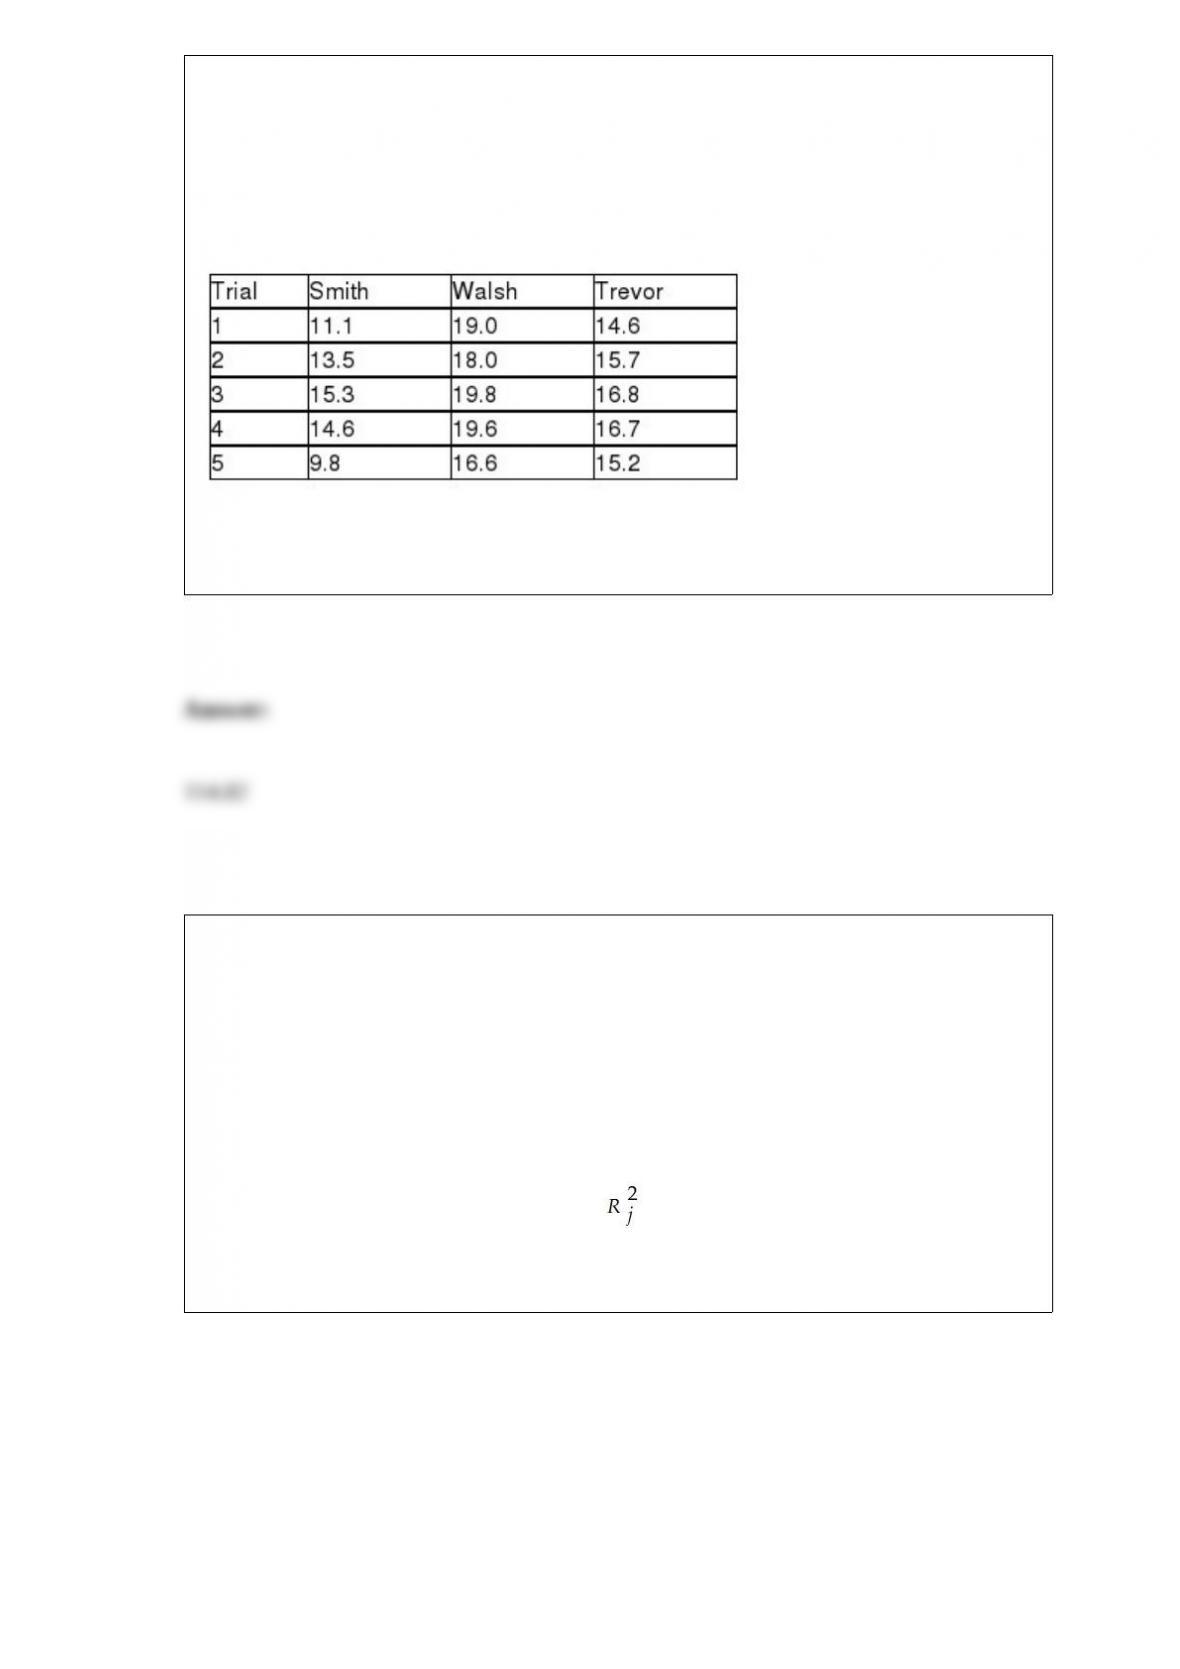
TABLE 11-4
An agronomist wants to compare the crop yield of 3 varieties of chickpea seeds. She
plants 15 fields, 5 with each variety. She then measures the crop yield in bushels per
acre. Treating this as a completely randomized design, the results are presented in the
table that follows.
Referring to Table 11-4, the agronomist decided to perform an ANOVA F test. The
amount of total variation or SST is ________.
TABLE 15-4
The superintendent of a school district wanted to predict the percentage of students
passing a sixth-grade proficiency test. She obtained the data on percentage of students
passing the proficiency test (% Passing), daily mean of the percentage of students
attending class (% Attendance), mean teacher salary in dollars (Salaries), and
instructional spending per pupil in dollars (Spending) of 47 schools in the state.
Let Y = % Passing as the dependent variable, X1 = % Attendance, X2 = Salaries and X3
= Spending.
The coefficient of multiple determination ( ) of each of the 3 predictors with all the
other remaining predictors are, respectively, 0.0338, 0.4669, and 0.4743.
The output from the best-subset regressions is given below:
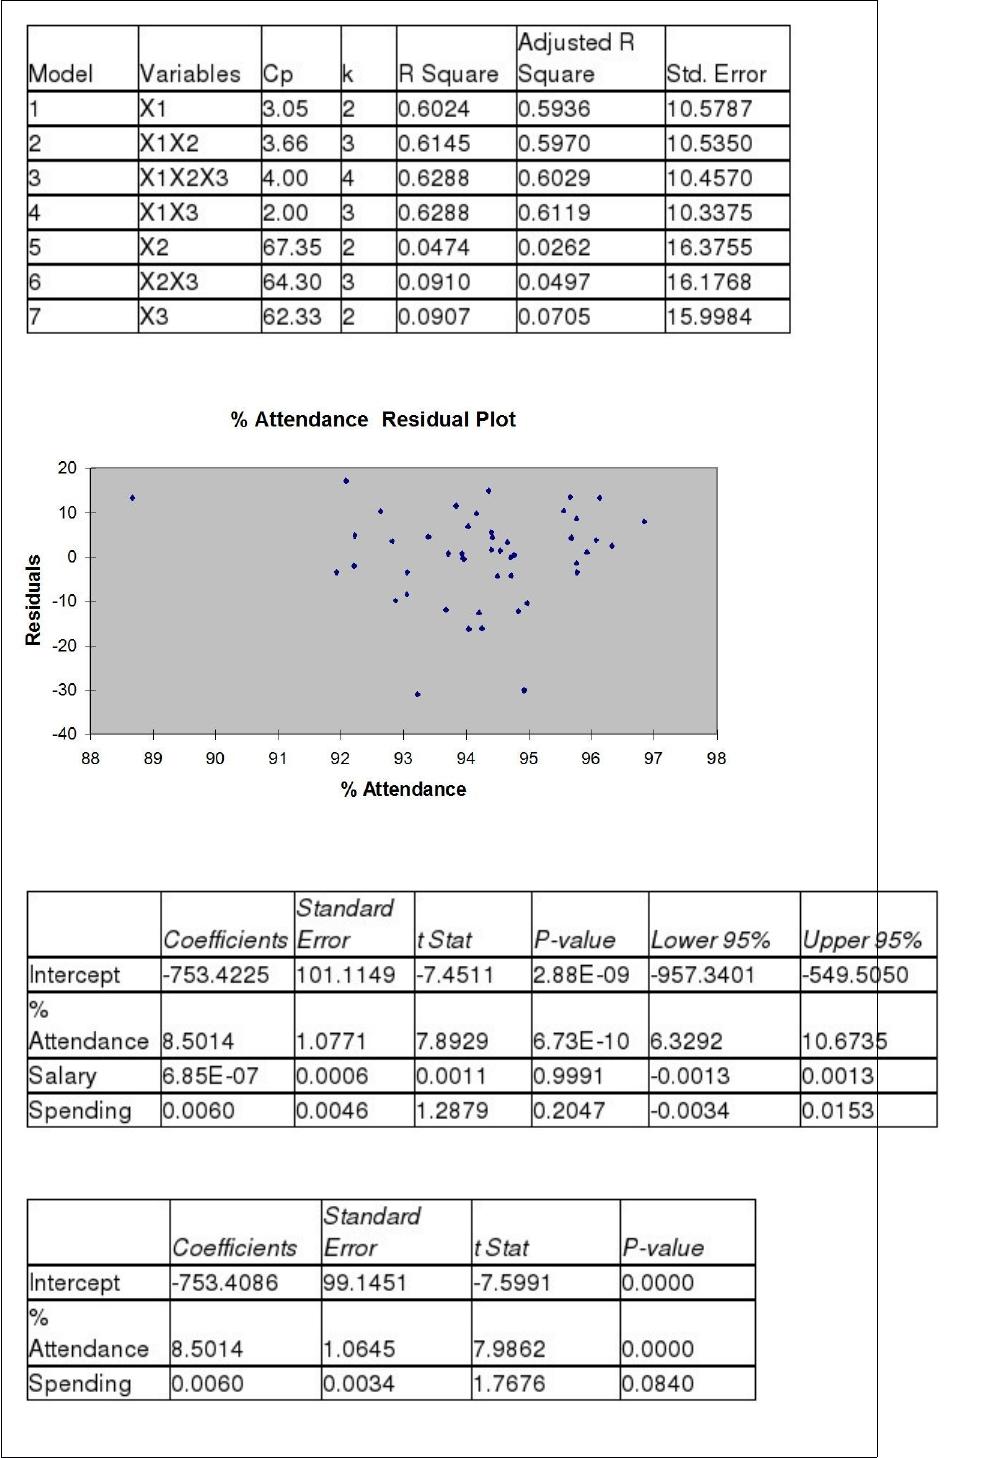
Following is the residual plot for % Attendance:
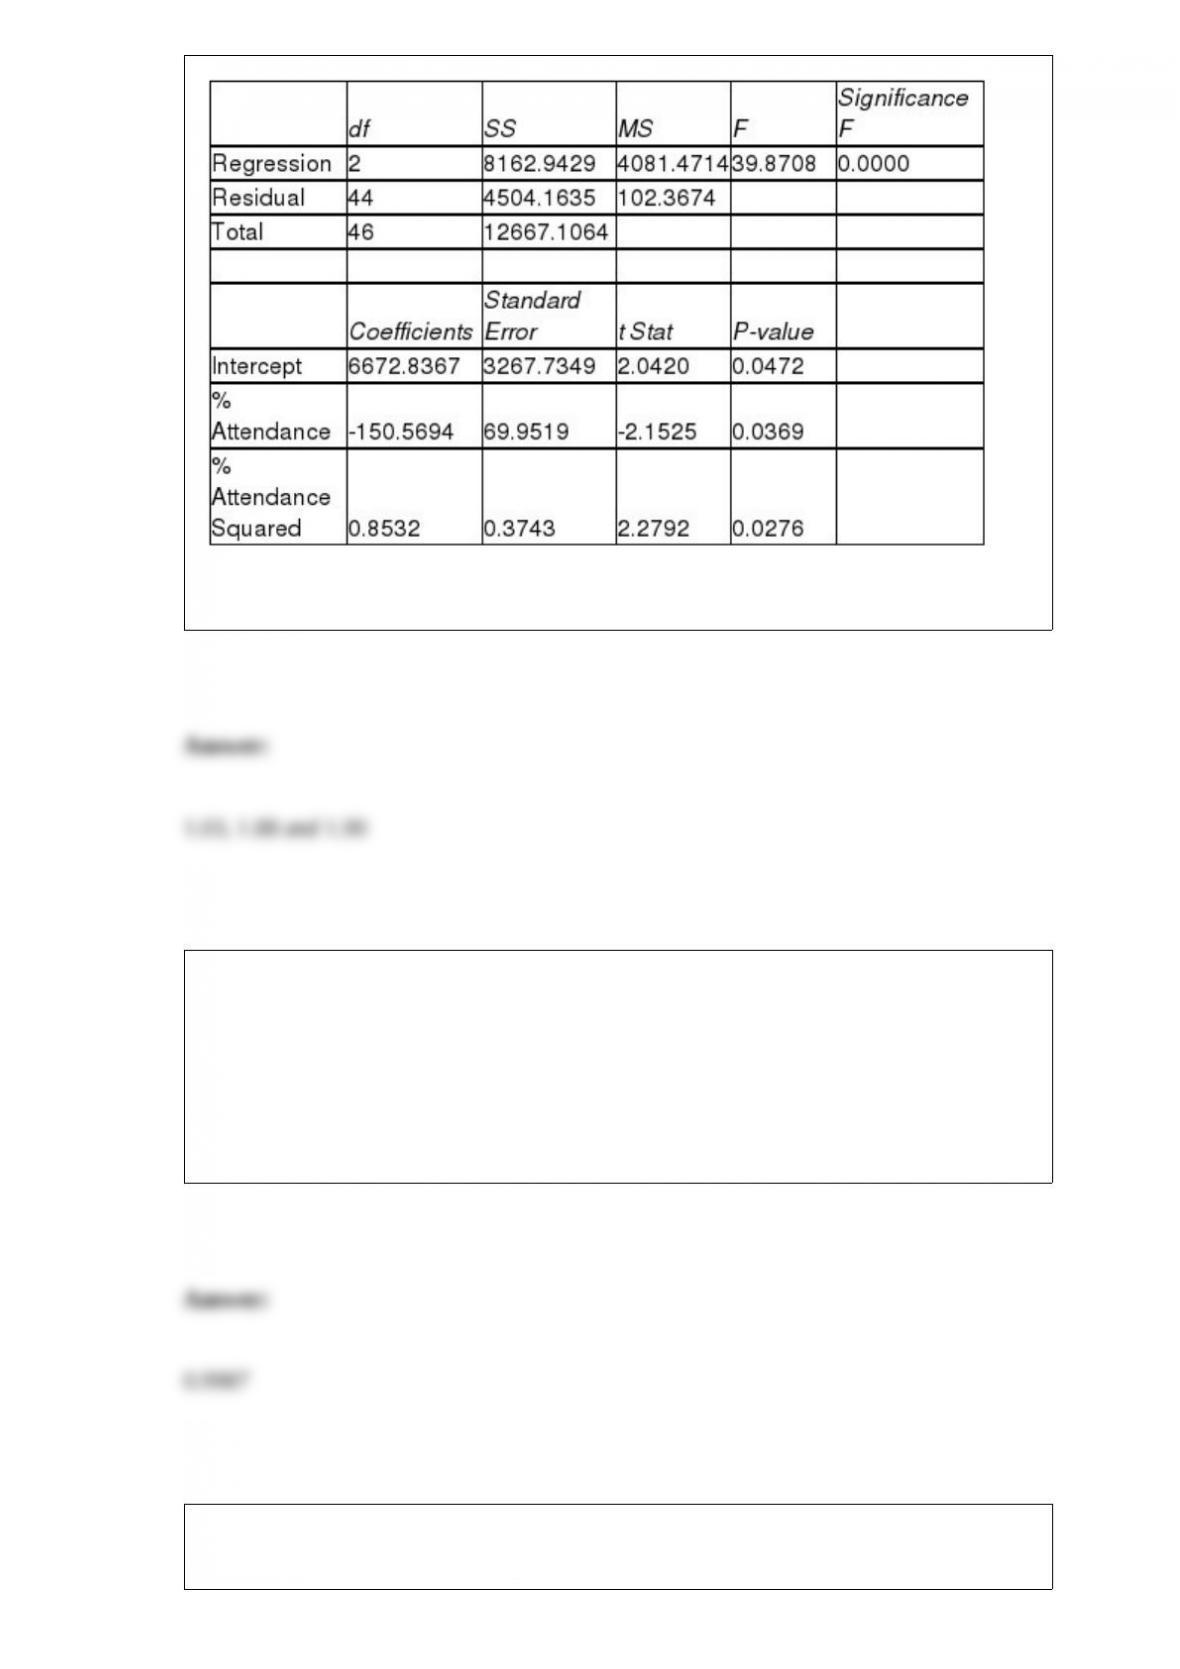
Following is the output of several multiple regression models:
Model (I):
Model (II):
Model (III):
Referring to Table 15-4, what are, respectively, the values of the variance inflationary
factor of the 3 predictors?
TABLE 6-4
The interval between consecutive hits at a website is assumed to follow an exponential
distribution with an average of 40 hits per minute.
Referring to Table 6-4, what is the probability that the next hit at the website will occur
within 10 seconds after just being hit by a visitor?
TABLE 6-4
The interval between consecutive hits at a website is assumed to follow an exponential
distribution with an average of 40 hits per minute.
Referring to Table 6-4, what is the average time between consecutive hits?
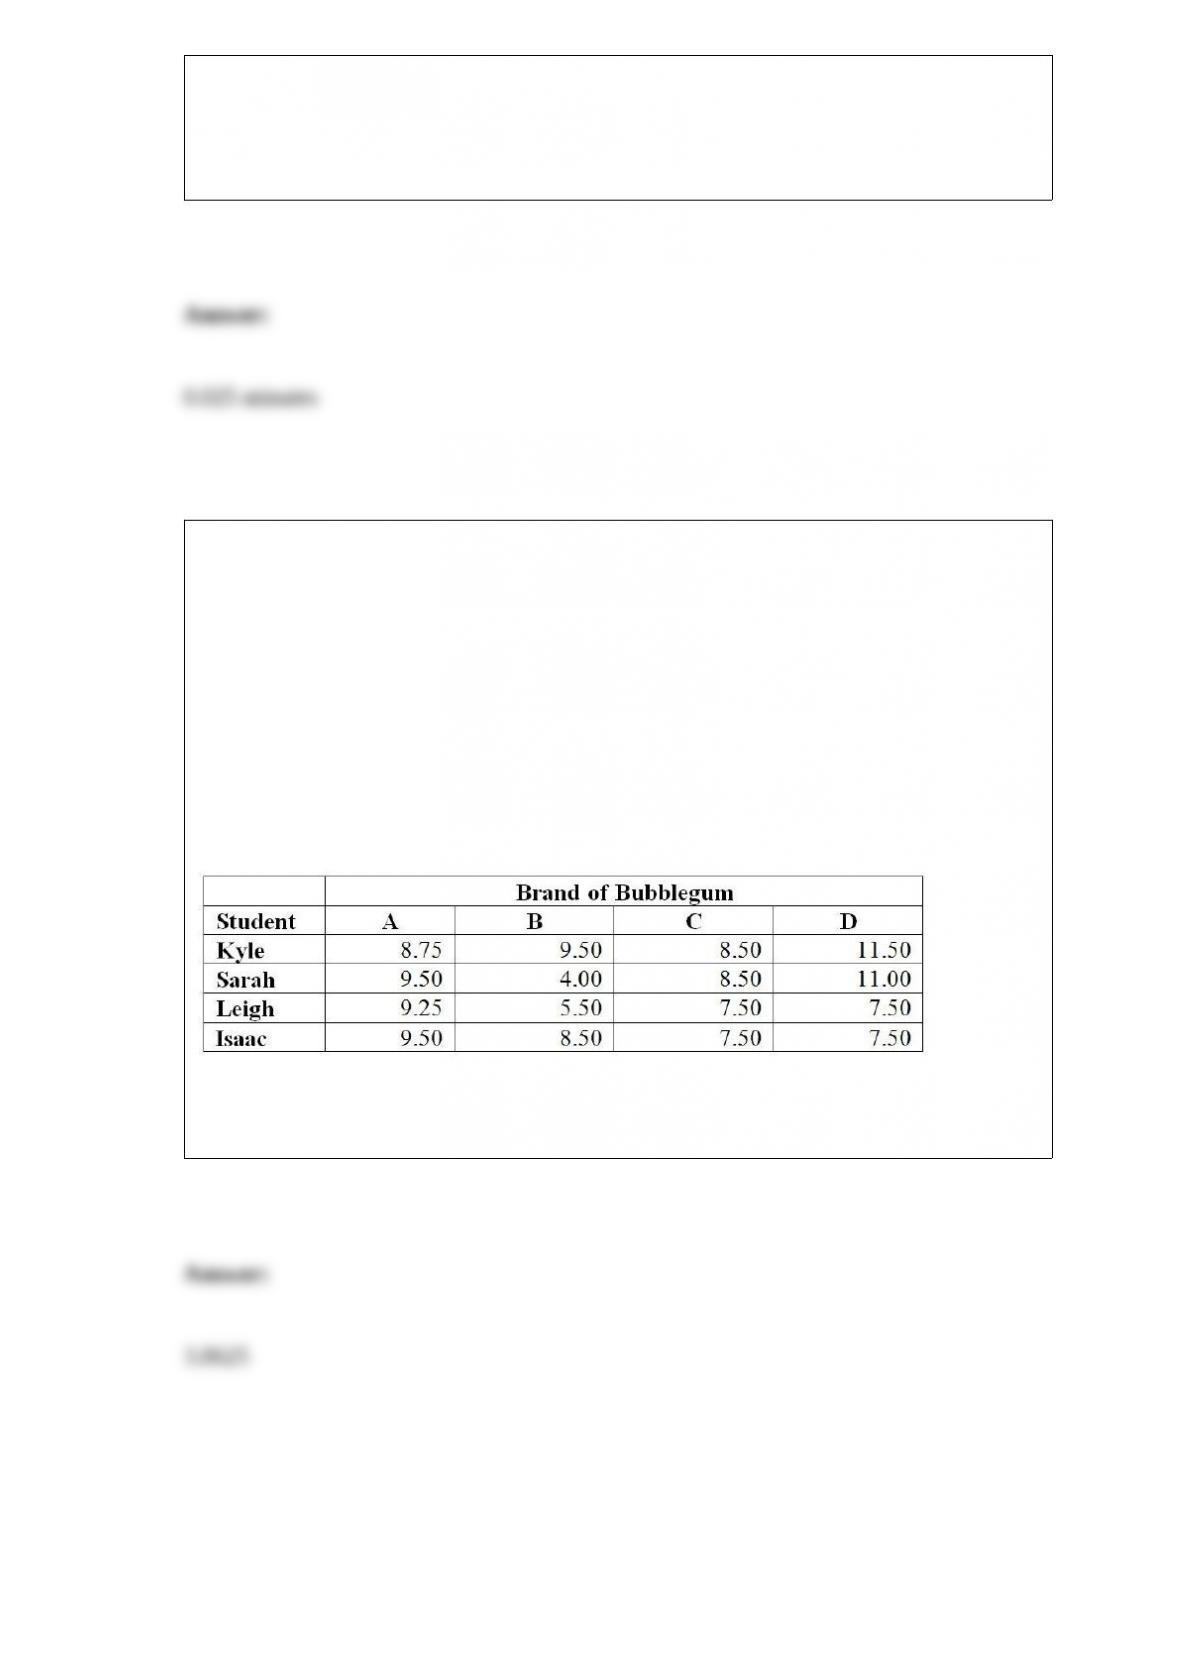
TABLE 11-11
A student team in a business statistics course designed an experiment to investigate
whether the brand of bubblegum used affected the size of bubbles they could blow. To
reduce the person-to-person variability, the students decided to use a randomized block
design using themselves as blocks.
Four brands of bubblegum were tested. A student chewed two pieces of a brand of gum
and then blew a bubble, attempting to make it as big as possible. Another student
measured the diameter of the bubble at its biggest point. The following table gives the
diameters of the bubbles (in inches) for the 16 observations.
Referring to Table 11-11, what is the critical value for testing the block effects at a 0.05
level of significance?