True or False: A sampling distribution is a distribution for a statistic.
True or False: Consider a regression in which b2 = -1.5 and the standard error of this
coefficient equals 0.3. To determine whether X2 is a significant explanatory variable,
you would compute an observed t-value of -5.0.
TABLE 15-6
Given below are results from the regression analysis on 40 observations where the
dependent variable is the number of weeks a worker is unemployed due to a layoff (Y)
and the independent variables are the age of the worker (X1), the number of years of
education received (X2), the number of years at the previous job (X3), a dummy variable
for marital status (X4: 1 = married, 0 = otherwise), a dummy variable for head of
household (X5: 1 = yes, 0 = no) and a dummy variable for management position (X6: 1
= yes, 0 = no).
The coefficient of multiple determination ( ) for the regression model using each of
the 6 variables Xj as the dependent variable and all other X variables as independent
variables are, respectively, 0.2628, 0.1240, 0.2404, 0.3510, 0.3342 and 0.0993.
The partial results from best-subset regression are given below:
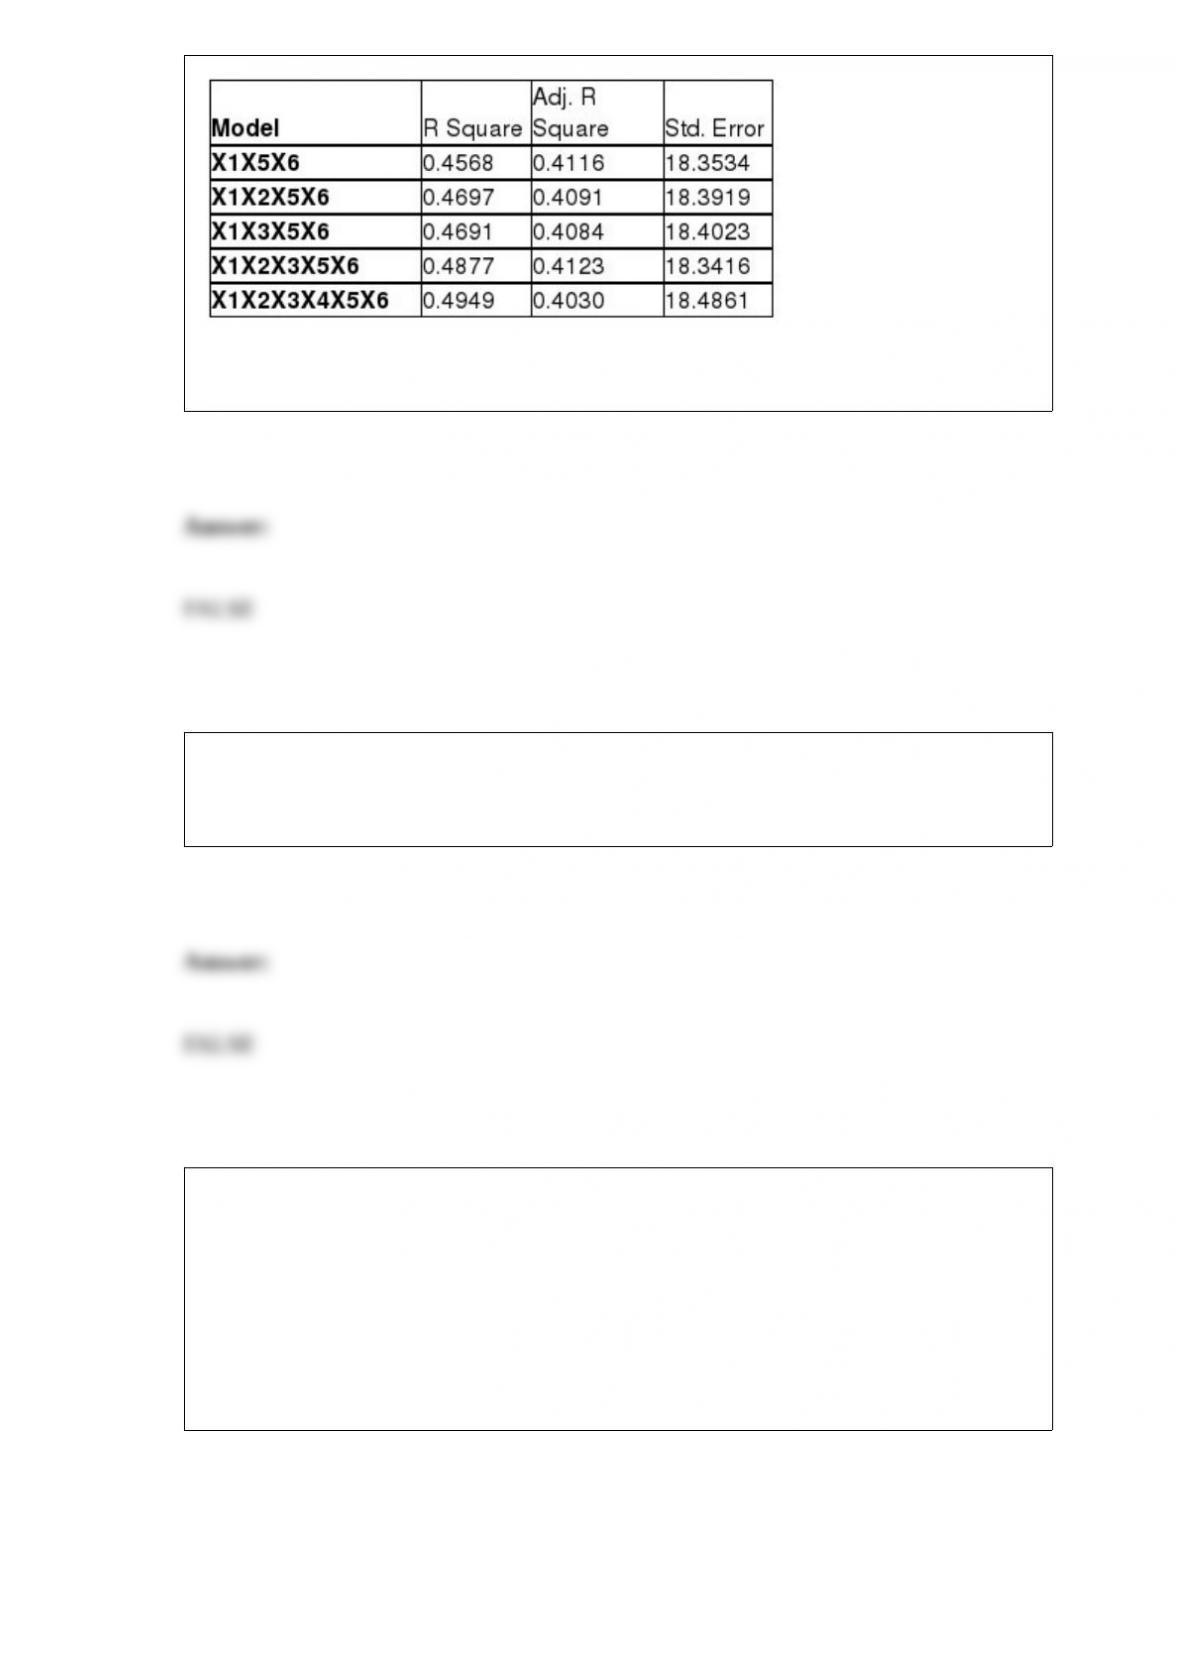
True or False: Referring to Table 15-6, the variable X2 should be dropped to remove
collinearity.
True or False: A sample of 100 fuses from a very large shipment is found to have 10
that are defective. The 95% confidence interval would indicate that, for this shipment,
the proportion of defective fuses is between 0 and 0.28.
TABLE 13-11
A computer software developer would like to use the number of downloads (in
thousands) for the trial version of his new shareware to predict the amount of revenue
(in thousands of dollars) he can make on the full version of the new shareware.
Following is the output from a simple linear regression along with the residual plot and
normal probability plot obtained from a data set of 30 different sharewares that he has
developed:
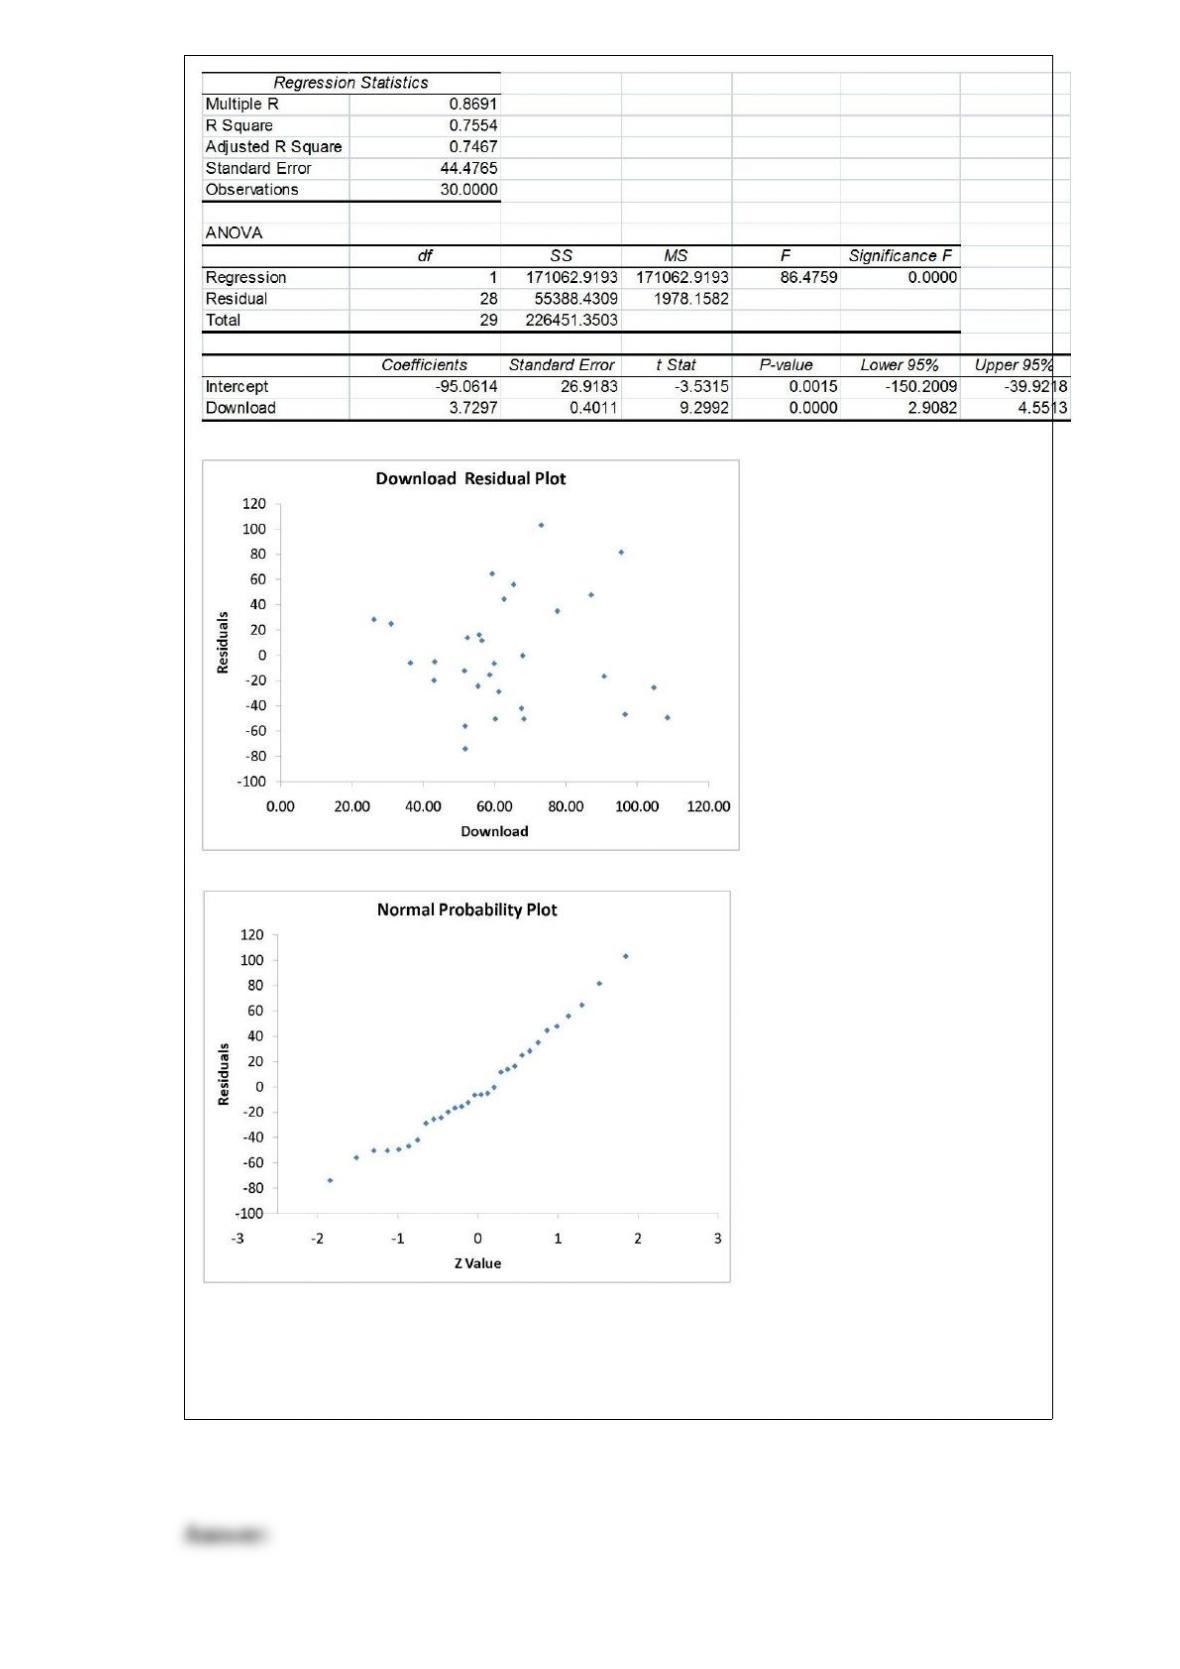
True or False: Referring to Table 13-11, the null hypothesis that there is no linear
relationship between revenue and the number of downloads should be rejected at a 5%
level of significance.
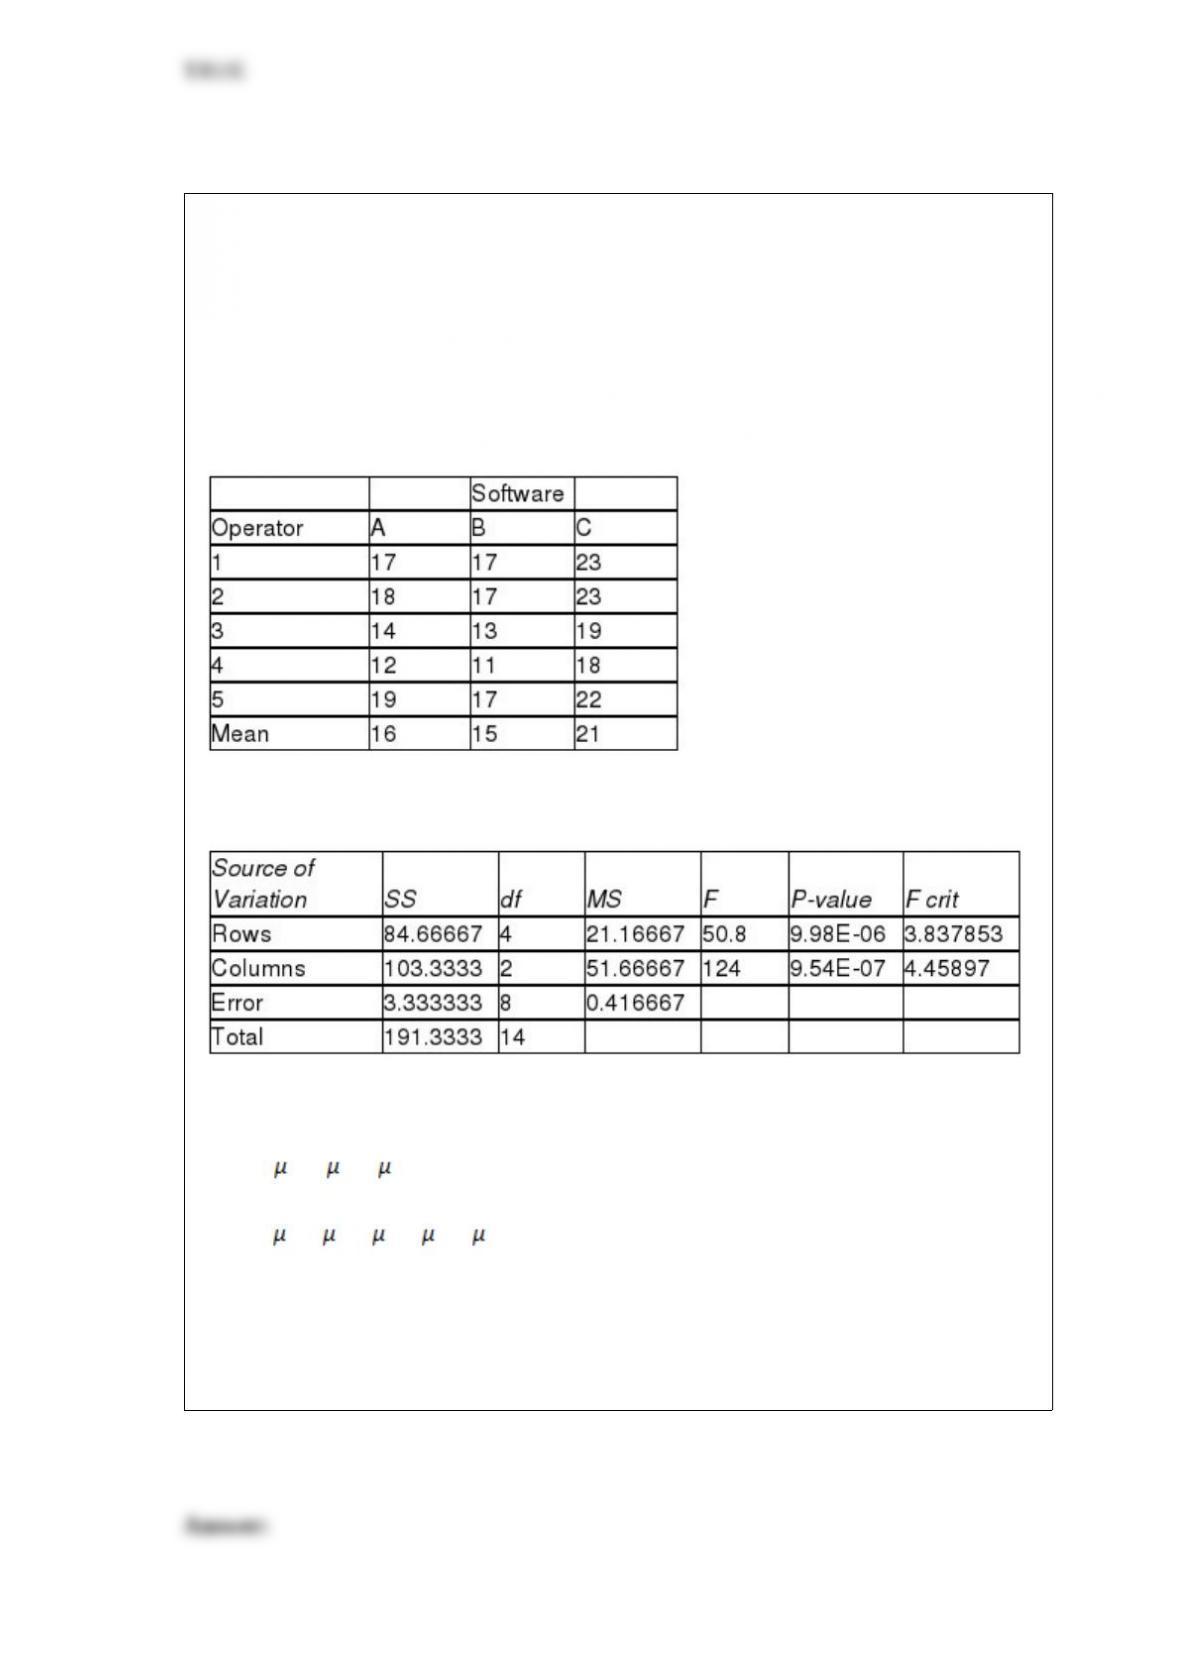
TABLE 11-8
An important factor in selecting database software is the time required for a user to
learn how to use the system. To evaluate three potential brands (A, B and C) of database
software, a company designed a test involving five different employees. To reduce
variability due to differences among employees, each of the five employees is trained
on each of the three different brands. The amount of time (in hours) needed to learn
each of the three different brands is given below:
Below is the Excel output for the randomized block design:
Referring to Table 11-8, what is the null hypothesis for testing the block effects?
A) H0 : A = B = C
B) H0 : 1 = 2 = 3 = 4 = 5
C) H0 : MA = MB = MC
D) H0 : M1 = M2 = M3 = M4 = M5
The probability of receiving a 911 call on a university campus is the same every day.
The probability of having received a 911 call on a single day does not change the
probability of receiving a 911 call on any other day. Which of the following
distributions would you use to determine the probability that a 911 call will be received
the next day?
A) Binomial distribution
B) Poisson distribution
C) Normal distribution
D) Hypergeometric distribution
TABLE 17-8
The superintendent of a school district wanted to predict the percentage of students
passing a sixth-grade proficiency test. She obtained the data on percentage of students
passing the proficiency test (% Passing), daily mean of the percentage of students
attending class (% Attendance), mean teacher salary in dollars (Salaries), and
instructional spending per pupil in dollars (Spending) of 47 schools in the state.
Following is the multiple regression output with Y = % Passing as the dependent
variable, X1 = % Attendance, X2 = Salaries and X3 = Spending:
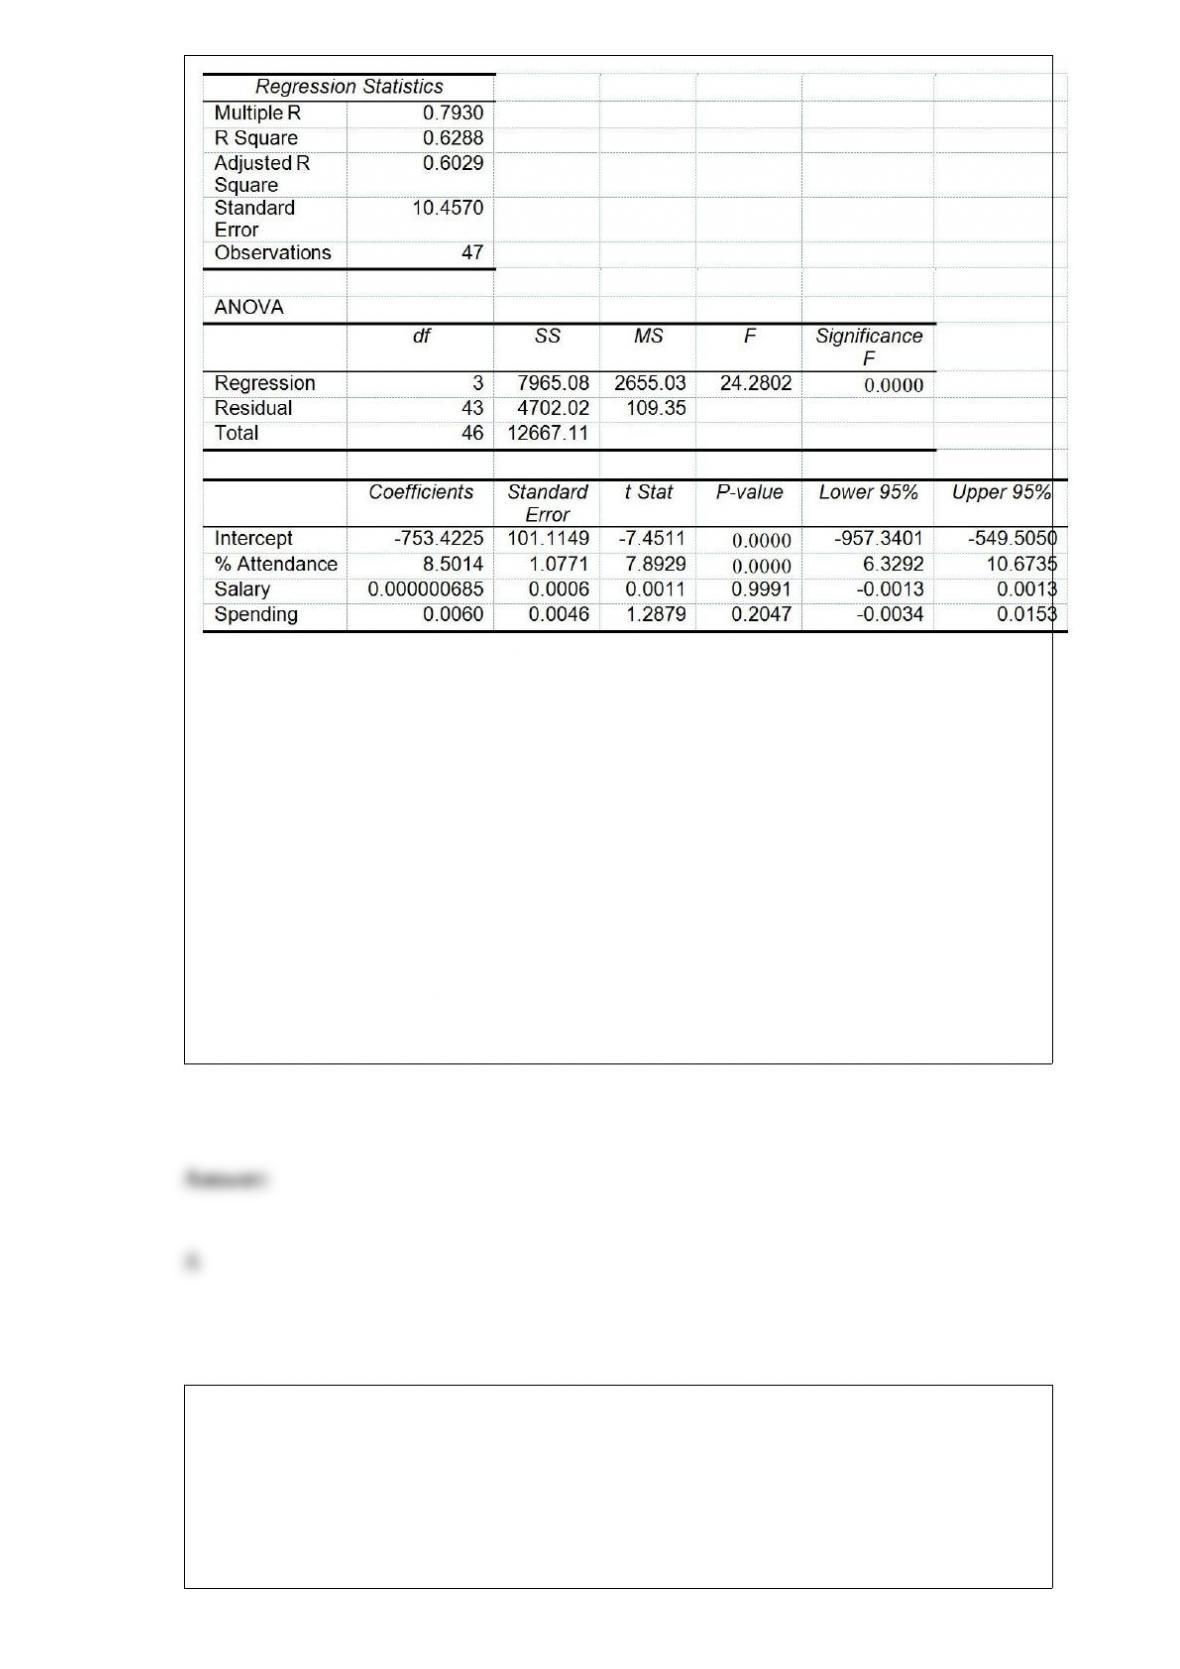
Referring to Table 17-8, which of the following is a correct statement?
A) 62.88% of the total variation in the percentage of students passing the proficiency
test can be explained by daily mean of the percentage of students attending class, mean
teacher salary, and instructional spending per pupil.
B) 62.88% of the total variation in the percentage of students passing the proficiency
test can be explained by daily mean of the percentage of students attending class, mean
teacher salary, and instructional spending per pupil after adjusting for the number of
predictors and sample size.
C) 62.88% of the total variation in the percentage of students passing the proficiency
test can be explained by daily mean of the percentage of students attending class
holding constant the effect of mean teacher salary, and instructional spending per pupil.
D) 62.88% of the total variation in the percentage of students passing the proficiency
test can be explained by daily mean of the percentage of students attending class after
adjusting for the effect of mean teacher salary, and instructional spending per pupil.
Blossom’s Flowers purchases roses for sale for Valentine’s Day. The roses are purchased
for $10 a dozen and are sold for $20 a dozen. Any roses not sold on Valentine’s Day can
be sold for $5 per dozen. The owner will purchase 1 of 3 amounts of roses for
Valentine’s Day: 100, 200, or 400 dozen roses. The number of alternatives for the
payoff table is
A) 2.

B) 3.
C) 4.
D) It cannot be determined.
Referring to Table 14-11, in terms of the βs in the model, give the
mean change in weight loss (Y) for every 1 month increase in time on
the program (X1) when not attending the morning session.
TABLE 14-11
A weight-loss clinic wants to use regression analysis to build a model
for weight loss of a client (measured in pounds). Two variables
thought to affect weight loss are client’s length of time on the
weight-loss program and time of session. These variables are
described below:
Y = Weight loss (in pounds)
X1 = Length of time in weight-loss program (in months)
X2 = 1 if morning session, 0 if not
Data for 25 clients on a weight-loss program at the clinic were
collected and used to -t the interaction model:
Y = β0 + β1X1 + β2X2 + β3X1X2 + ε
Output from Microsoft Excel follows:

A) β1
B) β1 + β2
C) β1 + β3
D) β2 + β3
If the plot of the residuals is fan shaped, which assumption is violated?
A) Normality
B) Homoscedasticity
C) Independence of errors
D) No assumptions are violated; the graph should resemble a fan
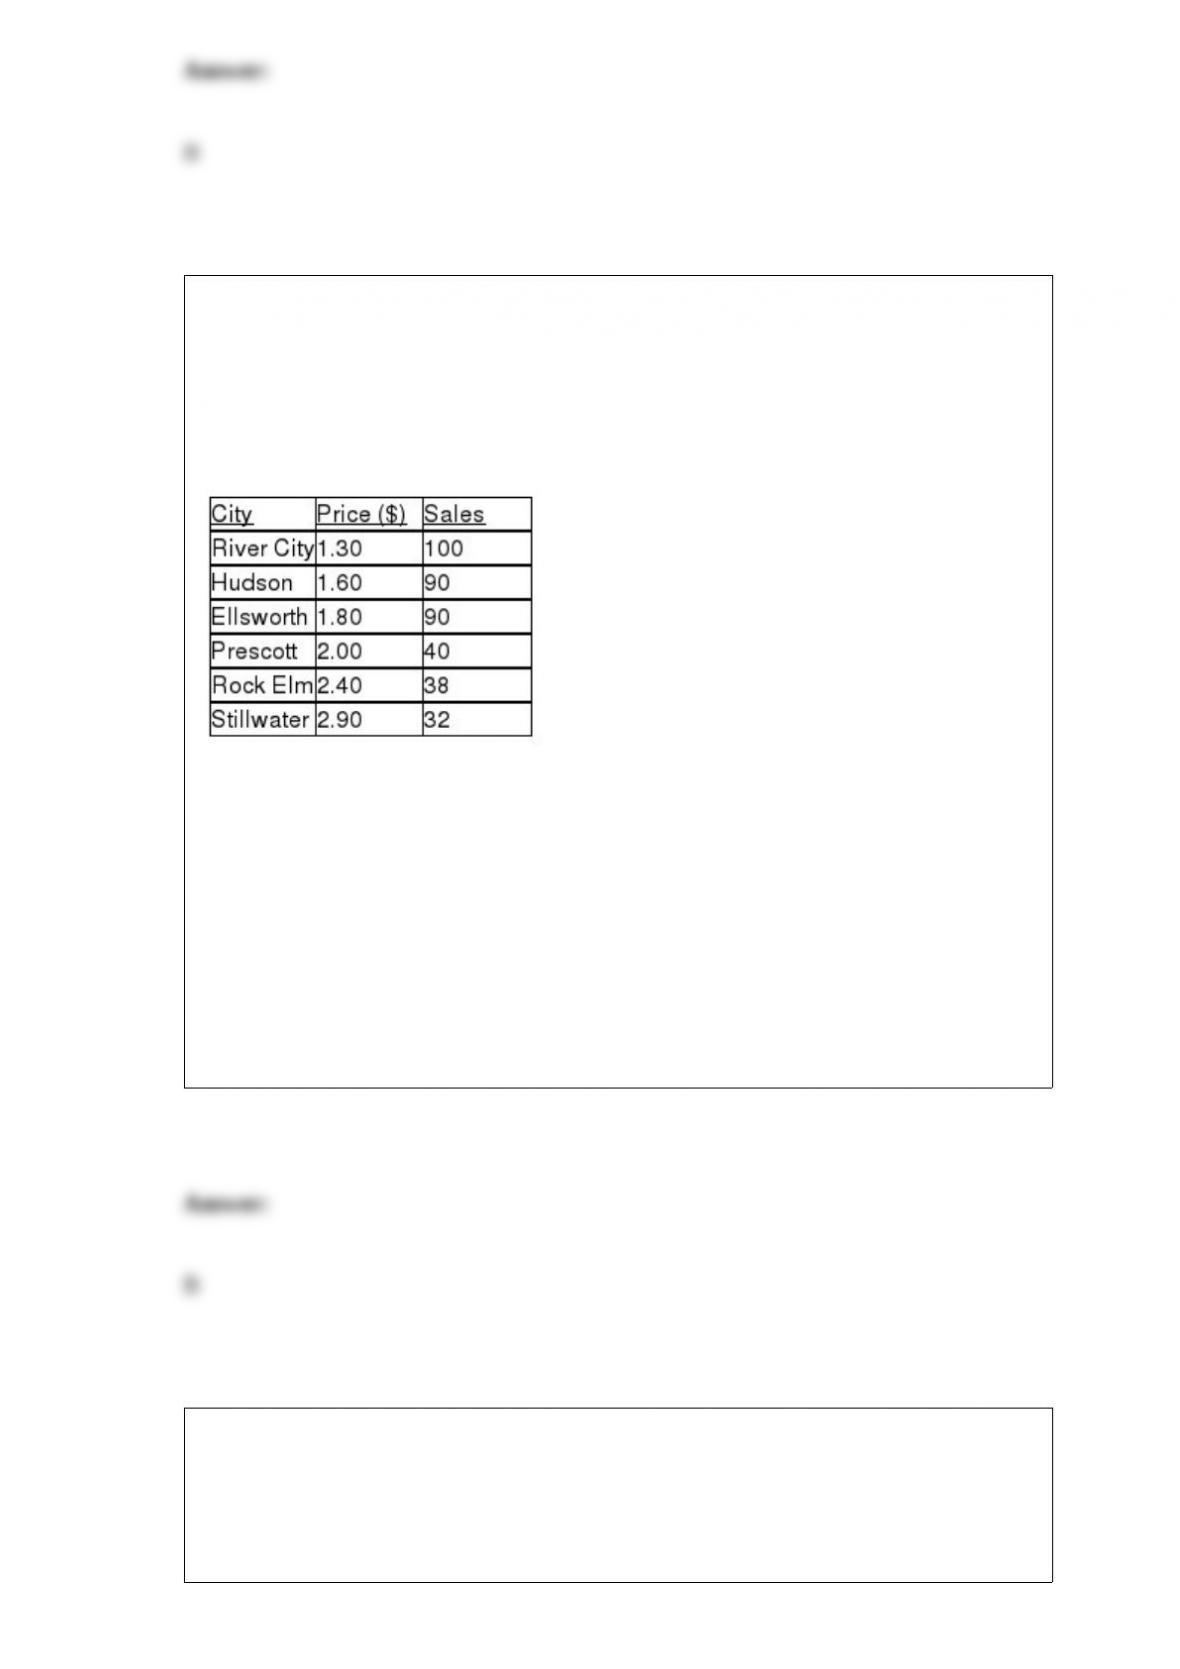
TABLE 13-2
A candy bar manufacturer is interested in trying to estimate how sales are influenced by
the price of their product. To do this, the company randomly chooses 6 small cities and
offers the candy bar at different prices. Using candy bar sales as the dependent variable,
the company will conduct a simple linear regression on the data below:
Referring to Table 13-2, if the price of the candy bar is set at $2, the estimated mean
sales will be
A) 30.
B) 65.
C) 90.
D) 100.
TABLE 17-4
You decide to predict gasoline prices in different cities and towns in the United States
for your term project. Your dependent variable is price of gasoline per gallon and your
explanatory variables are per capita income, the number of firms that manufacture
automobile parts in and around the city, the number of new business starts in the last
year, population density of the city, percentage of local taxes on gasoline, and the
number of people using public transportation. You collected data of 32 cities and
obtained a regression sum of squares SSR= 122.8821. Your computed value of standard
error of the estimate is 1.9549.
Referring to Table 17-4, if variables that measure the number of new business starts in
the last year and population density of the city were removed from the multiple
regression model, which of the following would be true?
A) The adjusted r2 will definitely increase.
B) The adjusted r2 cannot increase.
C) The coefficient of multiple determination will not increase.
D) The coefficient of multiple determination will definitely increase.
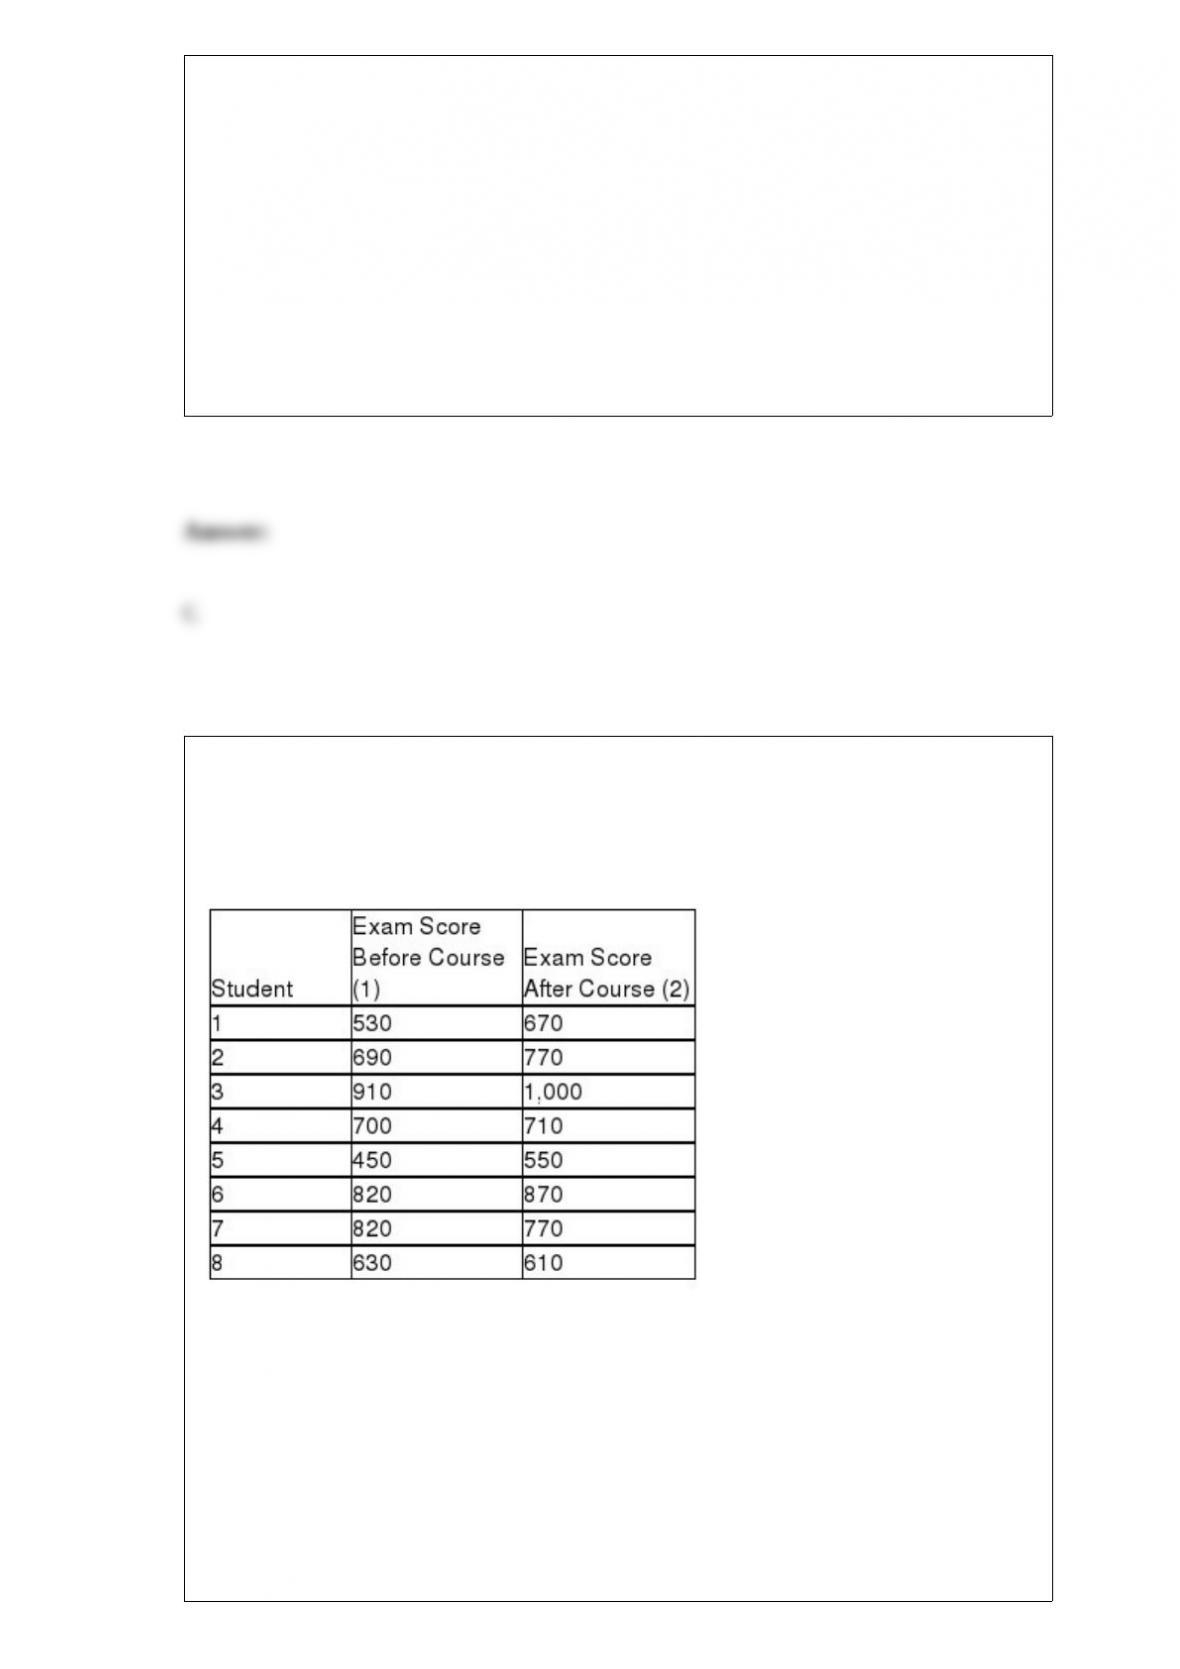
TABLE 10-5
To test the effectiveness of a business school preparation course, 8 students took a
general business test before and after the course. The results are given below.
Referring to Table 10-5, at the 0.05 level of significance, the conclusion for this
hypothesis test is that there is sufficient evidence that
A) the business school preparation course does improve exam score.
B) the business school preparation course does not improve exam score.
C) the business school preparation course has no impact on exam score.
D) No conclusion can be drawn from the information given.
The Y-intercept (b0) represents the
A) predicted value of Y when X = 0.
B) change in estimated Y per unit change in X.
C) predicted value of Y.
D) variation around the sample regression line.
A Paso Robles wine producer wanted to forecast the cases of Merlot wine sold. The
number of cases of merlot wine sold in a 28-year period was collected. Which of the
following would be the most appropriate analysis to perform?
A) The Marascuilo Procedure
B) The Tukey-Kramer Procedure
C) Least-squares forecasting with monthly or quarterly data
D) Moving averages modeling
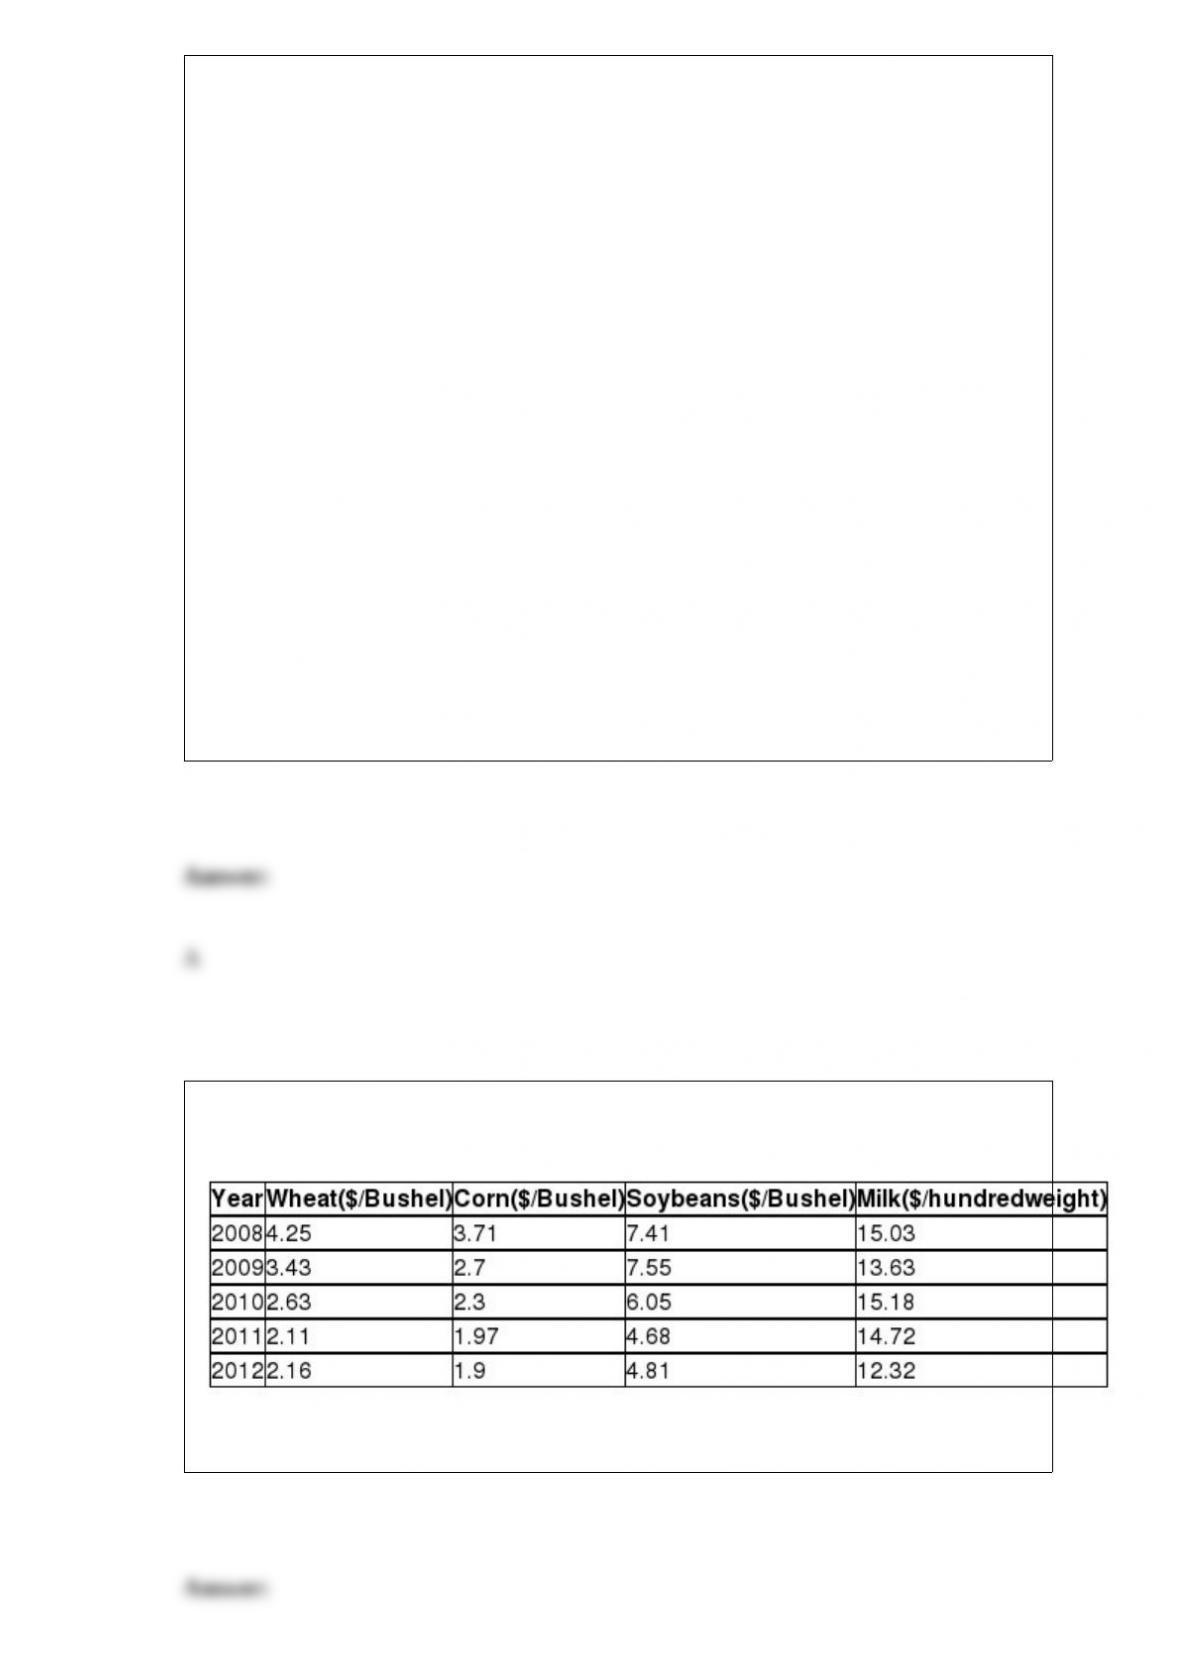
TABLE 9-9
The president of a university claimed that the entering class this year appeared to be
larger than the entering class from previous years but their mean SAT score is lower
than previous years. He took a sample of 20 of this year’s entering students and found
that their mean SAT score is 1,501 with a standard deviation of 53. The university’s
record indicates that the mean SAT score for entering students from previous years is
1,520. He wants to find out if his claim is supported by the evidence at a 5% level of
significance.
Referring to Table 9-9, which of the following best describes the Type I error?
A) The president concludes that the mean SAT score of the entering students is lower
than previous years when it is indeed not lower.
B) The president concludes that the mean SAT score of the entering students is higher
than previous years when it is indeed not higher.
C) The president concludes that the mean SAT score of the entering students is not
lower than previous years when it is indeed lower.
D) The president concludes that the mean SAT score of the entering students is not
higher than previous years when it is indeed higher.
TABLE 16-16
Given below are the prices of a basket of four food items from 2008 to 2012.
Referring to Table 16-16, what is the unweighted aggregate price index for the basket of
four food items in 2012 using 2008 as the base year?

You were told that the amount of time lapsed between consecutive trades on the New
York Stock Exchange followed a normal distribution with a mean of 15 seconds. You
were also told that the probability that the time lapsed between two consecutive trades
to fall between 16 to 17 seconds was 13%. The probability that the time lapsed between
two consecutive trades would fall below 13 seconds was 7%. What is the probability
that the time lapsed between two consecutive trades will be longer than 17 seconds?
TABLE 4-6
At a Texas college, 60% of the students are from the southern part of the state, 30% are
from the northern part of the state, and the remaining 10% are from out-of-state. All
students must take and pass an Entry
Referring to Table 4-6, if a randomly selected student has not passed the ELM, the
probability that the student is from southern Texas is ________.
Referring to Table 14-17, estimate the mean number of weeks being
unemployed due to a layo$ for a worker who is a thirty-year-old and is
a manager.
TABLE 14-17
Given below are results from the regression analysis where the
dependent variable is the number of weeks a worker is unemployed

due to a layo$ (Unemploy) and the independent variables are the age
of the worker (Age) and a dummy variable for management position
(Manager: 1 = yes, 0 = no).
The results of the regression analysis are given below:
TABLE 11-9
The marketing manager of a company producing a new cereal aimed for children wants
to examine the effect of the color and shape of the box’s logo on the approval rating of
the cereal. He combined 4 colors and 3 shapes to produce a total of 12 designs. Each
logo was presented to 2 different groups (a total of 24 groups) and the approval rating
for each was recorded and is shown below. The manager analyzed these data using the
α = 0.05 level of significance for all inferences.
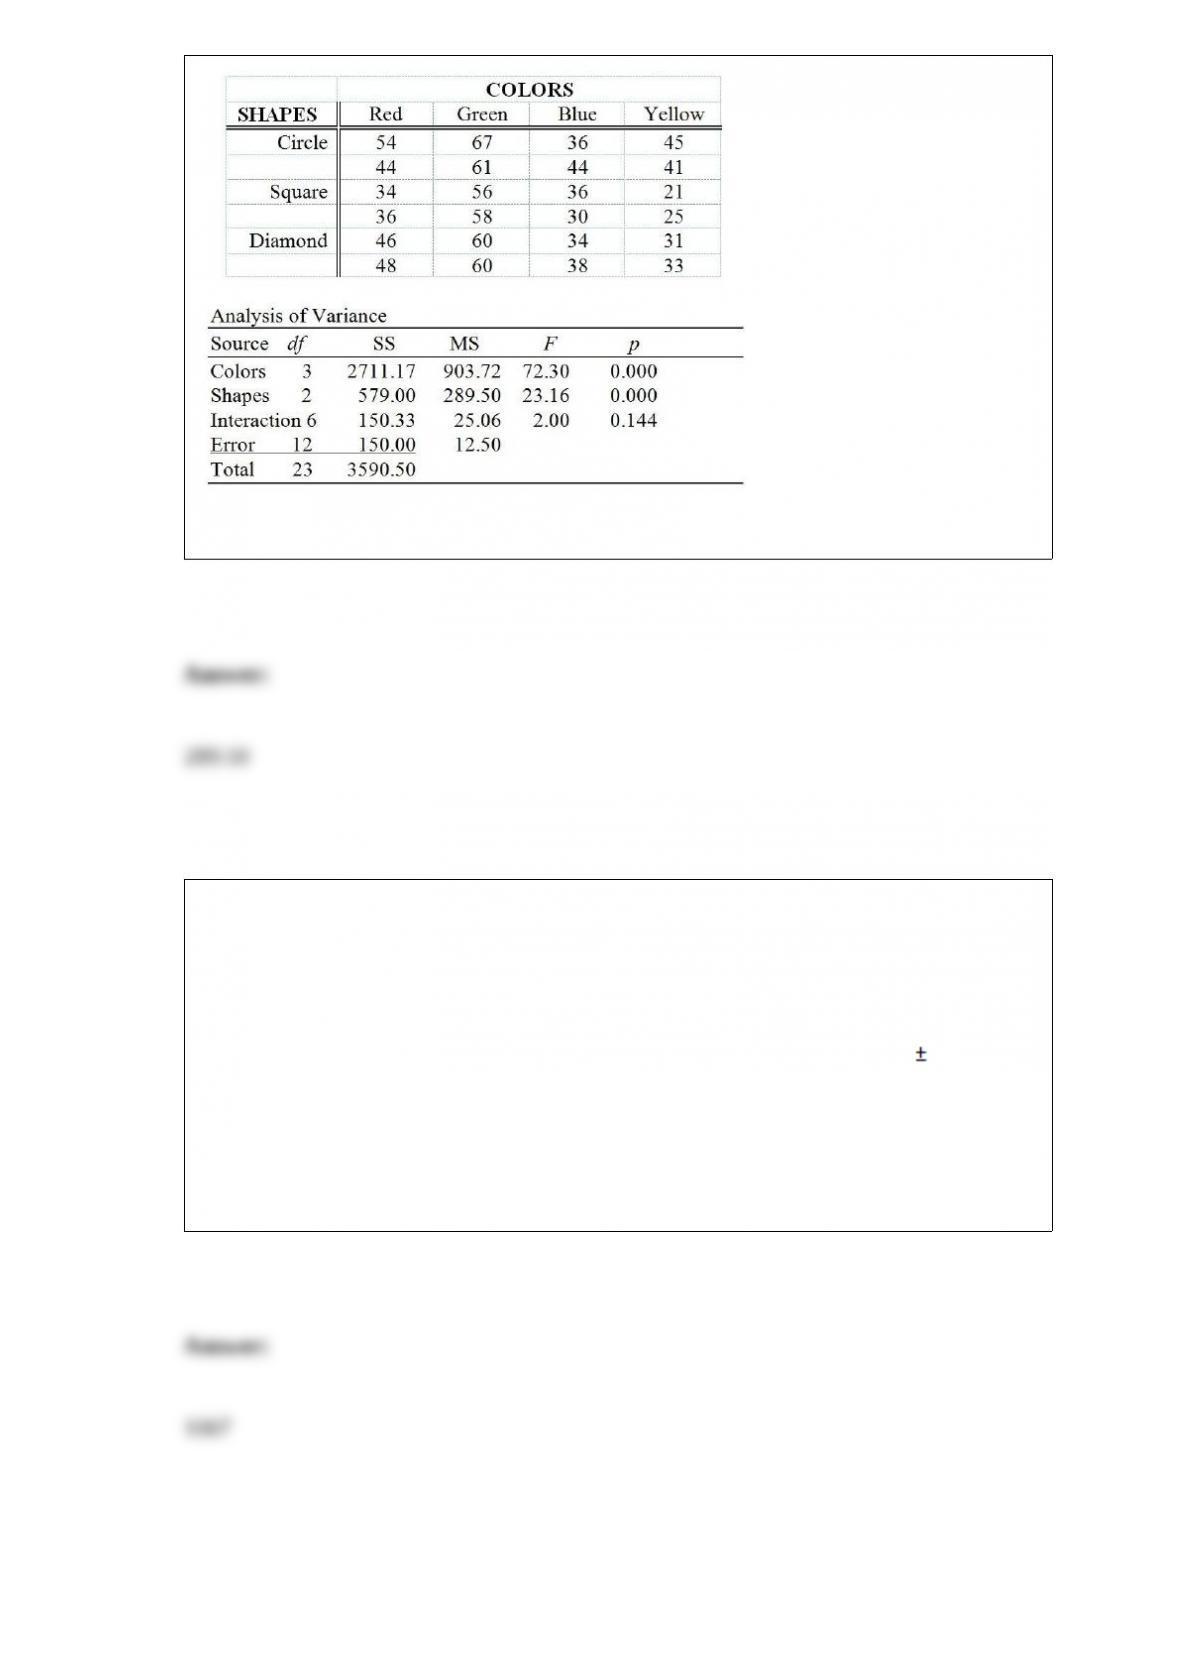
Referring to Table 11-9, the mean square for the factor shape is ________.
TABLE 8-11
A poll was conducted by the marketing department of a video game company to
determine the popularity of a new game that was targeted to be launched in three
months. Telephone interviews with 1,500 young adults were conducted which revealed
that 49% said they would purchase the new game. The margin of error was 3
percentage points.
Referring to Table 8-11, what is the needed sample size to obtain a 95% confidence
interval estimate of the percentage of the targeted young adults who will purchase the
new game by allowing the same level of margin of error?