True or False: TABLE 17-10
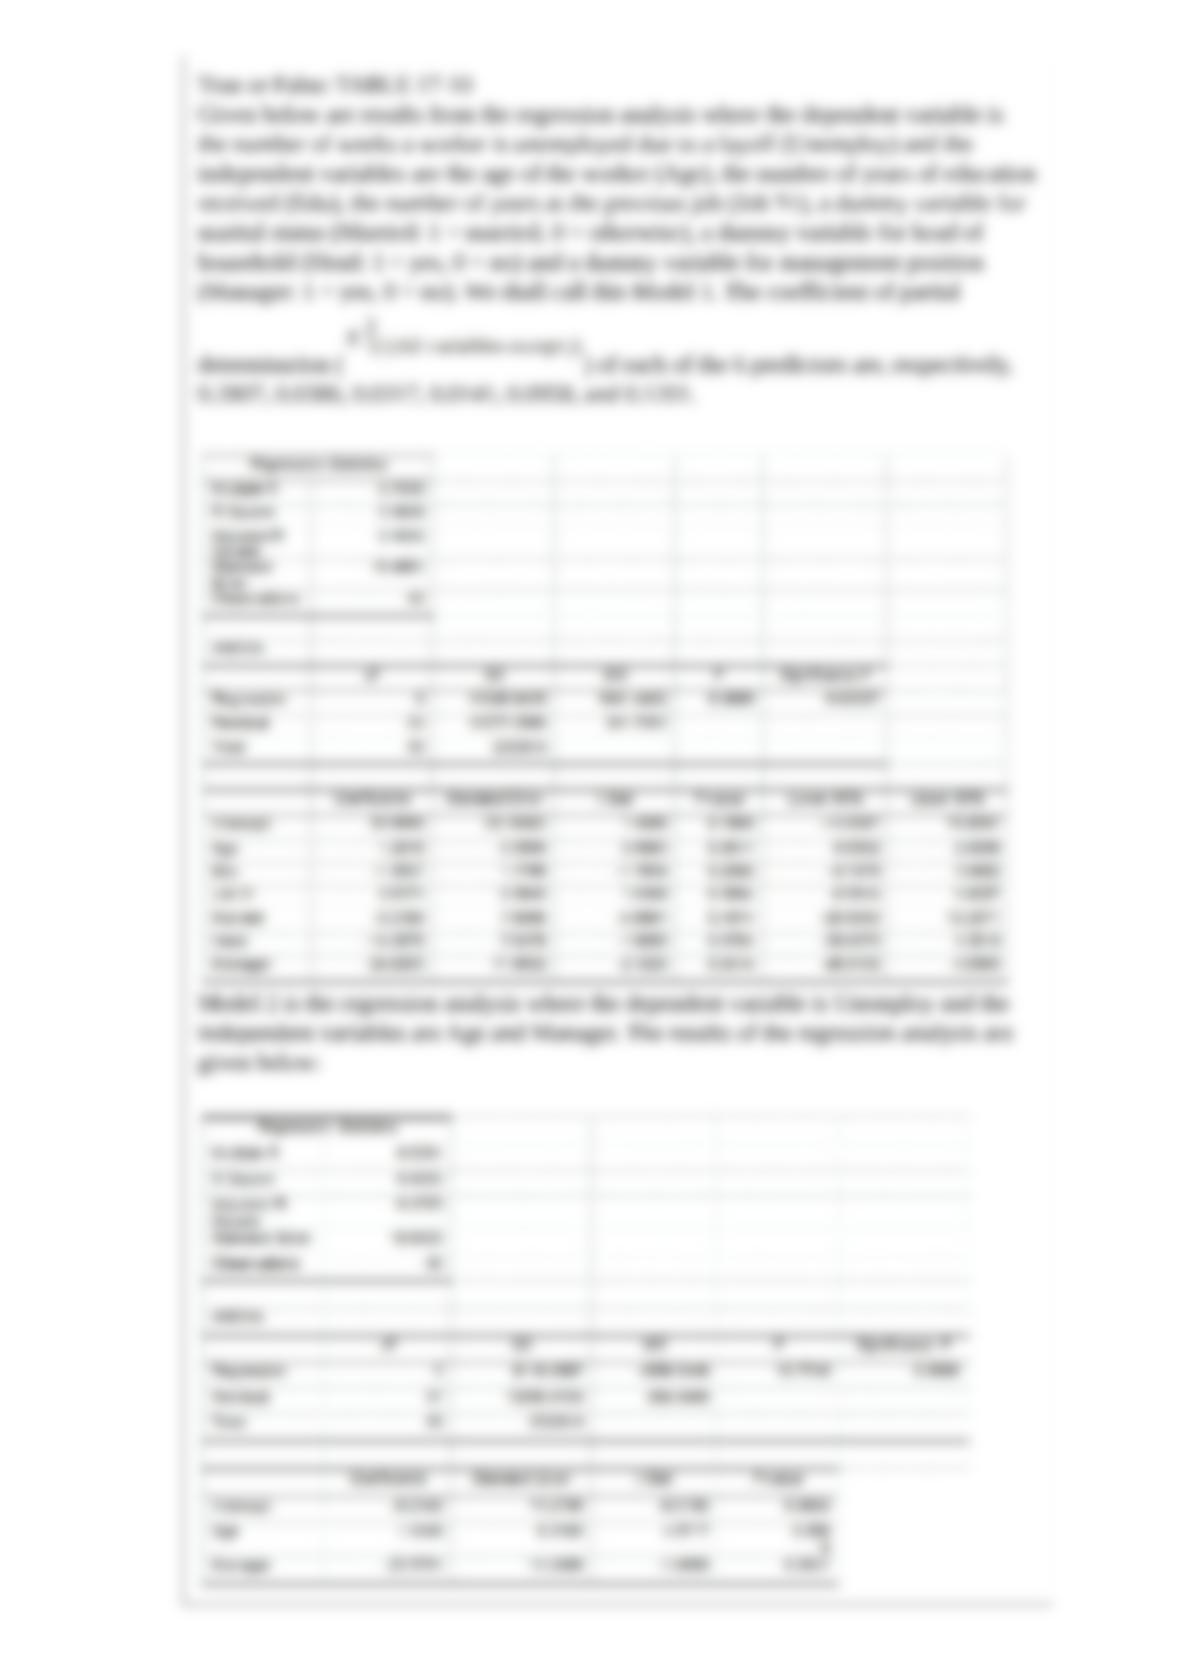
Given below are results from the regression analysis where the dependent variable is
the number of weeks a worker is unemployed due to a layoff (Unemploy) and the
independent variables are the age of the worker (Age), the number of years of education
received (Edu), the number of years at the previous job (Job Yr), a dummy variable for
marital status (Married: 1 = married, 0 = otherwise), a dummy variable for head of
household (Head: 1 = yes, 0 = no) and a dummy variable for management position
(Manager: 1 = yes, 0 = no). We shall call this Model 1. The coefficient of partial
determination ( ) of each of the 6 predictors are, respectively,
0.2807, 0.0386, 0.0317, 0.0141, 0.0958, and 0.1201.
Model 2 is the regression analysis where the dependent variable is Unemploy and the
independent variables are Age and Manager. The results of the regression analysis are
given below:
Referring to Table 17-10, Model 1, the null hypothesis H0 : β1 = β2= β3 = β4 = β5 = β6
= 0 implies that the number of weeks a worker is unemployed due to a layoff is not
related to one of the explanatory variables.
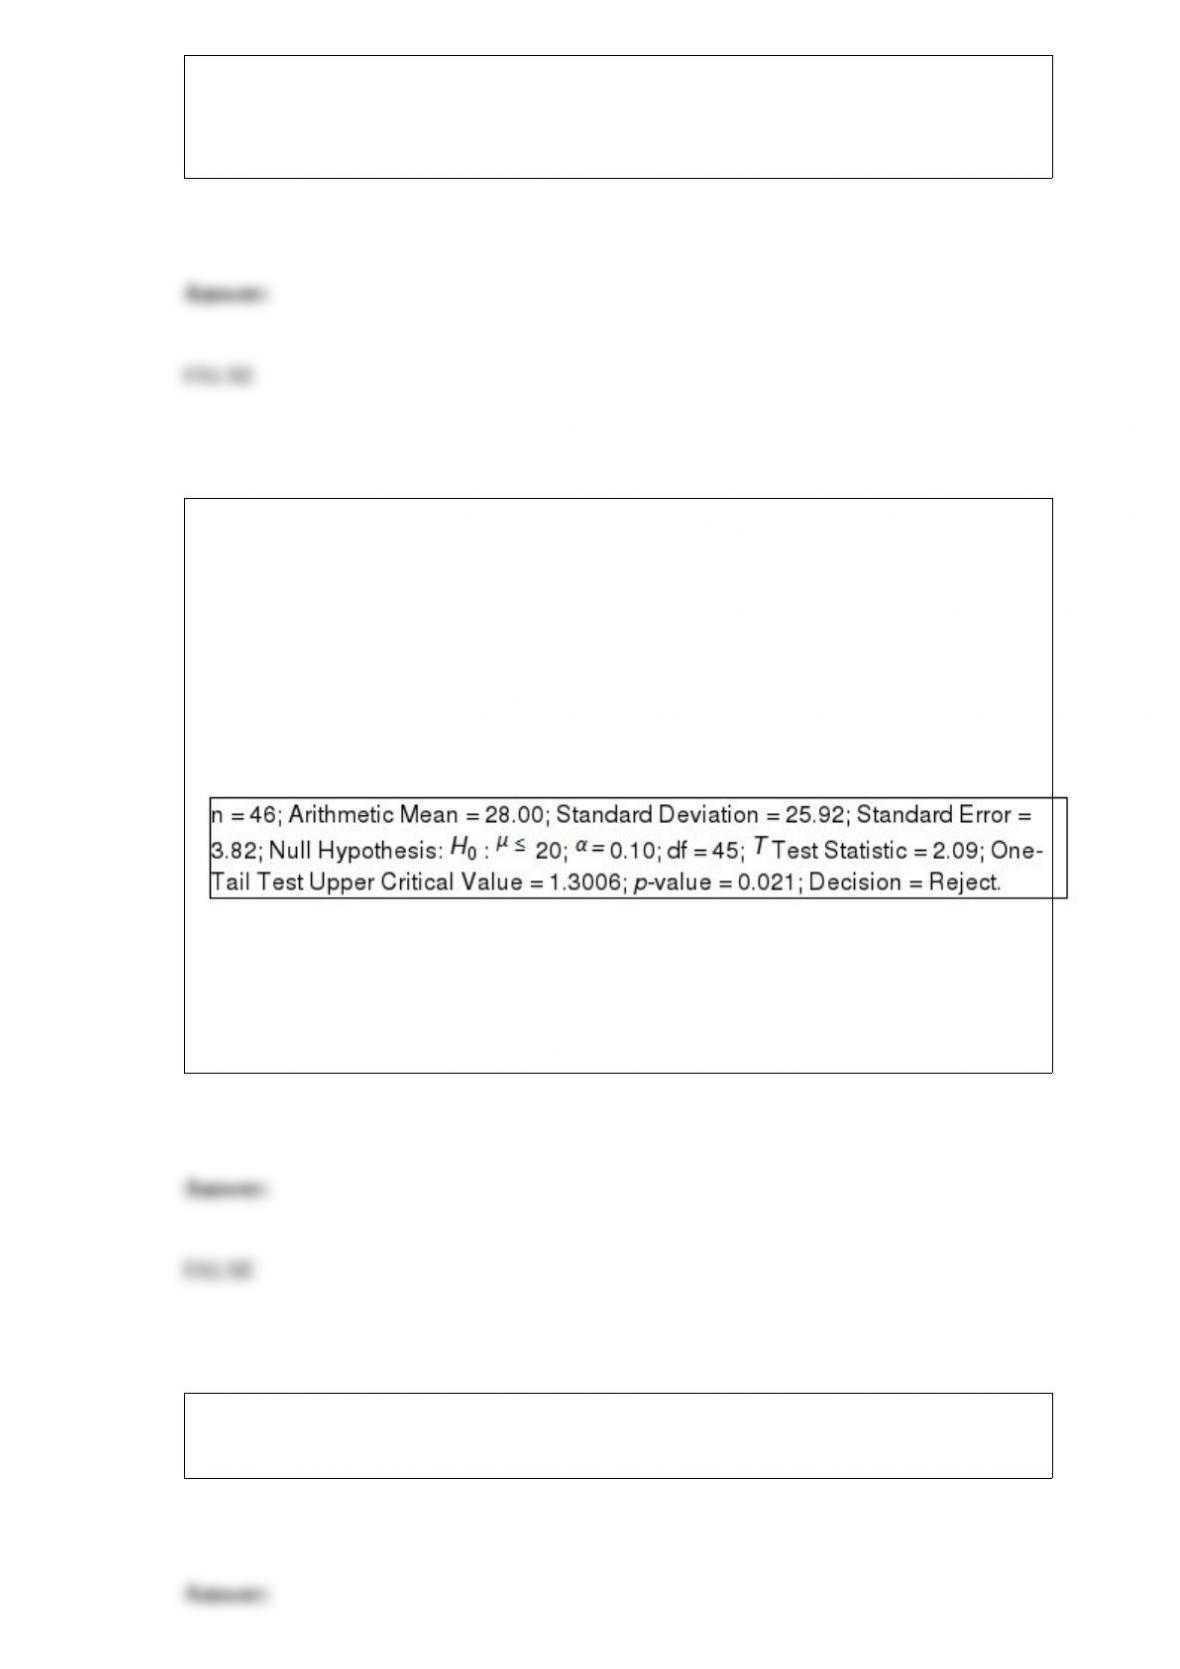
TABLE 9-1
Microsoft Excel was used on a set of data involving the number of defective items
found in a random sample of 46 cases of light bulbs produced during a morning shift at
a plant. A manager wants to know if the mean number of defective bulbs per case is
greater than 20 during the morning shift. She will make her decision using a test with a
level of significance of 0.10. The following information was extracted from the
Microsoft Excel output for the sample of 46 cases:
True or False: Referring to Table 9-1, the manager can conclude that there is sufficient
evidence to show that the mean number of defective bulbs per case is greater than 20
during the morning shift with no more than a 1% probability of incorrectly rejecting the
true null hypothesis.
True or False: The interpretation of the slope is different in a multiple linear regression
model as compared to a simple linear regression model.

TABLE 14-15
The superintendent of a school district wanted to predict the
percentage of students passing a sixth-grade proficiency test. She
obtained the data on percentage of students passing the proficiency
test (% Passing), mean teacher salary in thousands of dollars
(Salaries), and instructional spending per pupil in thousands of dollars
(Spending) of 47 schools in the state.
Following is the multiple regression output with Y = % Passing as the
dependent variable, X1 = Salaries and X2 = Spending:
True or False: Referring to Table 14-15, there is suffcient evidence
that the percentage of students passing the proficiency test depends
on at least one of the explanatory variables at a 5% level of
significance.

TABLE 8-8
The president of a university would like to estimate the proportion of the student
population that owns a personal computer. In a sample of 500 students, 417 own a
personal computer.
True or False: Referring to Table 8-8, it is possible that the 99% confidence interval
calculated from the data will not contain the proportion of the student population who
own a personal computer.
You have collected information on the consumption by the 15 largest coffee-consuming
nations. Which of the following is the best for presenting the shares of the
consumption?
A) a pie chart
B) a Pareto chart
C) a side-by-side bar chart
D) a contingency table
According to the Chebyshev rule, at least what percentage of the observations in any
data set are contained within a distance of 3 standard deviations around the mean?
A) 67%
B) 75%
C) 88.89%
D) 99.7%
True or False: Histograms are used for numerical data while bar charts are suitable for
categorical data.
TABLE 16-14
A contractor developed a multiplicative time-series model to forecast the number of
contracts in future quarters, using quarterly data on number of contracts during the
3-year period from 2010 to 2012. The following is the resulting regression equation:
ln = 3.37 + 0.117 X – 0.083 1 + 1.28 2 + 0.617 3
where is the estimated number of contracts in a quarter
X is the coded quarterly value with X = 0 in the first quarter of 2010
1 is a dummy variable equal to 1 in the first quarter of a year and 0 otherwise
2 is a dummy variable equal to 1 in the second quarter of a year and 0 otherwise
3 is a dummy variable equal to 1 in the third quarter of a year and 0 otherwise
Referring to Table 16-14, using the regression equation, which of the following values
is the best forecast for the number of contracts in the second quarter of 2014?
A) 144,212
B) 391,742
C) 1,238,797
D) 4,355,119
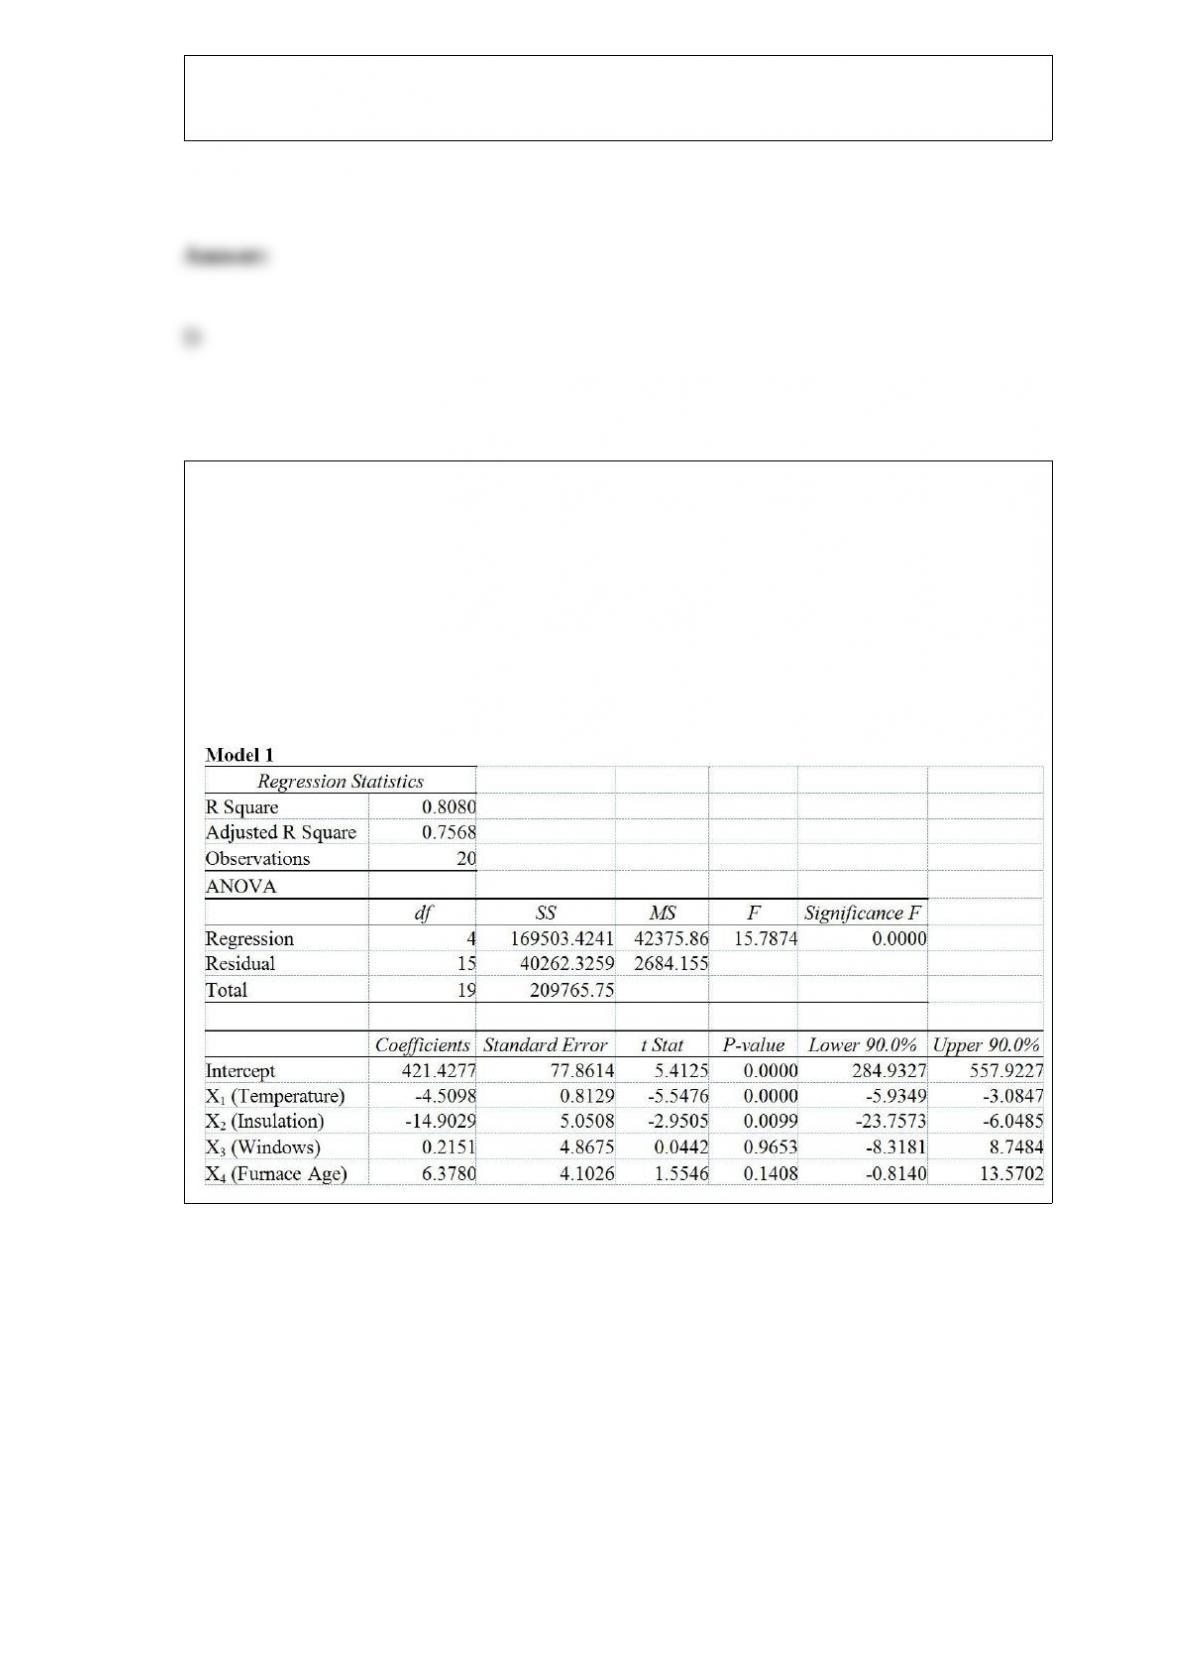
TABLE 17-2
One of the most common questions of prospective house buyers pertains to the cost of
heating in dollars (Y). To provide its customers with information on that matter, a large
real estate firm used the following 4 variables to predict heating costs: the daily
minimum outside temperature in degrees of Fahrenheit (X1), the amount of insulation in
inches (X2), the number of windows in the house (X3), and the age of the furnace in
years (X4). Given below are the EXCEL outputs of two regression models.
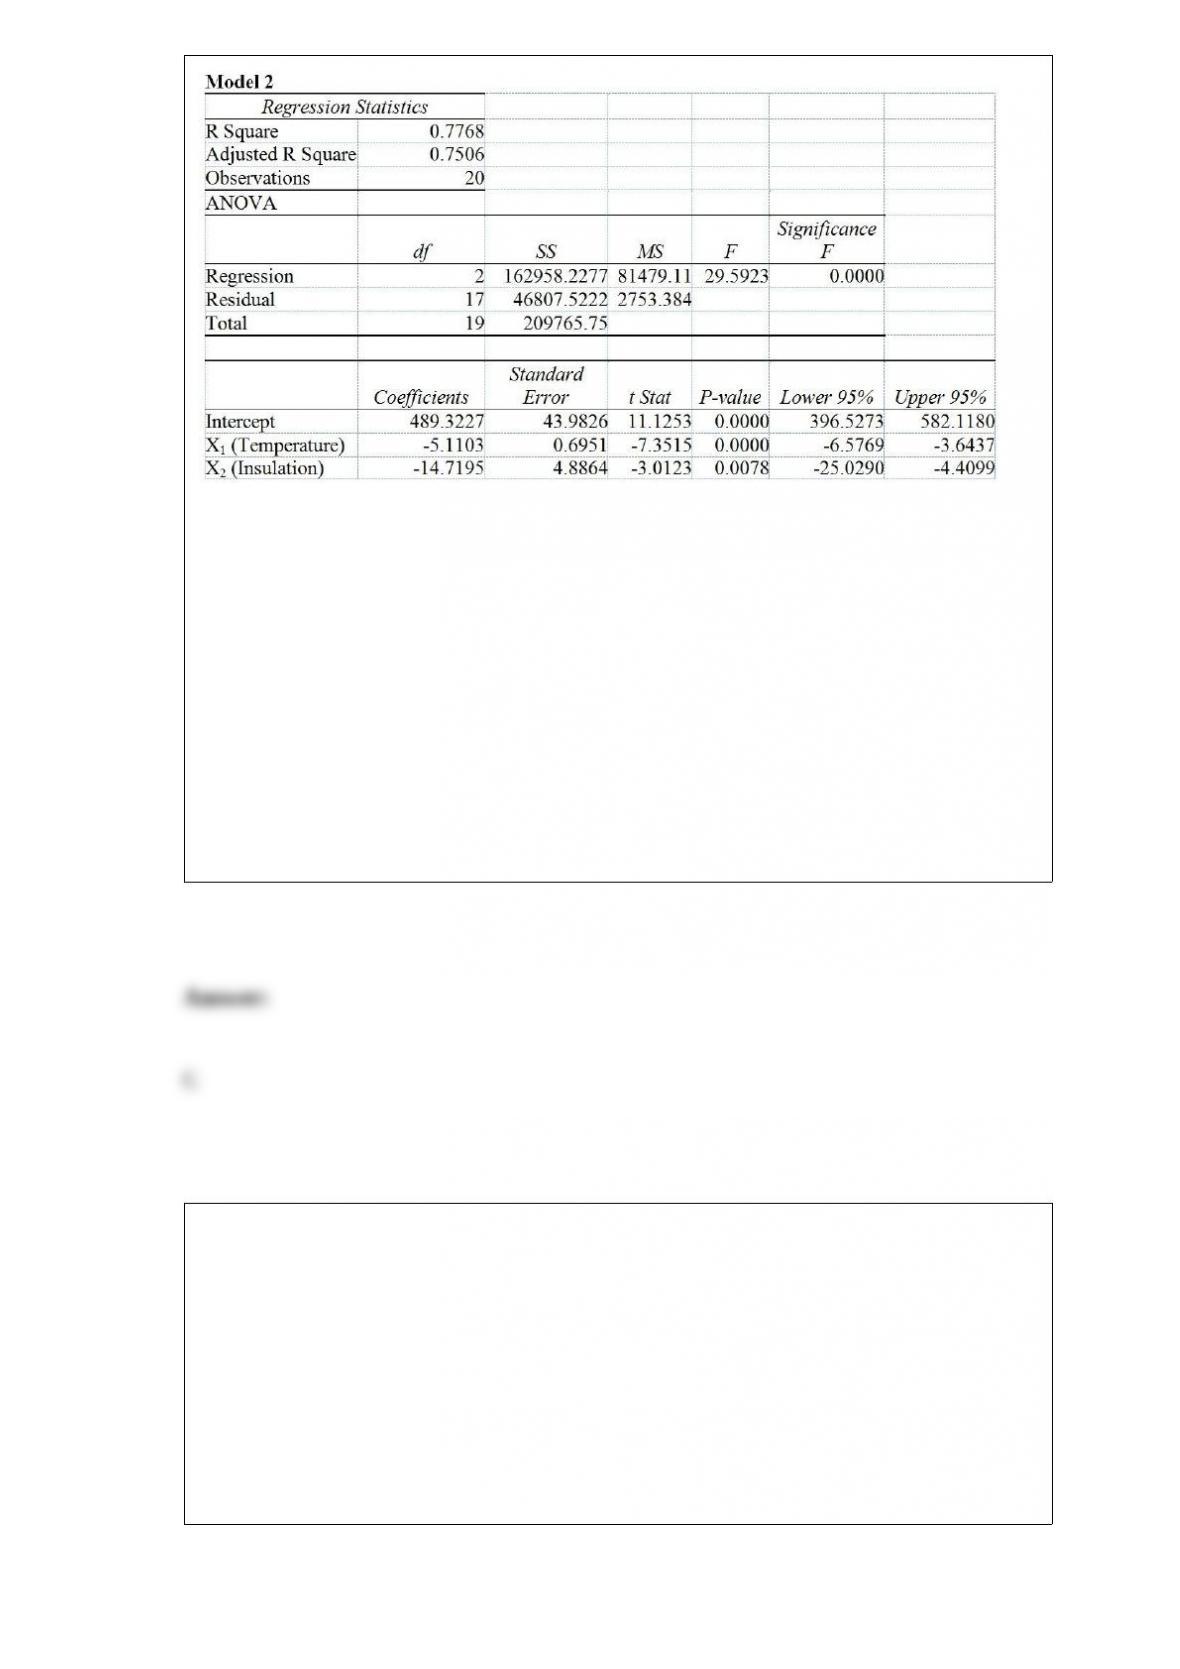
Referring to Table 17-2, what can we say about Model 1?
A) The model explains 77.7% of the sample variability of heating costs; after correcting
for the degrees of freedom, the model explains 75.1% of the sample variability of
heating costs.
B) The model explains 75.1% of the sample variability of heating costs; after correcting
for the degrees of freedom, the model explains 77.7% of the sample variability of
heating costs.
C) The model explains 80.8% of the sample variability of heating costs; after correcting
for the degrees of freedom, the model explains 75.7% of the sample variability of
heating costs.
D) The model explains 75.7% of the sample variability of heating costs; after correcting
for the degrees of freedom, the model explains 80.8% of the sample variability of
heating costs.
A company selling apparel online sends out emails every Monday to all its customers
who made a purchase. This is an example of a
A) systematic sample.
B) convenience sample.
C) simple random sample.
D) stratified sample.
A company has 2 machines that produce widgets. An older machine produces 23%
defective widgets, while the new machine produces only 8% defective widgets. In
addition, the new machine produces 3 times as many widgets as the older machine
does. Given that a widget was produced by the new machine, what is the probability it
is not defective?
A) 0.06
B) 0.50
C) 0.92
D) 0.94
TABLE 10-1
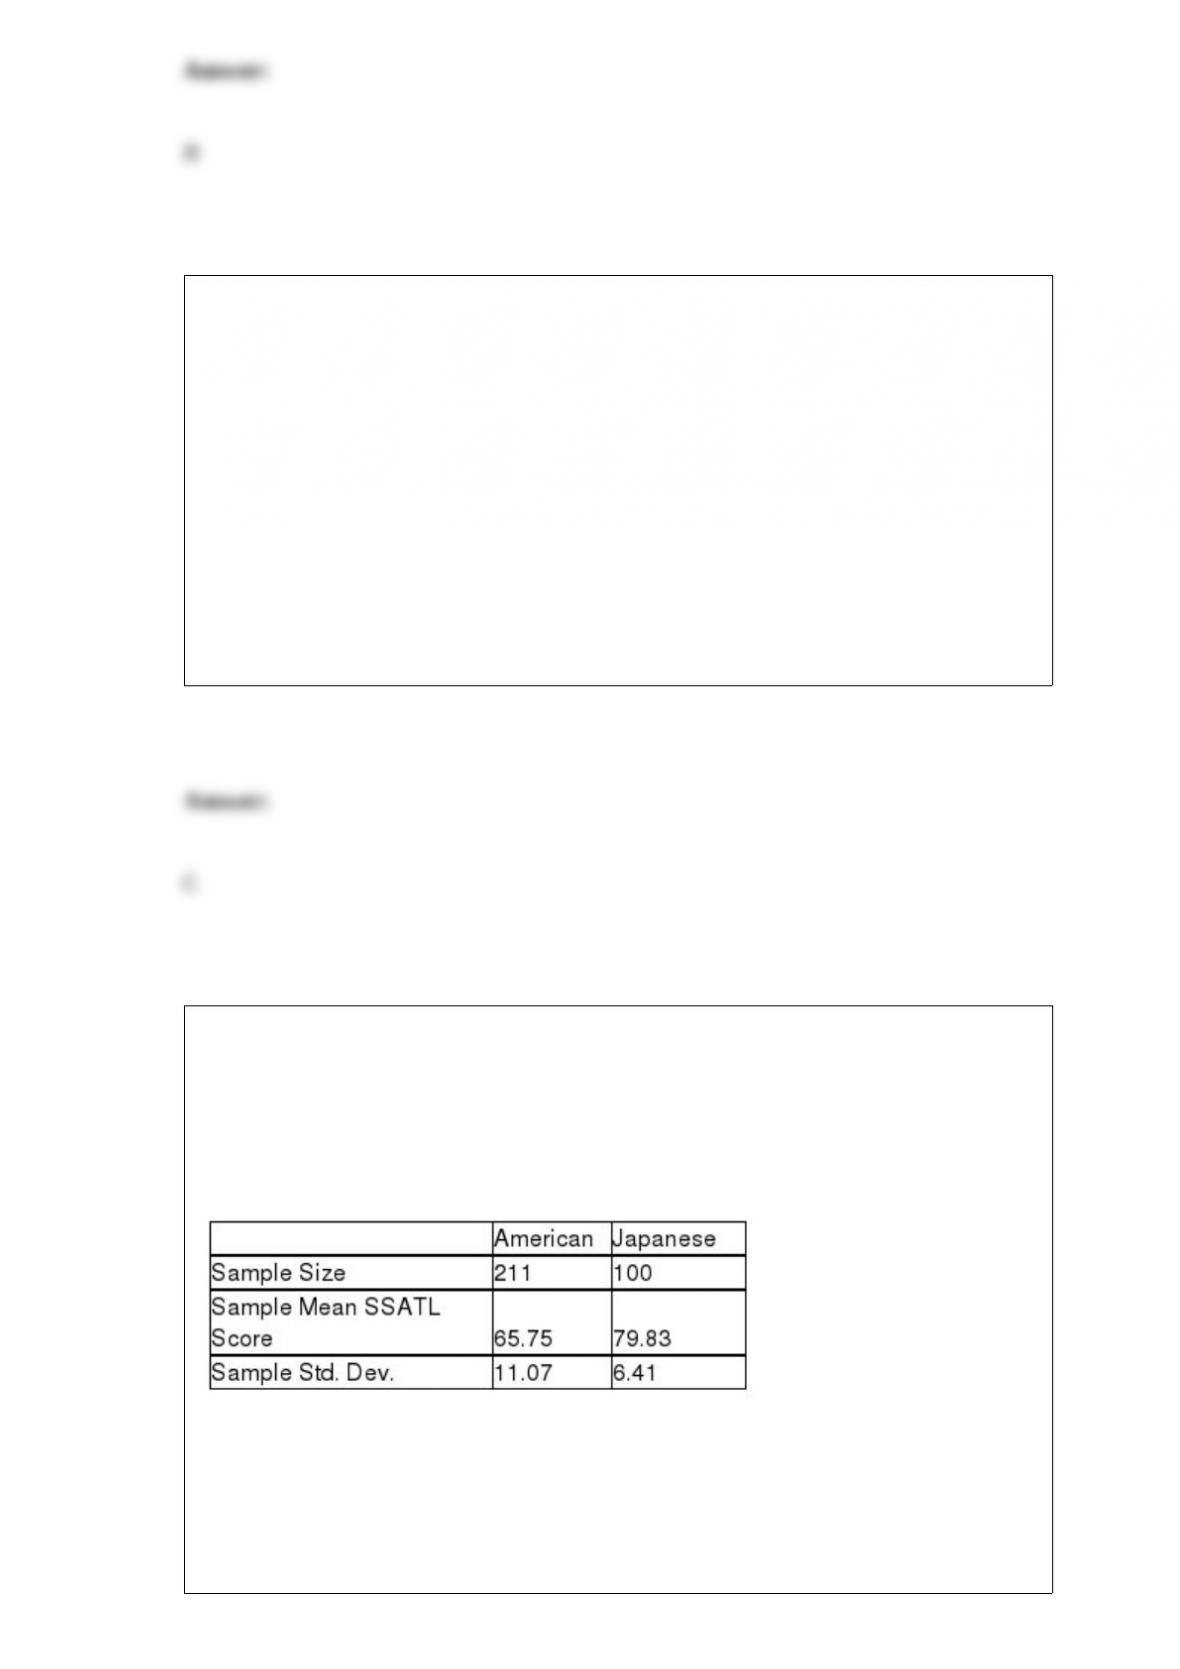
Are Japanese managers more motivated than American managers? A randomly selected
group of each were administered the Sarnoff Survey of Attitudes Toward Life (SSATL),
which measures motivation for upward mobility. The SSATL scores are summarized
below.
Referring to Table 10-1, find the p-value if we assume that the alternative hypothesis
was a two-tail test.
A) smaller than 0.01
B) between 0.01 and 0.05
C) between 0.05 and 0.10
D) greater than 0.10
If the p-value is less than in a two-tail test,
A) the null hypothesis should not be rejected.
B) the null hypothesis should be rejected.
C) a one-tail test should be used.
D) no conclusion should be reached.
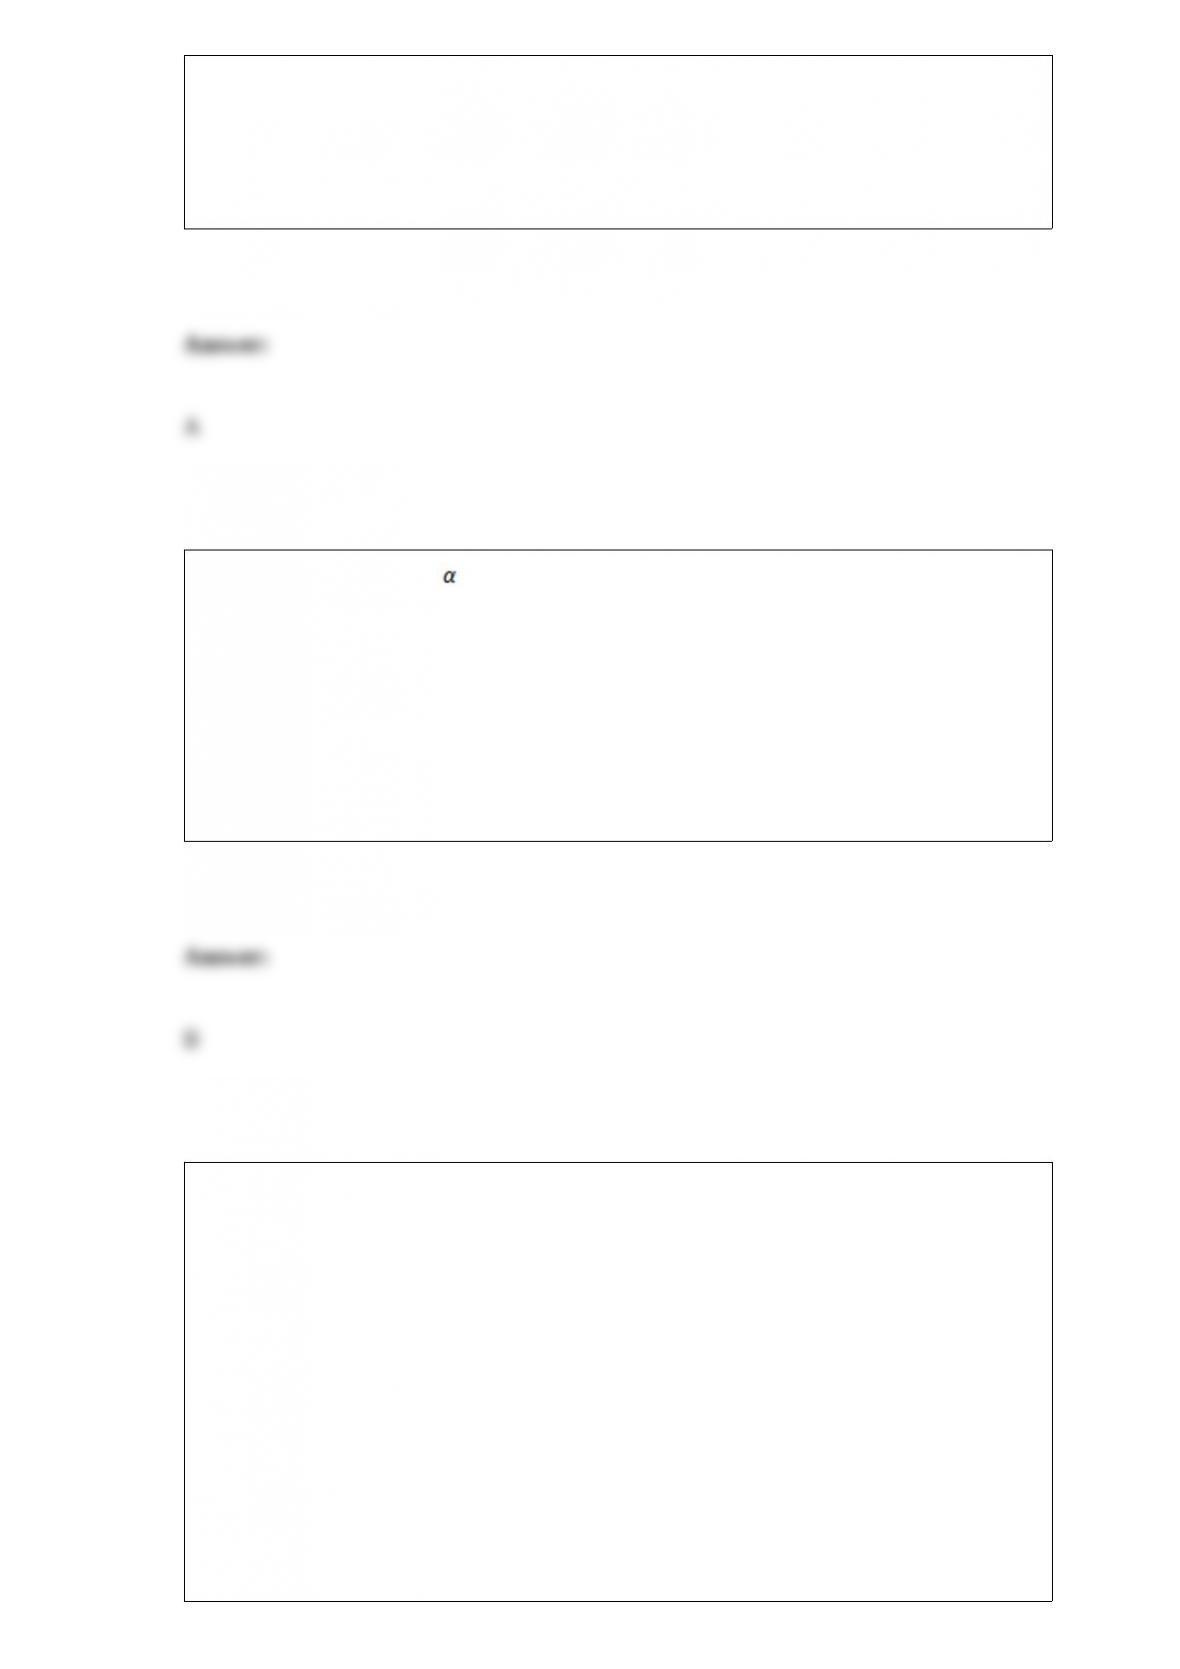
TABLE 11-8
A physician and president of a Tampa Health Maintenance Organization (HMO) are
attempting to show the benefits of managed health care to an insurance company. The
physician believes that certain types of doctors are more cost-effective than others. One
theory is that Primary Specialty is an important factor in measuring the
cost-effectiveness of physicians. To investigate this, the president obtained independent
random samples of 20 HMO physicians from each of 4 primary specialties – General
Practice (GP), Internal Medicine (IM), Pediatrics (PED), and Family Physicians (FP) –
and recorded the total charges per member per month for each. A second factor which
the president believes influences total charges per member per month is whether the
doctor is a foreign or USA medical school graduate. The president theorizes that foreign
graduates will have higher mean charges than USA graduates. To investigate this, the
president also collected data on 20 foreign medical school graduates in each of the 4
primary specialty types described above. So information on charges for 40 doctors (20
foreign and 20 USA medical school graduates) was obtained for each of the 4
specialties. The results for the ANOVA are summarized in the following table.
Referring to Table 11-8, interpret the test for interaction.
A) There is insufficient evidence to say at the 0.10 level of significance that the
difference between the mean charges for foreign and USA graduates depends on
primary specialty.
B) There is sufficient evidence to say at the 0.10 level of significance that the difference
between the mean charges for foreign and USA graduates depends on primary specialty.
C) There is sufficient evidence at the 0.10 level of significance of a difference between
the mean charges for foreign and USA medical graduates.
D) There is sufficient evidence to say at the 0.10 level of significance that mean charges
depend on both primary specialty and medical school.
The owner of a local nightclub has recently surveyed a random sample of n = 250
customers of the club. She would now like to determine whether or not the mean age of
her customers is greater than 30. If so, she plans to alter the entertainment to appeal to
an older crowd. If not, no entertainment changes will be made. If she wants to have a
level of significance at 0.01, what rejection region should she use?
A) Reject H0 if t < -2.3263.
B) Reject H0 if t < -2.5758.
C) Reject H0 if t > 2.3263.

D) Reject H0 if t > 2.5758.
A medical doctor is involved in a $1 million malpractice suit. He can either settle out of
court for $250,000 or go to court. If he goes to court and loses, he must pay $825,000
plus $175,000 in court costs. If he wins in court the plaintiffs pay the court costs.
Identify the outcomes of this decision-making problem.
A) Two choices: <1> go to court and <2> settle out of court.
B) Two possibilities: <1> win the case in court and <2> lose the case in court.
C) Four consequences resulting from Go/Settle and Win/Lose combinations.
D) The amount of money paid by the doctor.
TABLE 17-2
One of the most common questions of prospective house buyers pertains to the cost of
heating in dollars (Y). To provide its customers with information on that matter, a large
real estate firm used the following 4 variables to predict heating costs: the daily
minimum outside temperature in degrees of Fahrenheit (X1), the amount of insulation in
inches (X2), the number of windows in the house (X3), and the age of the furnace in
years (X4). Given below are the EXCEL outputs of two regression models.
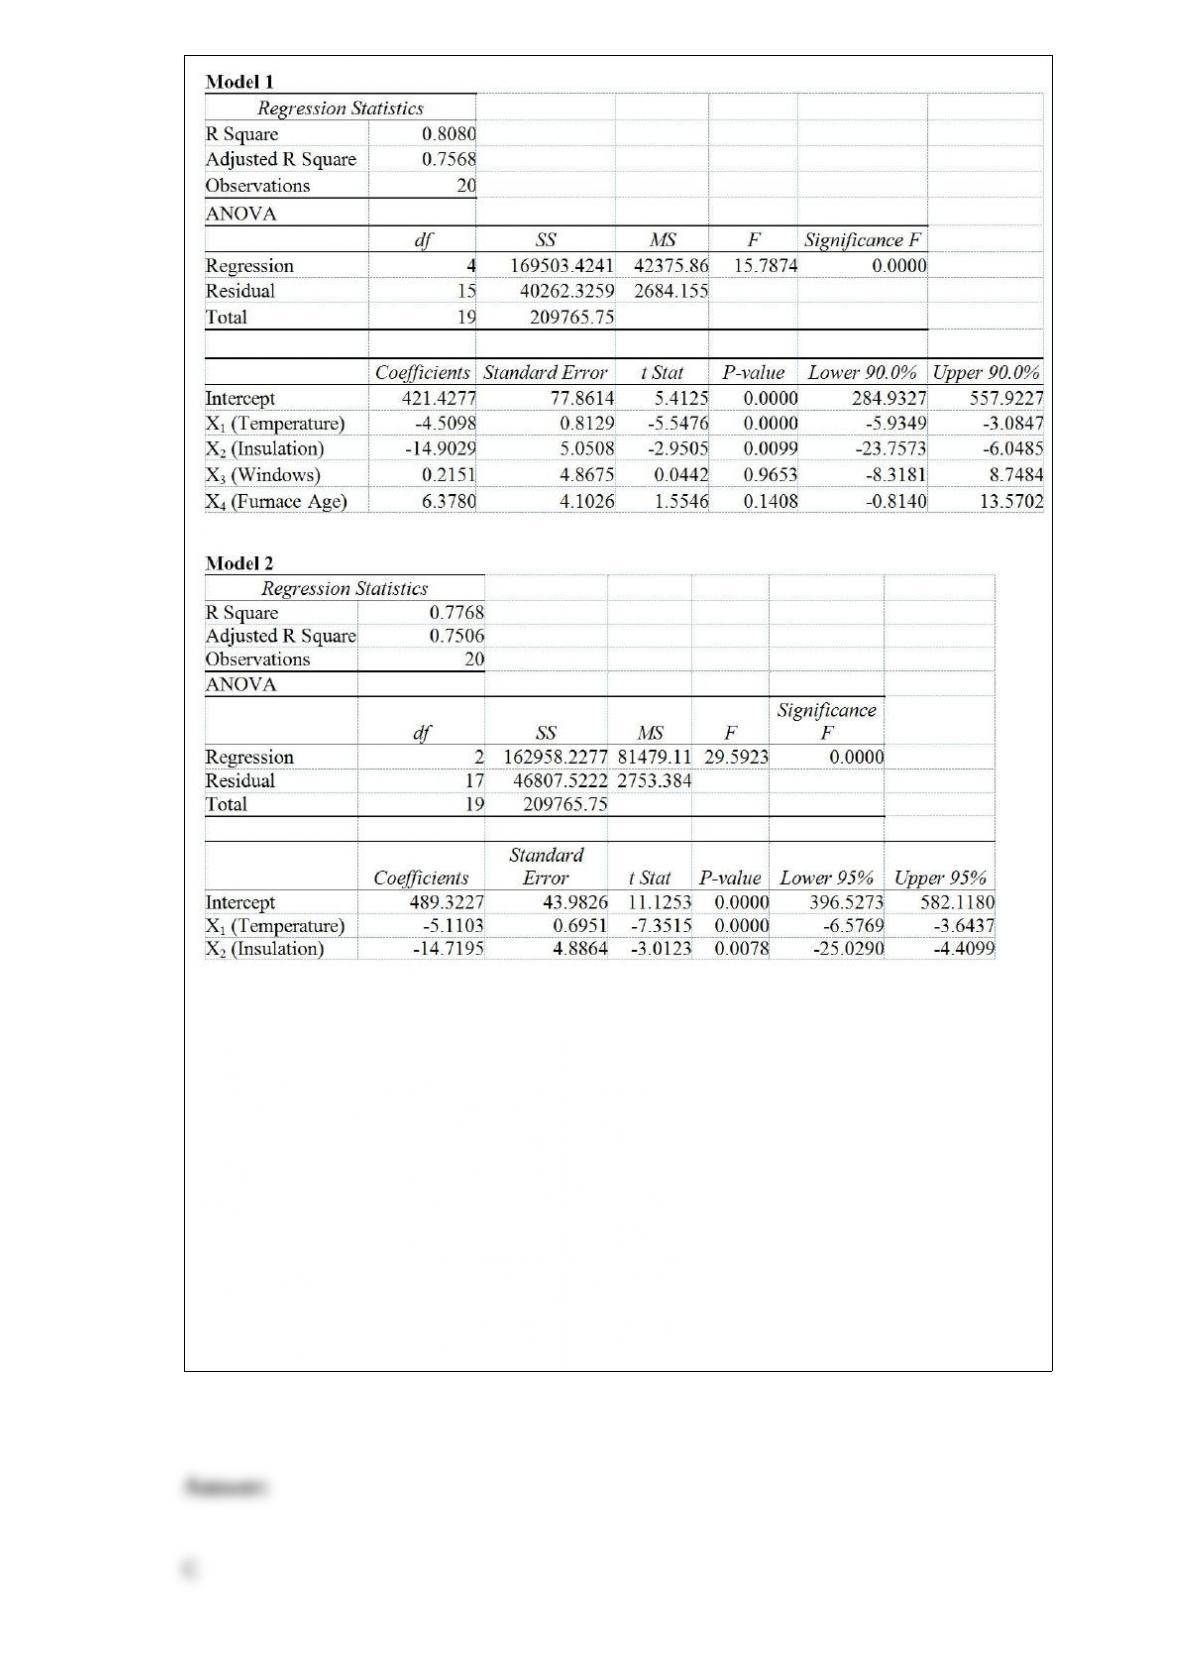
Referring to Table 17-2, the estimated value of the partial regression parameter β1in
Model 1 means that
A) holding the effect of the other independent variables constant, an estimated expected
$1 increase in heating costs is associated with a decrease in the daily minimum outside
temperature by 4.51 degrees.
B) holding the effect of the other independent variables constant, a 1 degree increase in
the daily minimum outside temperature results in a decrease in heating costs by $4.51.
C) holding the effect of the other independent variables constant, a 1 degree increase in
the daily minimum outside temperature results in an estimated decrease in mean heating
costs by $4.51.
D) holding the effect of the other independent variables constant, a 1% increase in the
daily minimum outside temperature results in an estimated decrease in mean heating
costs by 4.51%.
A microeconomist wants to determine how corporate sales are influenced by capital and
wage spending by companies. She proceeds to randomly select 26 large corporations
and record information in millions of dollars. A statistical analyst discovers that capital
spending by corporations has a significant inverse relationship with wage spending.
What should the microeconomist who developed this multiple regression model be
particularly concerned with?
A) Randomness of error terms
B) Collinearity
C) Normality of residuals
D) Missing observations
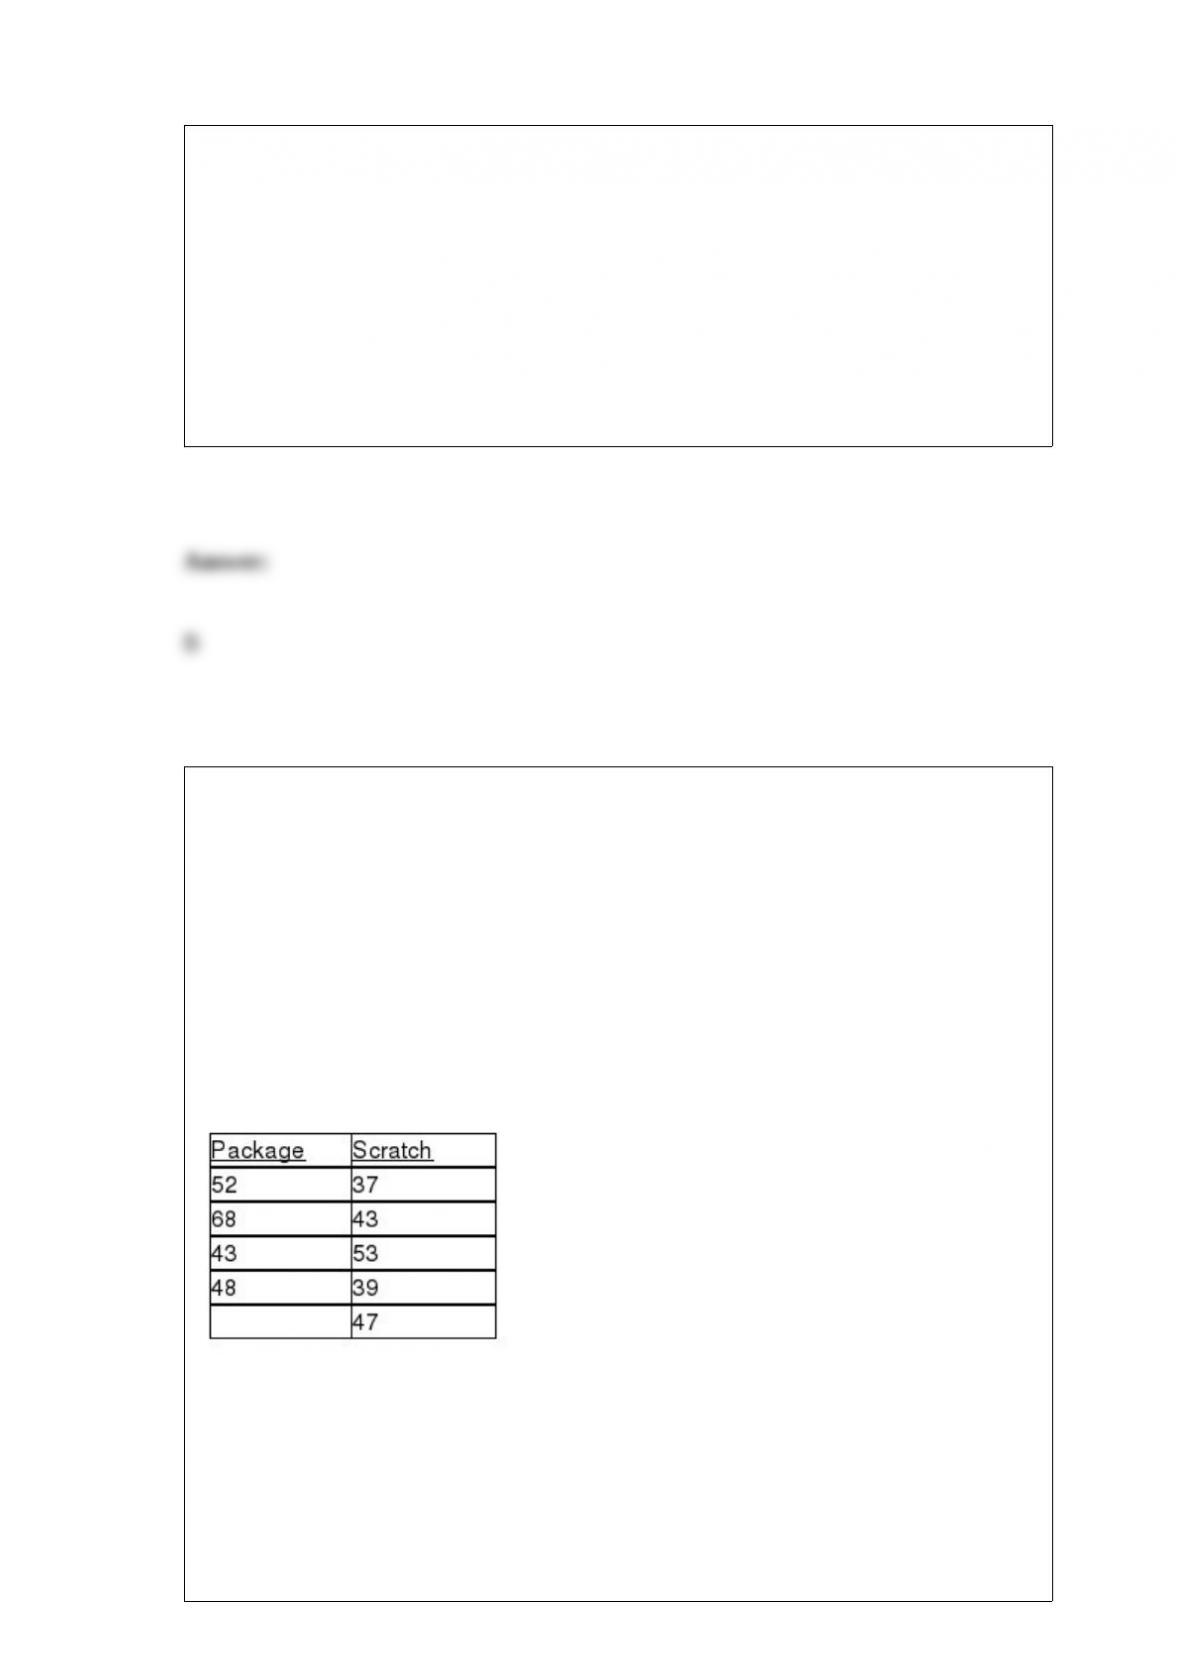
TABLE 12-14
A perfume manufacturer is trying to choose between 2 magazine advertising layouts.
An expensive layout would include a small package of the perfume. A cheaper layout
would include a ‘scratch-and-sniff” sample of the product. The manufacturer would use
the more expensive layout only if there is evidence that it would lead to a higher
approval rate. The manufacturer presents the more expensive layout to 4 groups and
determines the approval rating for each group. He presents the ‘scratch-and-sniff” layout
to 5 groups and again determines the approval rating of the perfume for each group. The
data are given below. Use this to test the appropriate hypotheses with the Wilcoxon
Rank Sum Test with a level of significance of 0.05.
Referring to Table 12-14, the perfume manufacturer will
A) use the ‘scratch-and-sniff” layout because there is insufficient evidence to do
otherwise.
B) use the package layout because there is insufficient evidence to do otherwise.
C) use the ‘scratch-and-sniff” layout because there is sufficient evidence to conclude
that this is the best course of action.
D) use the package layout because there is sufficient evidence to conclude that this is
the best course of action.
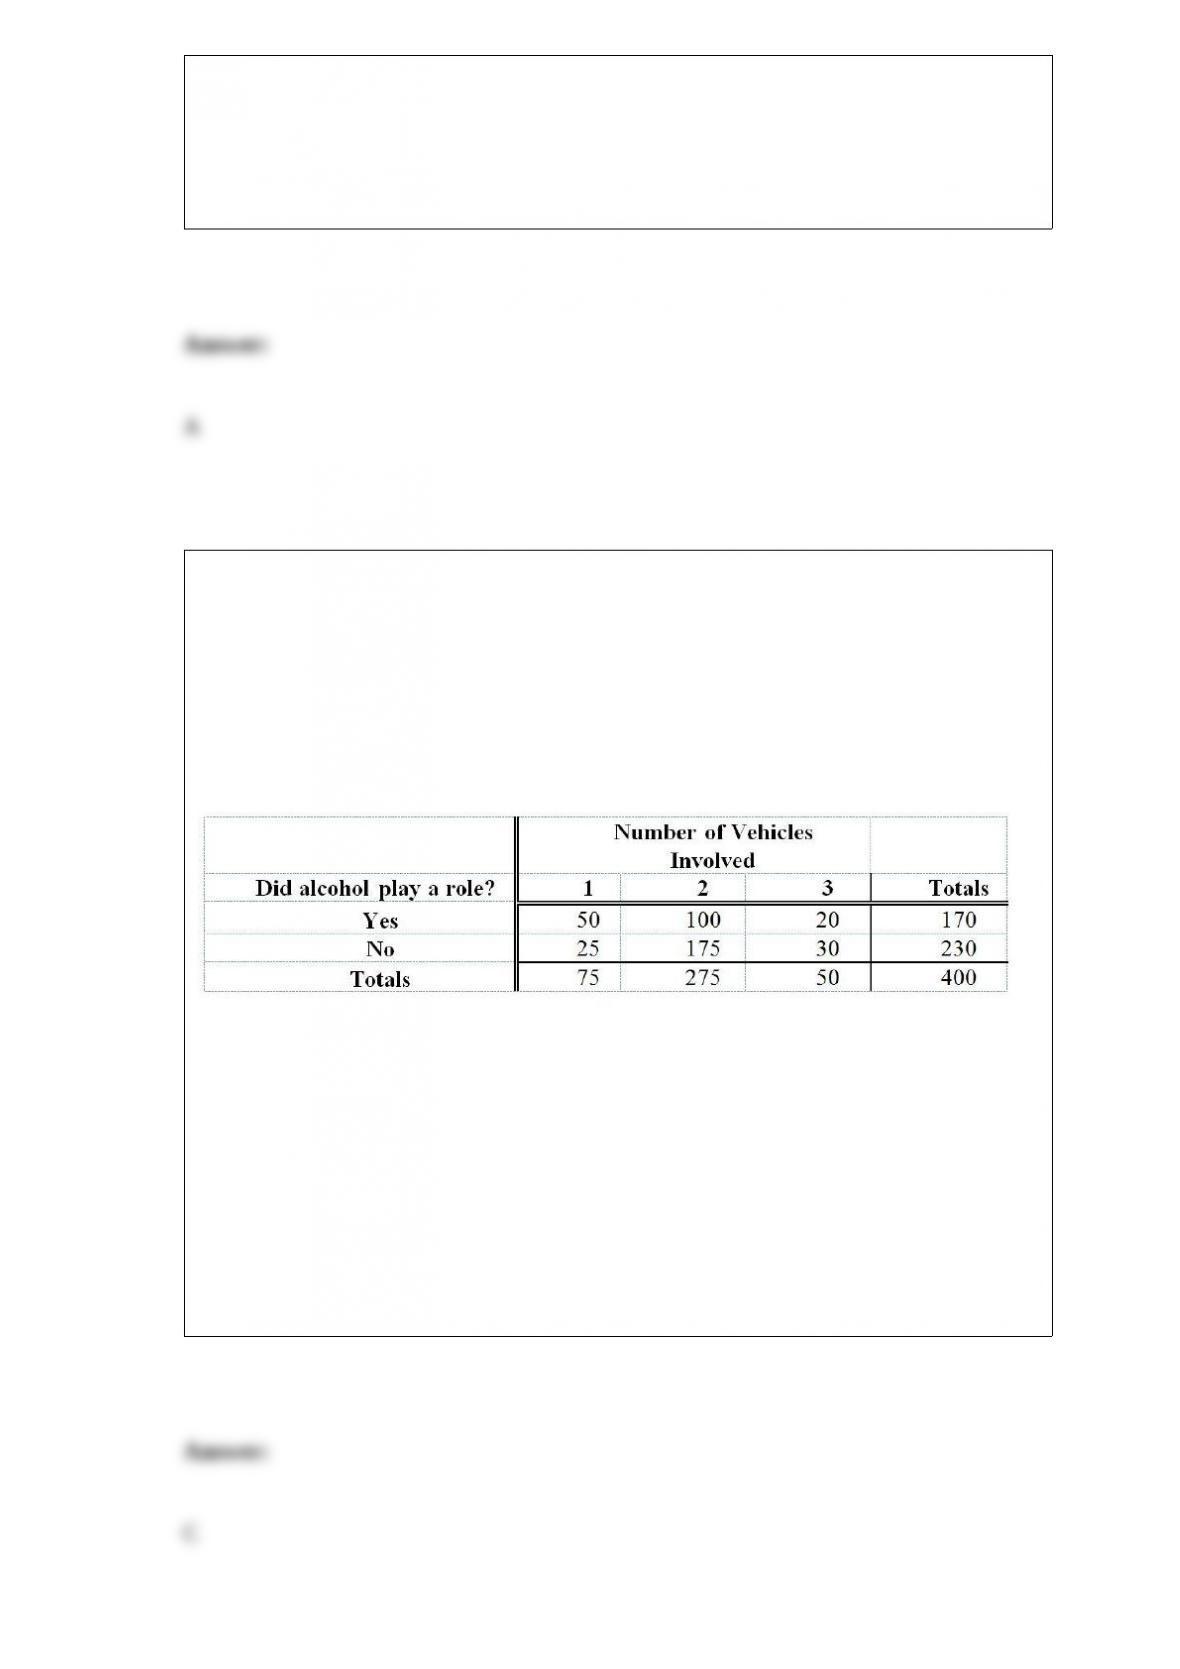
TABLE 4-1
Mothers Against Drunk Driving is a very visible group whose main focus is to educate
the public about the harm caused by drunk drivers. A study was recently done that
emphasized the problem we all face with drinking and driving. Four hundred accidents
that occurred on a Saturday night were analyzed. Two items noted were the number of
vehicles involved and whether alcohol played a role in the accident. The numbers are
shown below:
Referring to Table 4-1, given that multiple vehicles were involved, what proportion of
accidents involved alcohol?
A) 120/170 or 70.59%
B) 120/230 or 52.17%
C) 120/325 or 36.92%
D) 120/400 or 30%
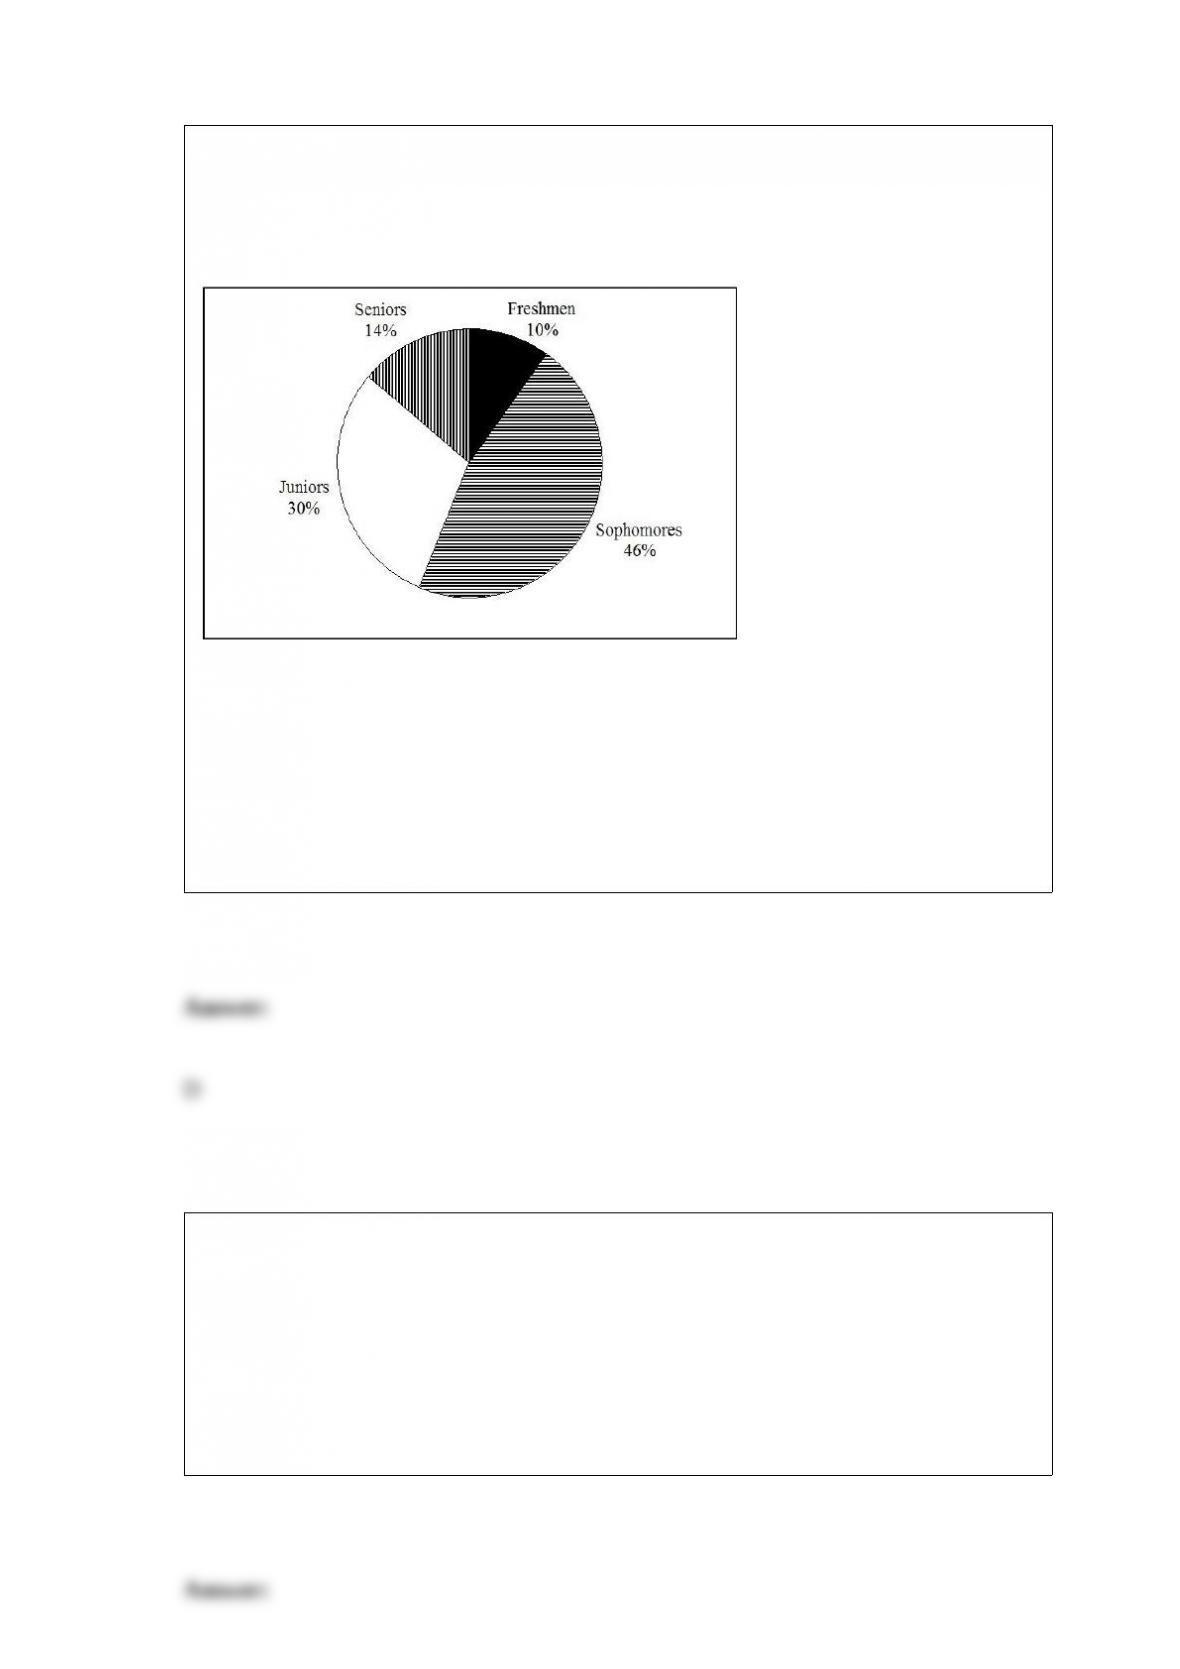
A professor of economics at a small Texas university wanted to determine what year in
school students were taking his tough economics course. Shown below is a pie chart of
the results. What percentage of the class took the course prior to reaching their senior
year?
A) 14%
B) 44%
C) 54%
D) 86%
TABLE 7-3
The lifetimes of a certain brand of light bulbs are known to be normally distributed with
a mean of 1,600 hours and a standard deviation of 400 hours. A random sample of 64 of
these light bulbs is taken.
Referring to Table 7-3, the probability is 0.15 that the sample mean lifetime is more
than how many hours?
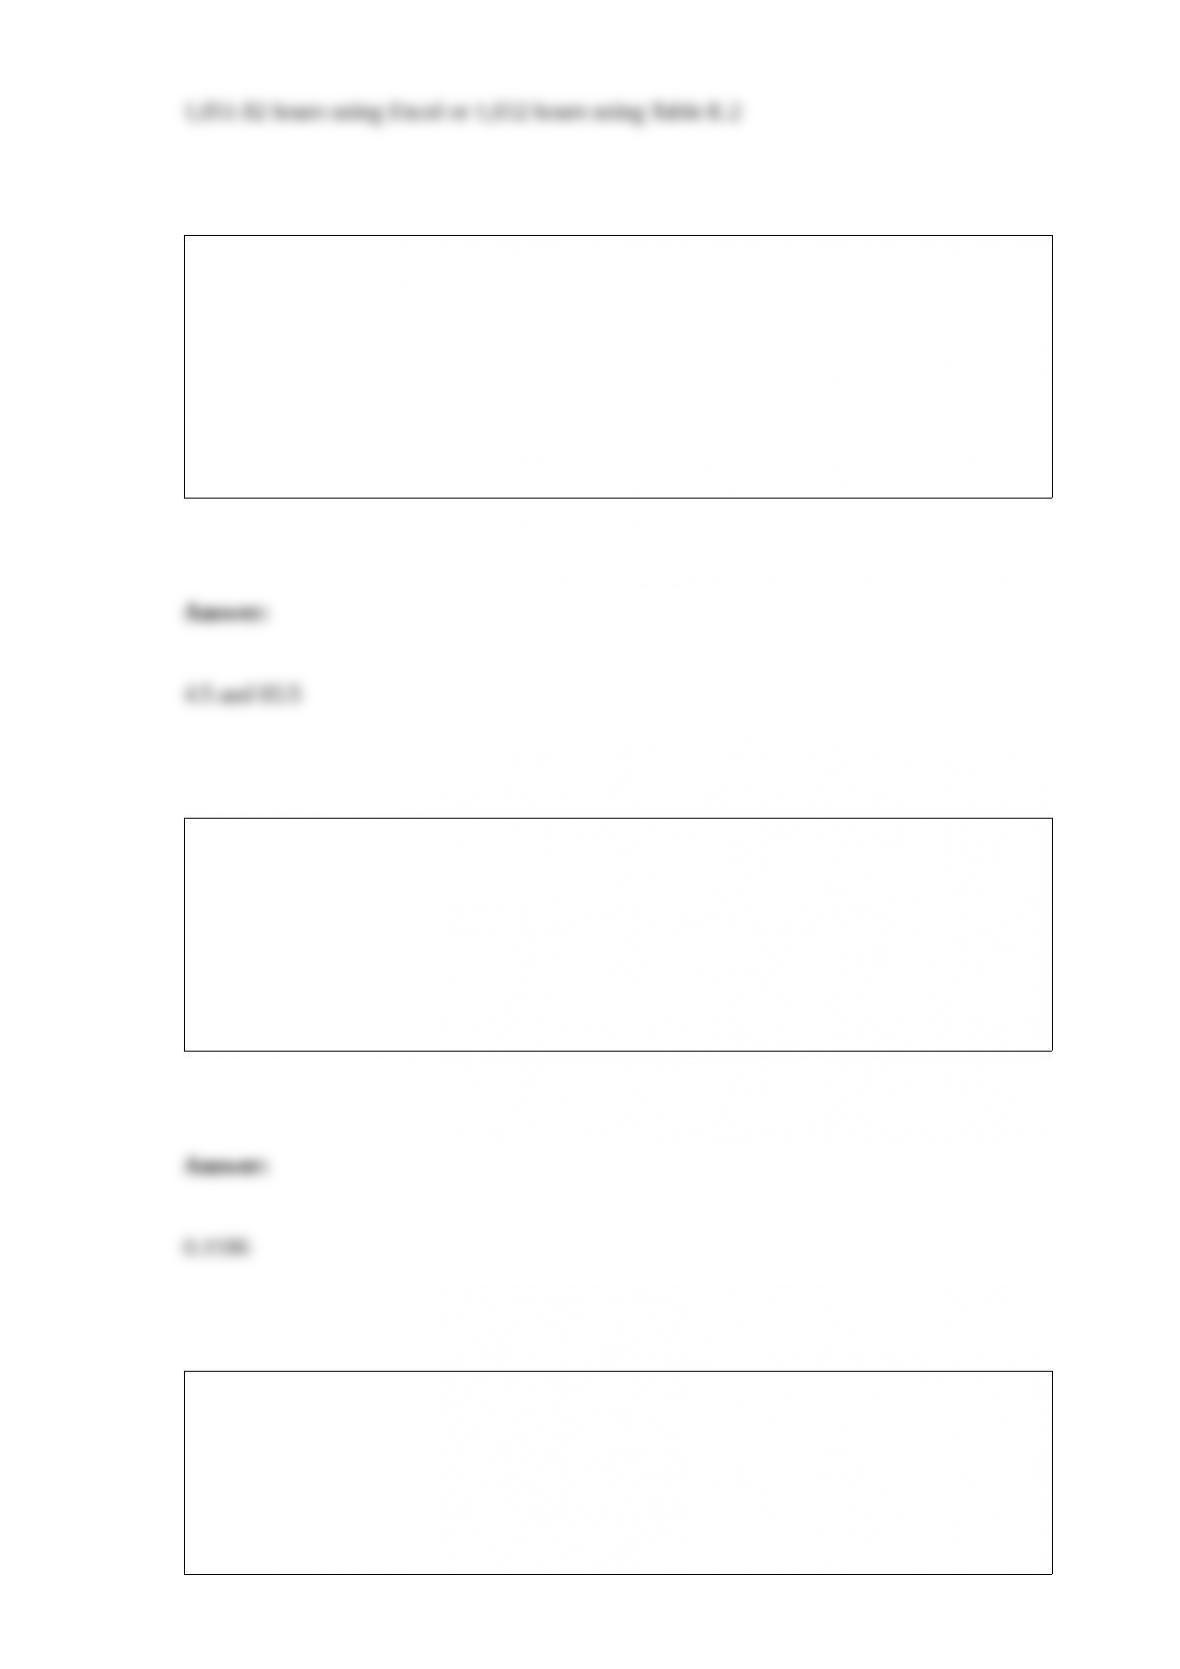
TABLE 6-3
Suppose the time interval between two consecutive defective light bulbs from a
production line has a uniform distribution over an interval from 0 to 90 minutes.
Referring to Table 6-3, the probability is 90% that the time interval between two
consecutive defective light bulbs will fall between which two values that are the same
distance from the mean?
TABLE 7-4
According to a survey, only 15% of customers who visited the website of a major retail
store made a purchase. Random sample sizes of 50 are selected.
Referring to Table 7-4, what proportion of the samples will have between 20% and 30%
of customers who will make a purchase after visiting the website?
TABLE 19-6
A student wanted to find out the optimal strategy to study for a Business Statistics
exam. He constructed the following payoff table based on the mean amount of time he
needed to study every week for the course and the degree of difficulty of the exam.
From the information that he gathered from students who had taken the course, he
concluded that there was a 40% probability that the exam would be easy.
Referring to Table 19-6, how many possible events are there?
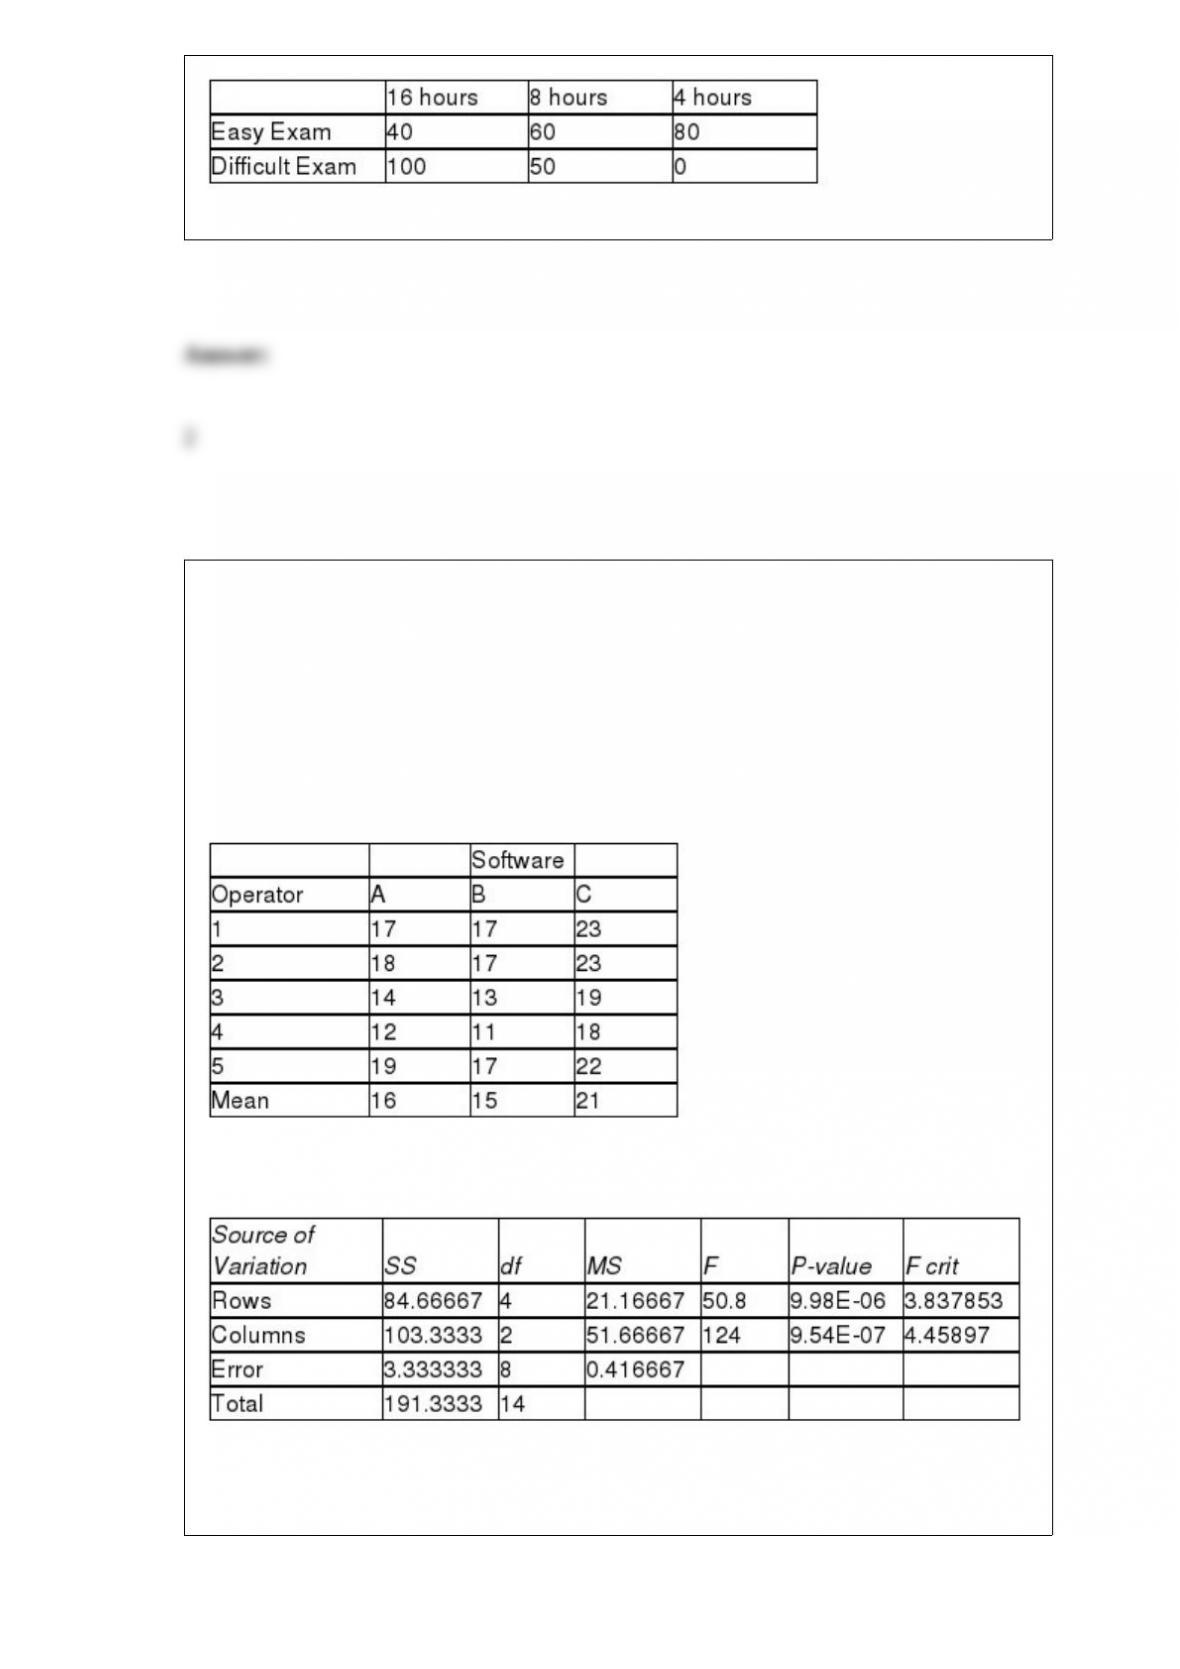
TABLE 11-8
An important factor in selecting database software is the time required for a user to
learn how to use the system. To evaluate three potential brands (A, B and C) of database
software, a company designed a test involving five different employees. To reduce
variability due to differences among employees, each of the five employees is trained
on each of the three different brands. The amount of time (in hours) needed to learn
each of the three different brands is given below:
Below is the Excel output for the randomized block design:
Referring to Table 11-8, what are the degrees of freedom of the F test statistic for
testing the block effects?

A manufacturer of power tools claims that the mean amount of time required to
assemble their top-of-the-line table saw is 80 minutes with a standard deviation of 40
minutes. Suppose a random sample of 64 purchasers of this table saw is taken. The
mean of the sampling distribution of the sample mean is ________ minutes.
Referring to Table 14-17, what are the lower and upper limits of the
95% confidence interval estimate for the effect of a one year increase
in age on the mean number of weeks a worker is unemployed due to
a layo0 after taking into consideration the effect of all the other
independent variables?
TABLE 14-17
Given below are results from the regression analysis where the
dependent variable is the number of weeks a worker is unemployed
due to a layo0 (Unemploy) and the independent variables are the age
of the worker (Age) and a dummy variable for management position
(Manager: 1 = yes, 0 = no).
The results of the regression analysis are given below:

Referring to Table 14-8, the estimate of the unit change in the mean
of Y per unit change in X1, taking into account the effects of the other
variable, is ________.TABLE 14-8
A financial analyst wanted to examine the relationship between salary
(in $1,000) and 2 variables: age
(X1 = Age) and experience in the field (X2 = Exper). He took a sample
of 20 employees and obtained the following Microsoft Excel output:
Also, the sum of squares due to the regression for the model that
includes only Age is 5022.0654 while the sum of squares due to the
regression for the model that includes only Exper is 125.9848.
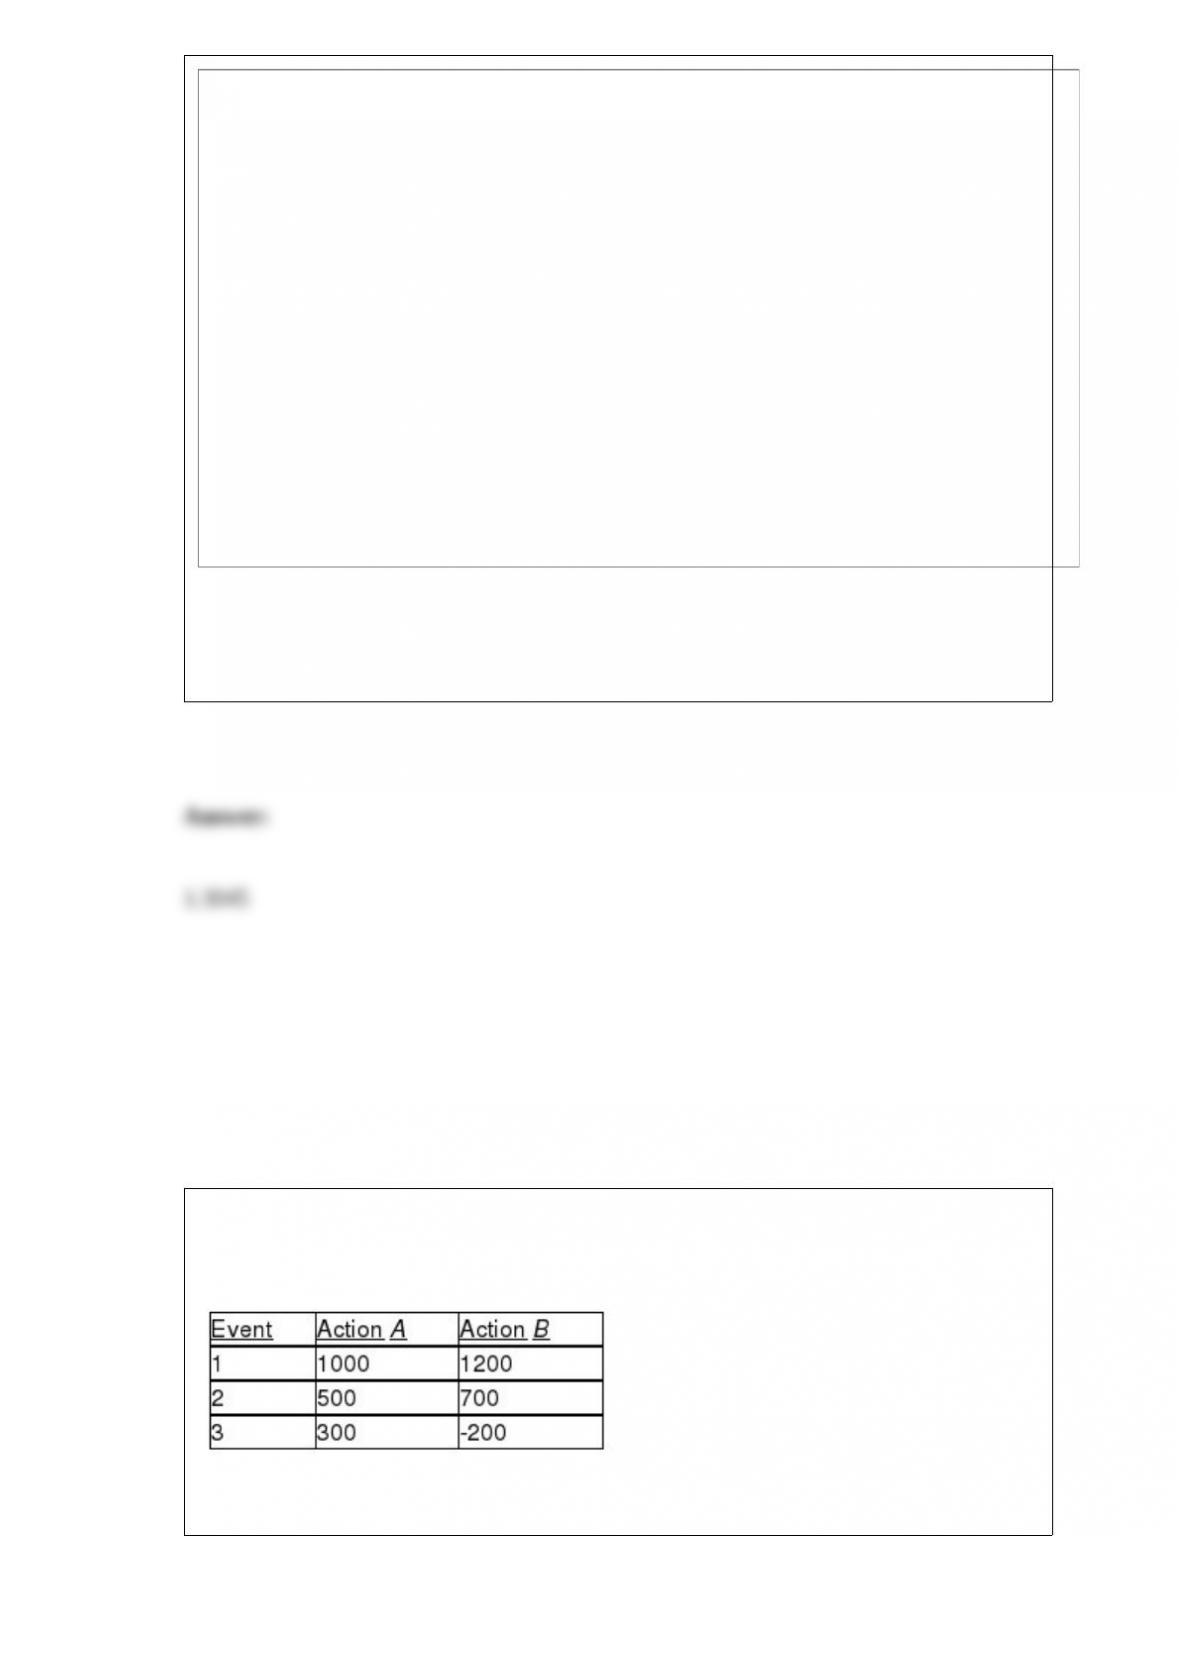
TABLE 19-5
The following payoff table shows profits associated with a set of 2 alternatives under 3
possible events.
Suppose that the probability of Event 1 is 0.2, Event 2 is 0.5, and Event 3 is 0.3.
Referring to Table 19-5, what is the optimal action using maximin criterion?
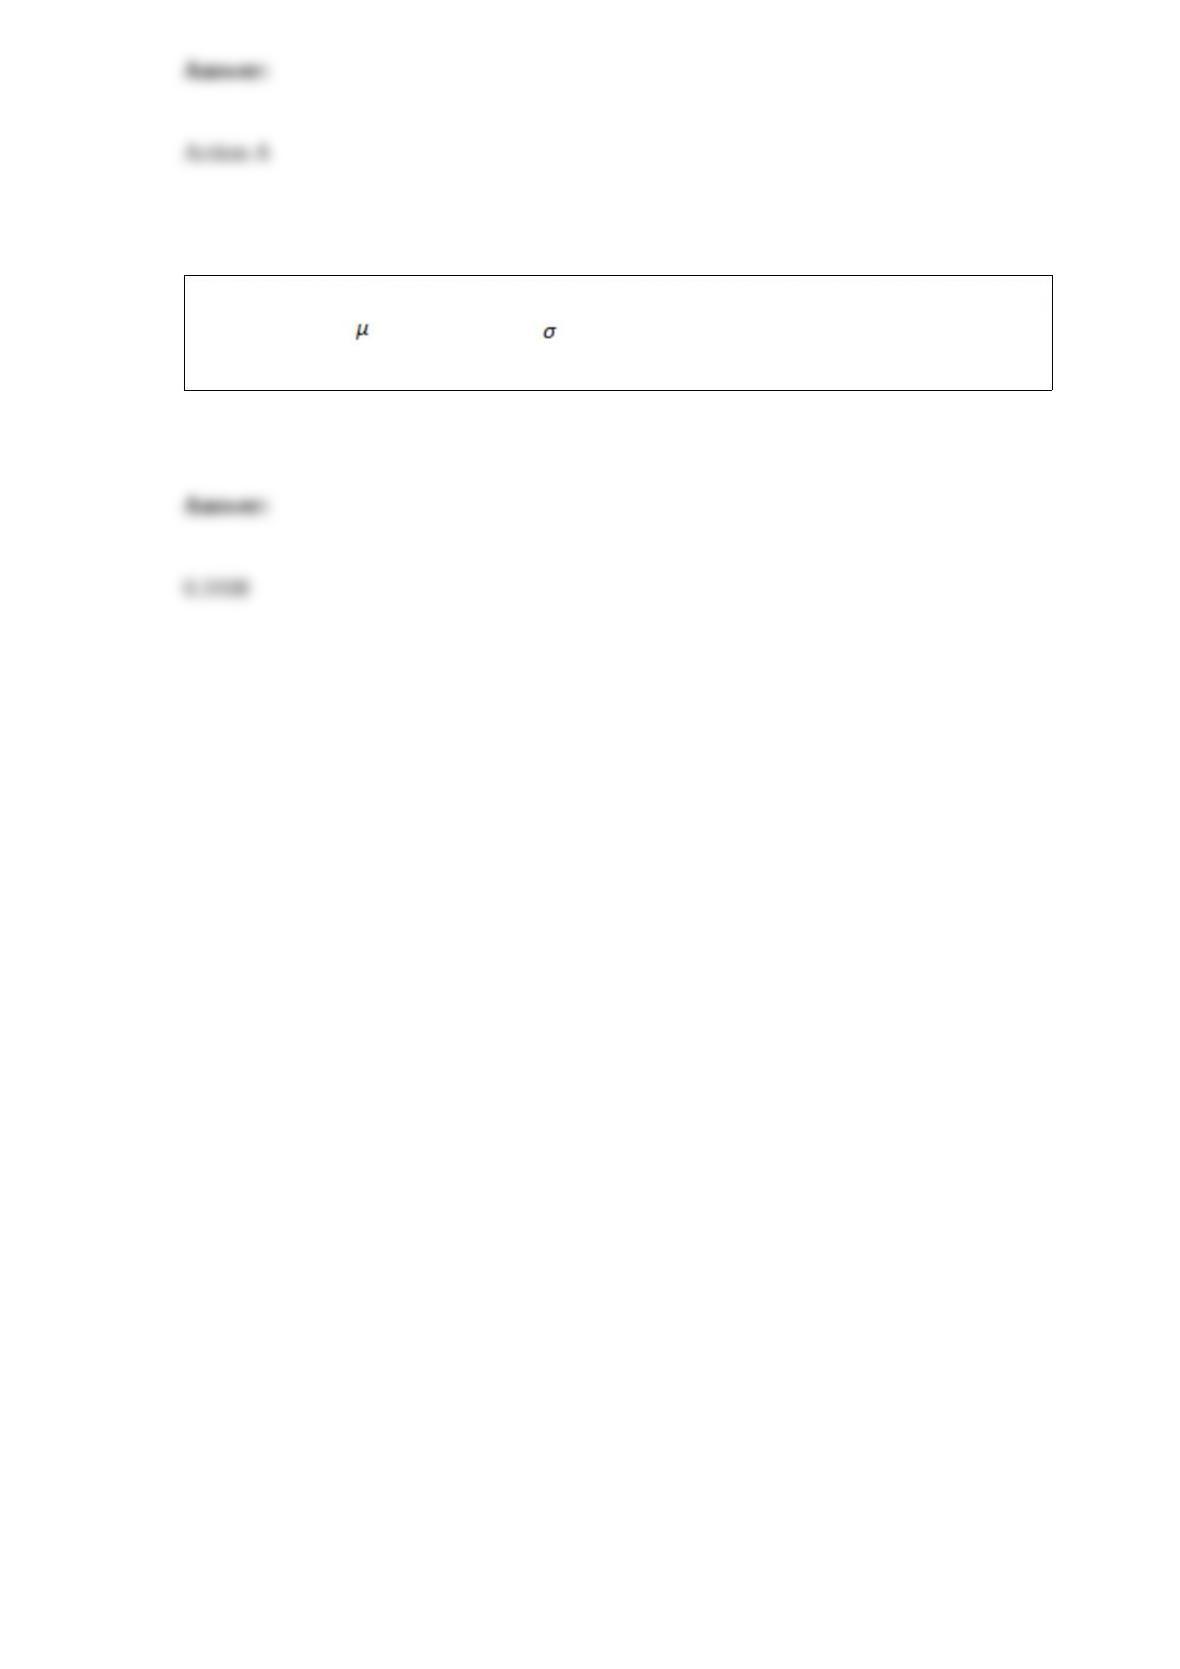
The amount of tea leaves in a can from a particular production line is normally
distributed with = 110 grams and = 25 grams. What is the probability that a
randomly selected can will contain between 100 and 120 grams of tea leaves?