True or False: The probability that a standard normal variable, Z, falls between -1.50
and 0.81 is 0.7242.
True or False: The coefficient of variation measures variability in a data set relative to
the size of the arithmetic mean.
True or False: TABLE 17-10
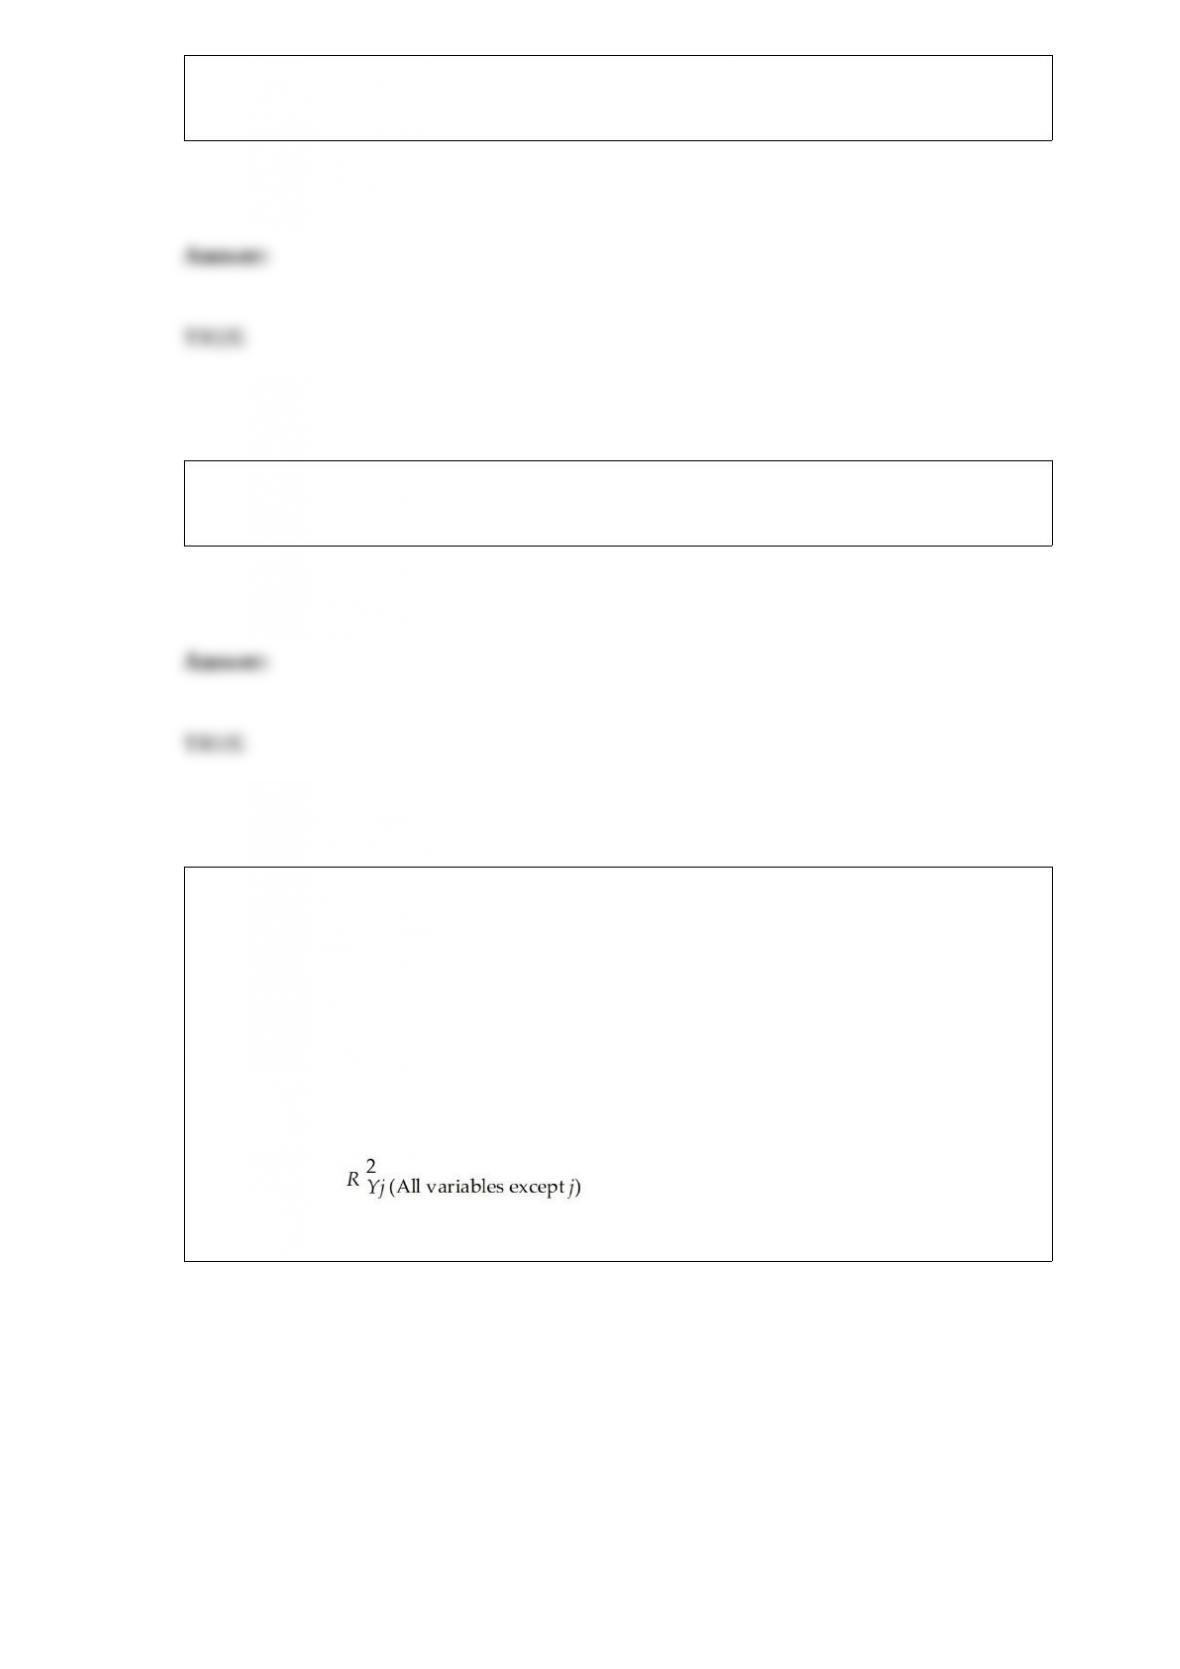
Given below are results from the regression analysis where the dependent variable is
the number of weeks a worker is unemployed due to a layoff (Unemploy) and the
independent variables are the age of the worker (Age), the number of years of education
received (Edu), the number of years at the previous job (Job Yr), a dummy variable for
marital status (Married: 1 = married, 0 = otherwise), a dummy variable for head of
household (Head: 1 = yes, 0 = no) and a dummy variable for management position
(Manager: 1 = yes, 0 = no). We shall call this Model 1. The coefficient of partial
determination ( ) of each of the 6 predictors are, respectively,
0.2807, 0.0386, 0.0317, 0.0141, 0.0958, and 0.1201.
Model 2 is the regression analysis where the dependent variable is Unemploy and the
independent variables are Age and Manager. The results of the regression analysis are
given below:
Referring to Table 17-10, Model 1, there is sufficient evidence that at least one of the
explanatory variables is related to the number of weeks a worker is unemployed due to
a layoff at a 10% level of significance.
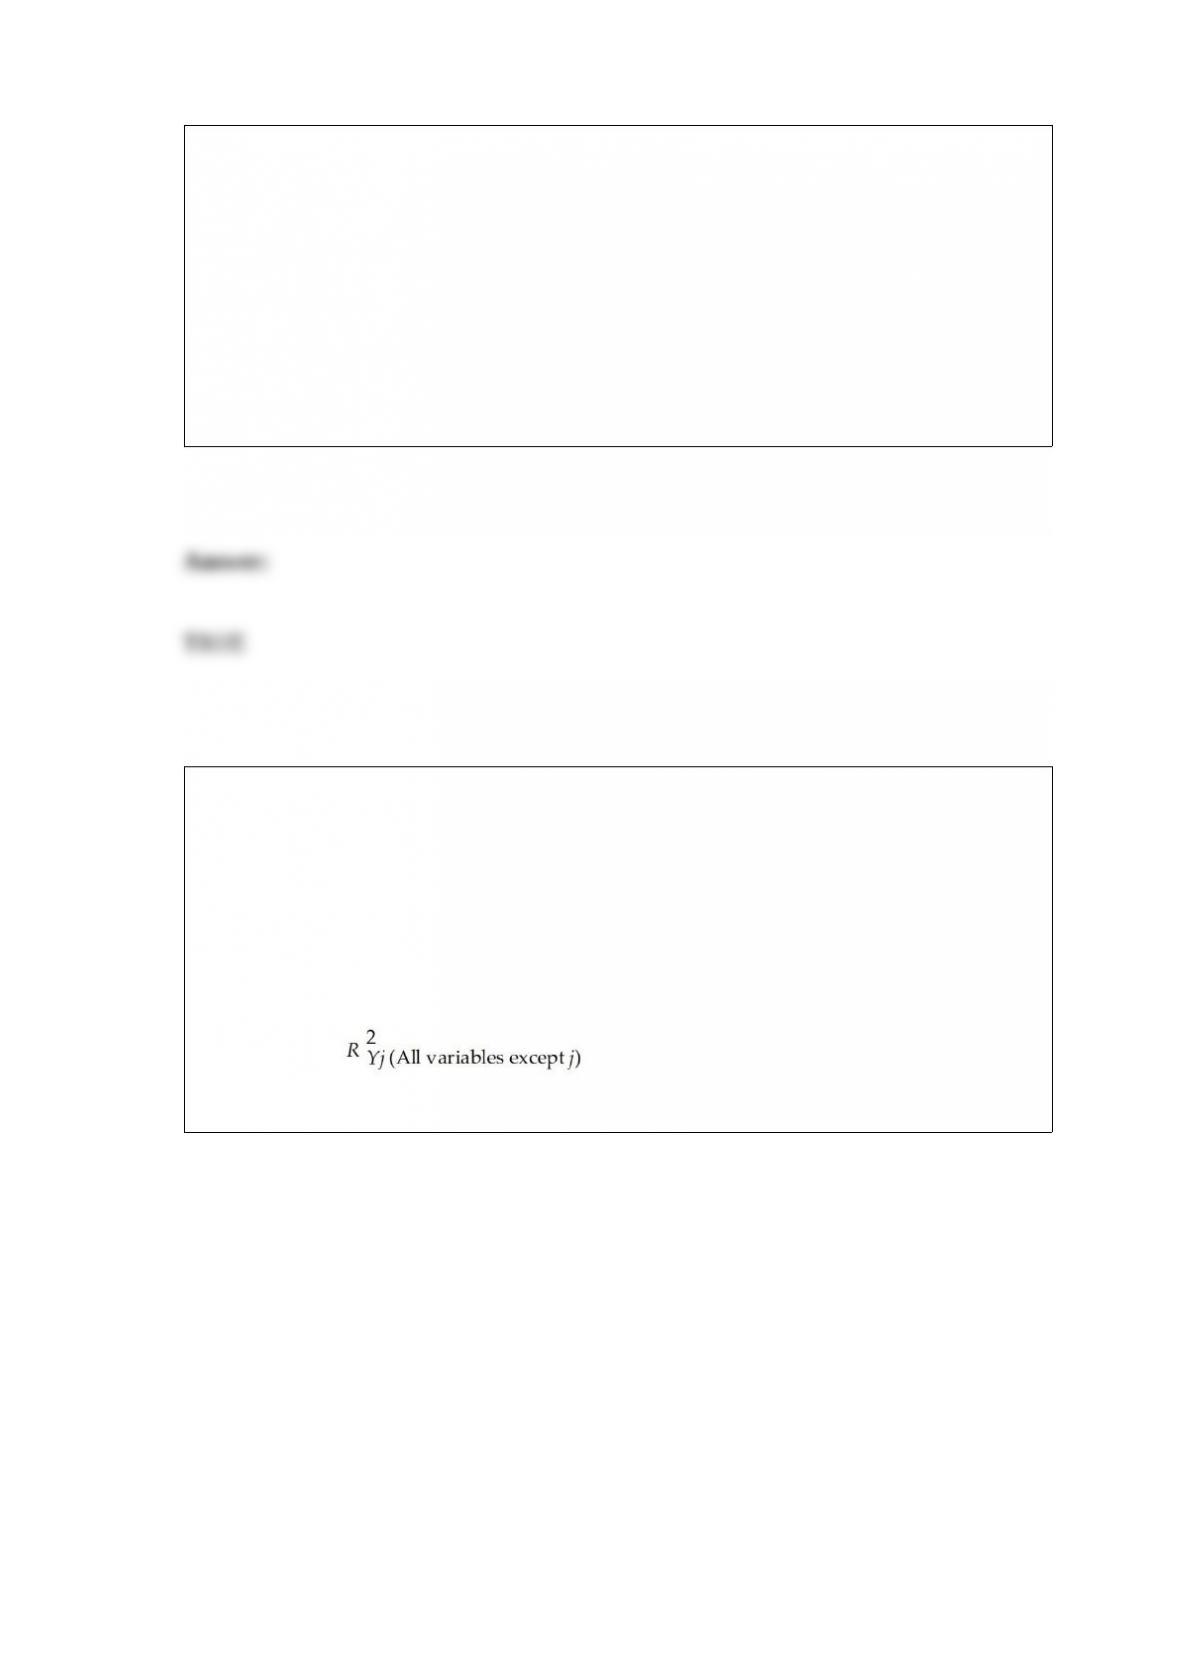
TABLE 8-9
A university wanted to find out the percentage of students who felt comfortable
reporting cheating by their fellow students. A survey of 2,800 students was conducted
and the students were asked if they felt comfortable reporting cheating by their fellow
students. The results were 1,344 answered “Yes” and 1,456 answered “No.”
True or False: Referring to Table 8-9, a 95% confidence interval for the proportion of
the student population who feel comfortable reporting cheating by their fellow students
is narrower than a 99% confidence interval.
True or False: TABLE 17-10
Given below are results from the regression analysis where the dependent variable is
the number of weeks a worker is unemployed due to a layoff (Unemploy) and the
independent variables are the age of the worker (Age), the number of years of education
received (Edu), the number of years at the previous job (Job Yr), a dummy variable for
marital status (Married: 1 = married, 0 = otherwise), a dummy variable for head of
household (Head: 1 = yes, 0 = no) and a dummy variable for management position
(Manager: 1 = yes, 0 = no). We shall call this Model 1. The coefficient of partial
determination ( ) of each of the 6 predictors are, respectively,
0.2807, 0.0386, 0.0317, 0.0141, 0.0958, and 0.1201.
Model 2 is the regression analysis where the dependent variable is Unemploy and the
independent variables are Age and Manager. The results of the regression analysis are
given below:
Referring to Table 17-10, Model 1, the null hypothesis H0 : β1 = β2= β3 = β4 = β5 = β6
= 0 implies that the number of weeks a worker is unemployed due to a layoff is not
affected by some of the explanatory variables.
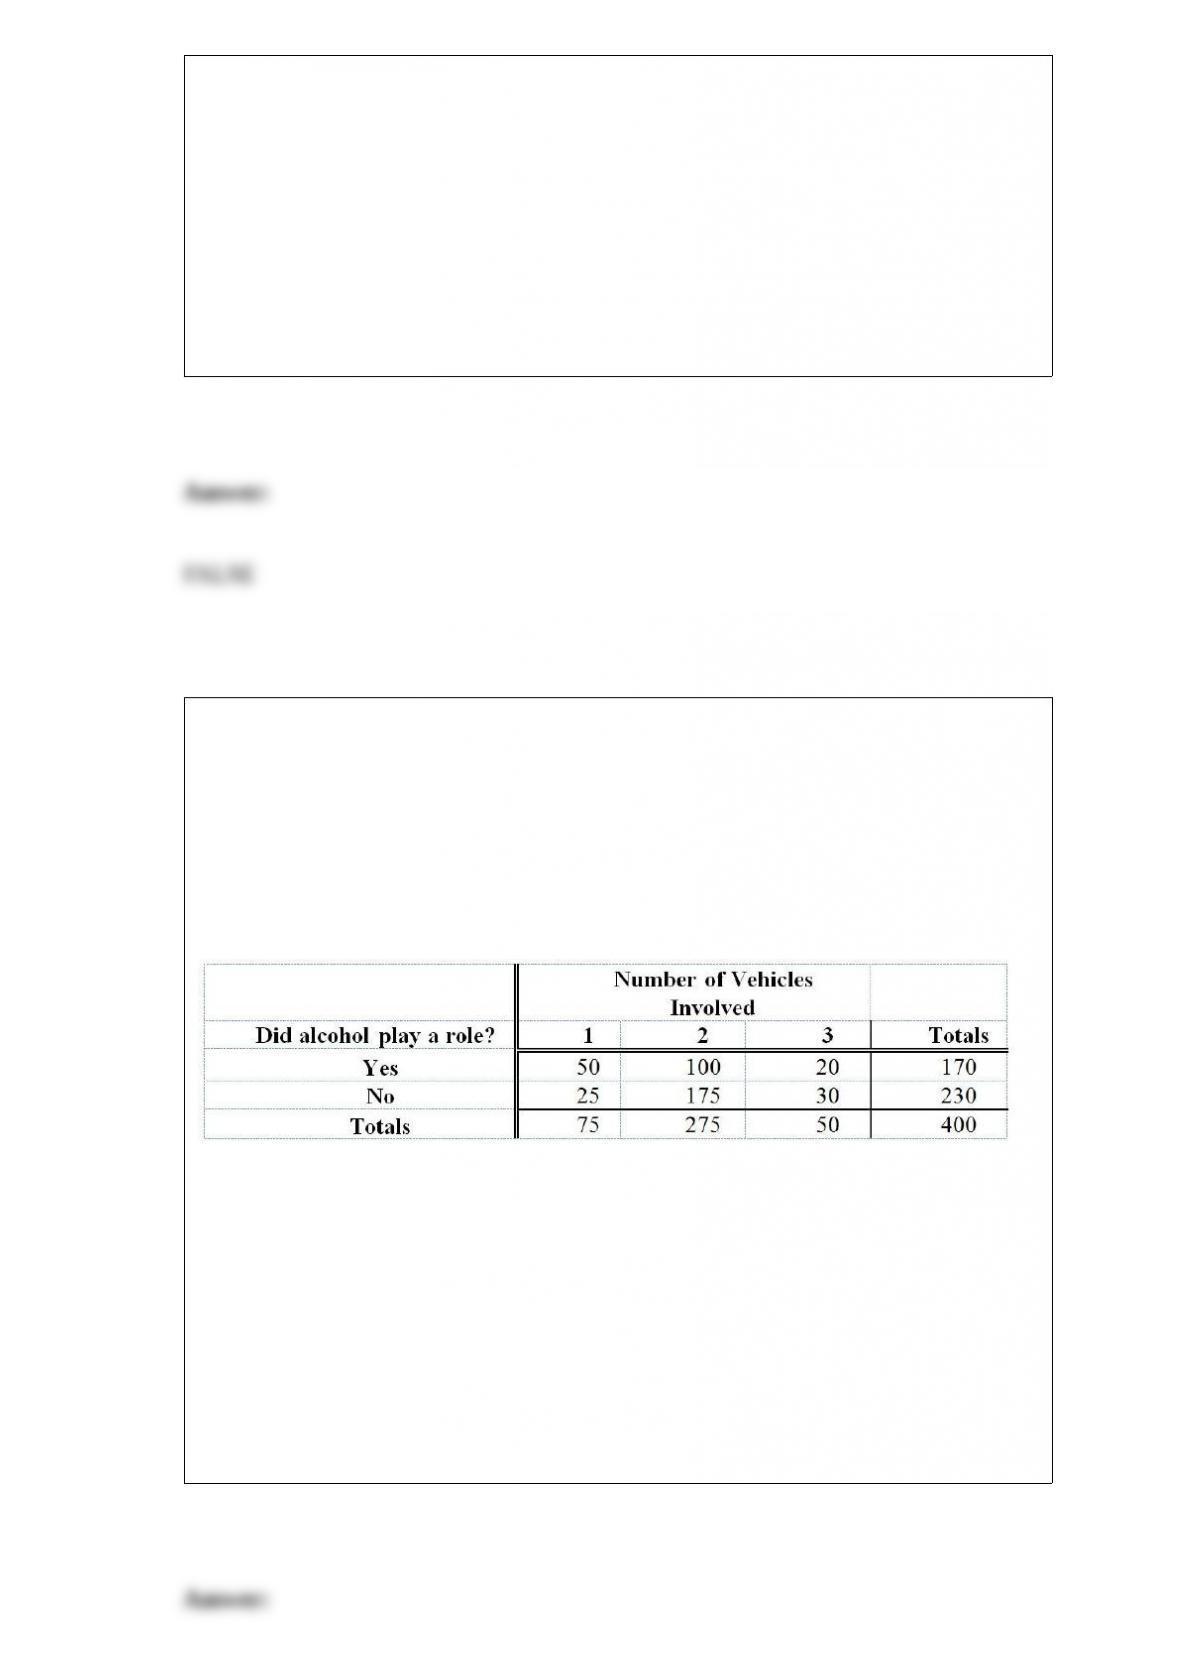
TABLE 8-14
The superintendent of a unified school district of a small town wants to make sure that
no more than 5% of the students skip more than 10 days of school in a year. A random
sample of 145 students from a population of 800 showed that 12 students skipped more
than 10 days of school last year.
True or False: Referring to Table 8-14, the superintendent can conclude with 95% level
of confidence that no more than 5% of the students in the unified school district skipped
more than 10 days of school last year.
TABLE 4-1
Mothers Against Drunk Driving is a very visible group whose main focus is to educate
the public about the harm caused by drunk drivers. A study was recently done that
emphasized the problem we all face with drinking and driving. Four hundred accidents
that occurred on a Saturday night were analyzed. Two items noted were the number of
vehicles involved and whether alcohol played a role in the accident. The numbers are
shown below:
Referring to Table 4-1, what proportion of accidents involved alcohol and a single
vehicle?
A) 25/400 or 6.25%
B) 50/400 or 12.5%
C) 195/400 or 48.75%
D) 245/400 or 61.25%
The probability of a small business declaring bankruptcy was believed to be the same in
any month. Also the number of small businesses that declared bankruptcy was the same
every month. Which of the following distributions would you use to determine the
probability that more than 3 bankruptcies will occur next month?
A) Hypergeometric distribution
B) Poisson distribution
C) Uniform distribution
D) Binomial distribution
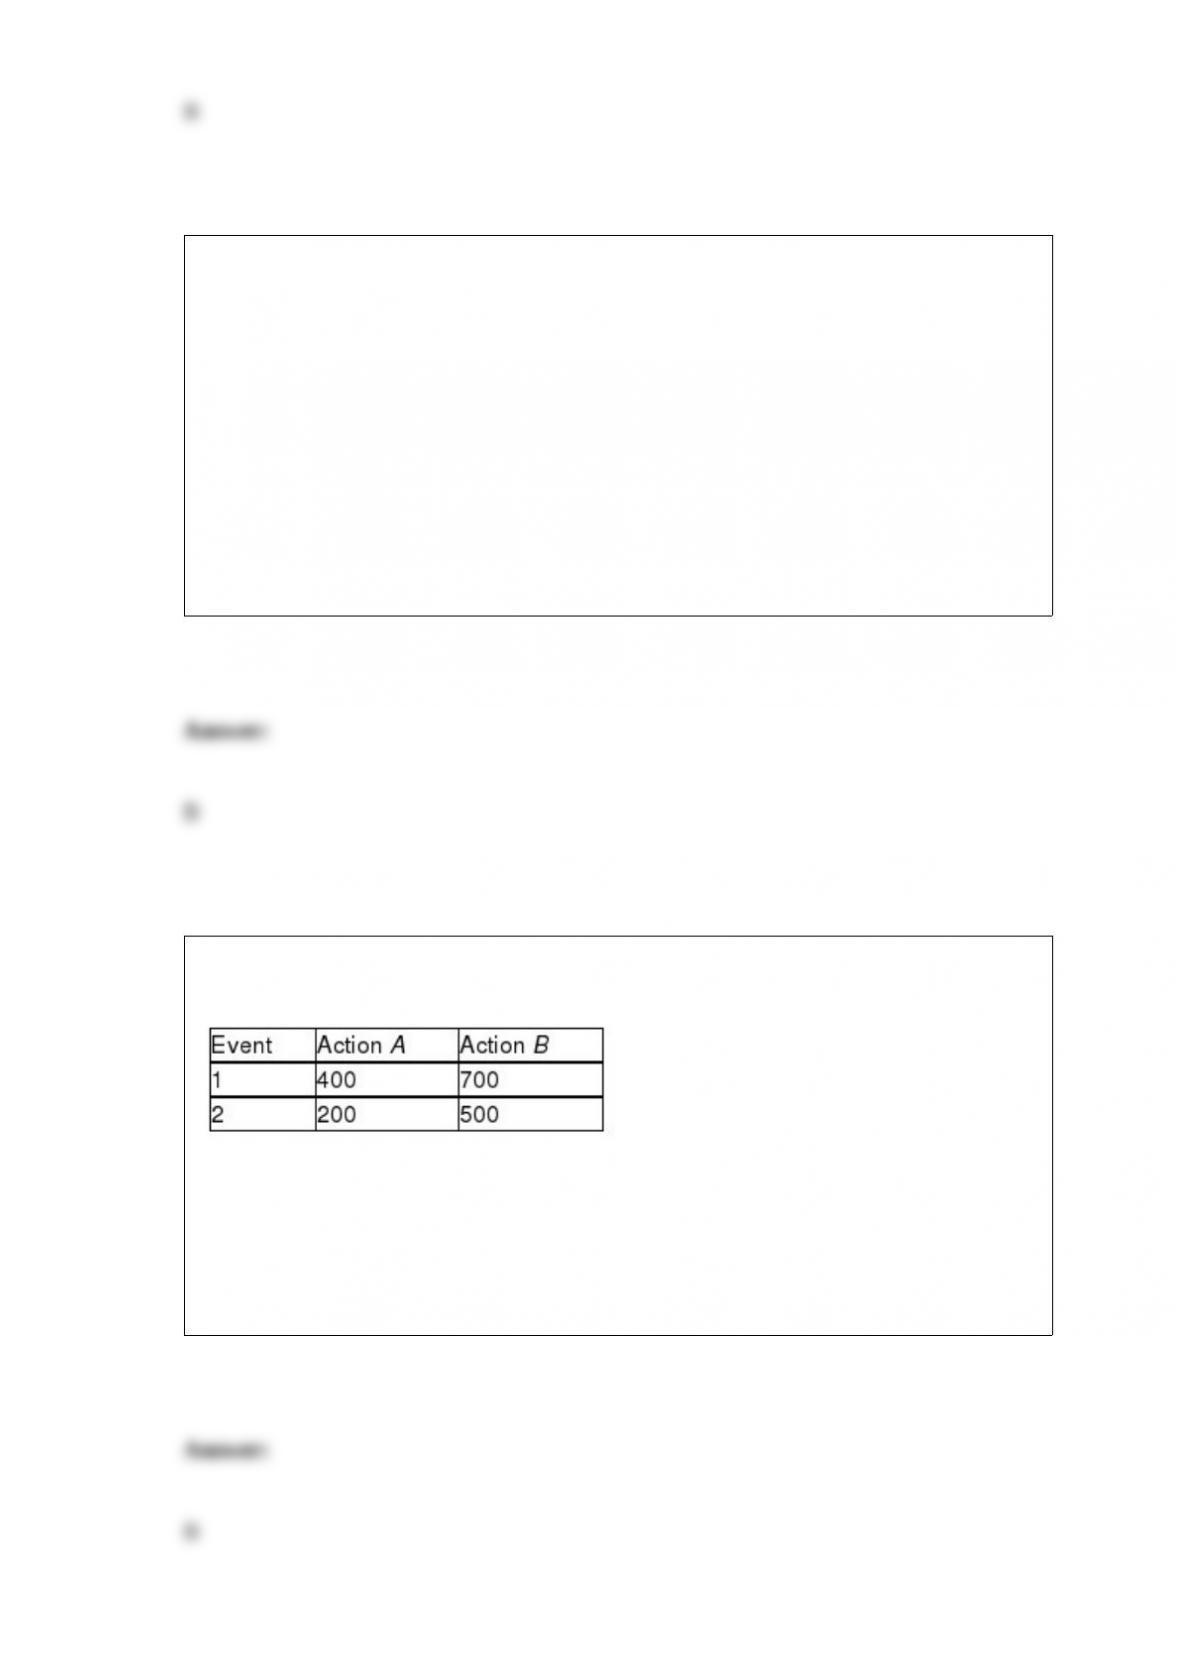
TABLE 19-2
The following payoff matrix is given in dollars.
Suppose the probability of Event 1 is 0.5 and Event 2 is 0.5.
Referring to Table 19-2, what is the optimal action using the EMV criterion?
A) Action A
B) Action B
C) Either Action A or Action B
D) It cannot be determined.

Referring to Table 14-15, which of the following is a correct
statement?
TABLE 14-15
The superintendent of a school district wanted to predict the
percentage of students passing a sixth-grade pro”ciency test. She
obtained the data on percentage of students passing the pro”ciency
test (% Passing), mean teacher salary in thousands of dollars
(Salaries), and instructional spending per pupil in thousands of dollars
(Spending) of 47 schools in the state.
Following is the multiple regression output with Y = % Passing as the
dependent variable, X1 = Salaries and X2 = Spending:
A) 14.57% of the total variation in the percentage of students passing
the pro”ciency test can be explained by mean teacher salary and
instructional spending per pupil.
B) 14.57% of the total variation in the percentage of students passing
the pro”ciency test can be explained by mean teacher salary and
instructional spending per pupil after adjusting for the number of
predictors and sample size.
C) 14.57% of the total variation in the percentage of students passing
the pro”ciency test can be explained by mean teacher salary holding
constant the effect of instructional spending per pupil.
D) 14.57% of the total variation in the percentage of students passing
the pro”ciency test can be explained by instructional spending per
pupil holding constant the effect of mean teacher salary.
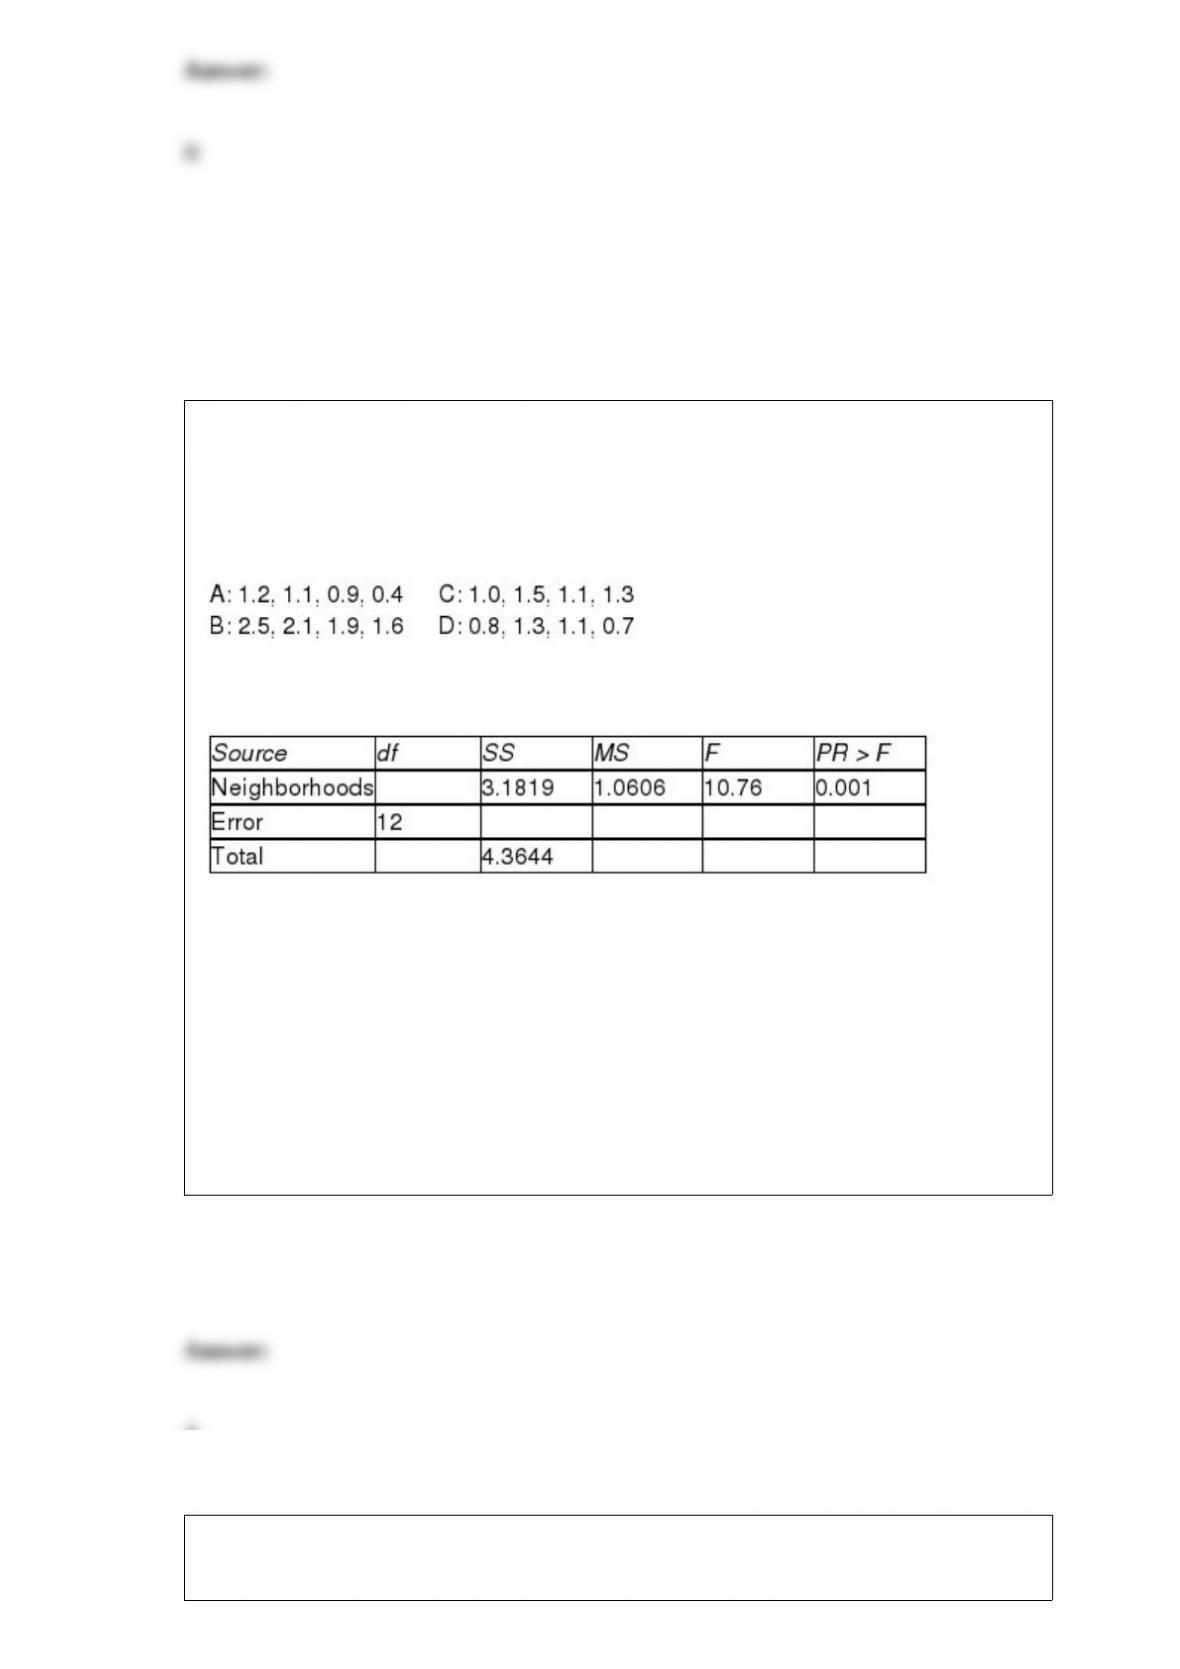
TABLE 11-2
A realtor wants to compare the mean sales-to-appraisal ratios of residential properties
sold in four neighborhoods (A, B, C, and D). Four properties are randomly selected
from each neighborhood and the ratios recorded for each, as shown below.
Interpret the results of the analysis summarized in the following table:
Referring to Table 11-2, the among group degrees of freedom is
A) 3.
B) 4.
C) 12.
D) 16.
TABLE 16-3
The following table contains the number of complaints received in a department store
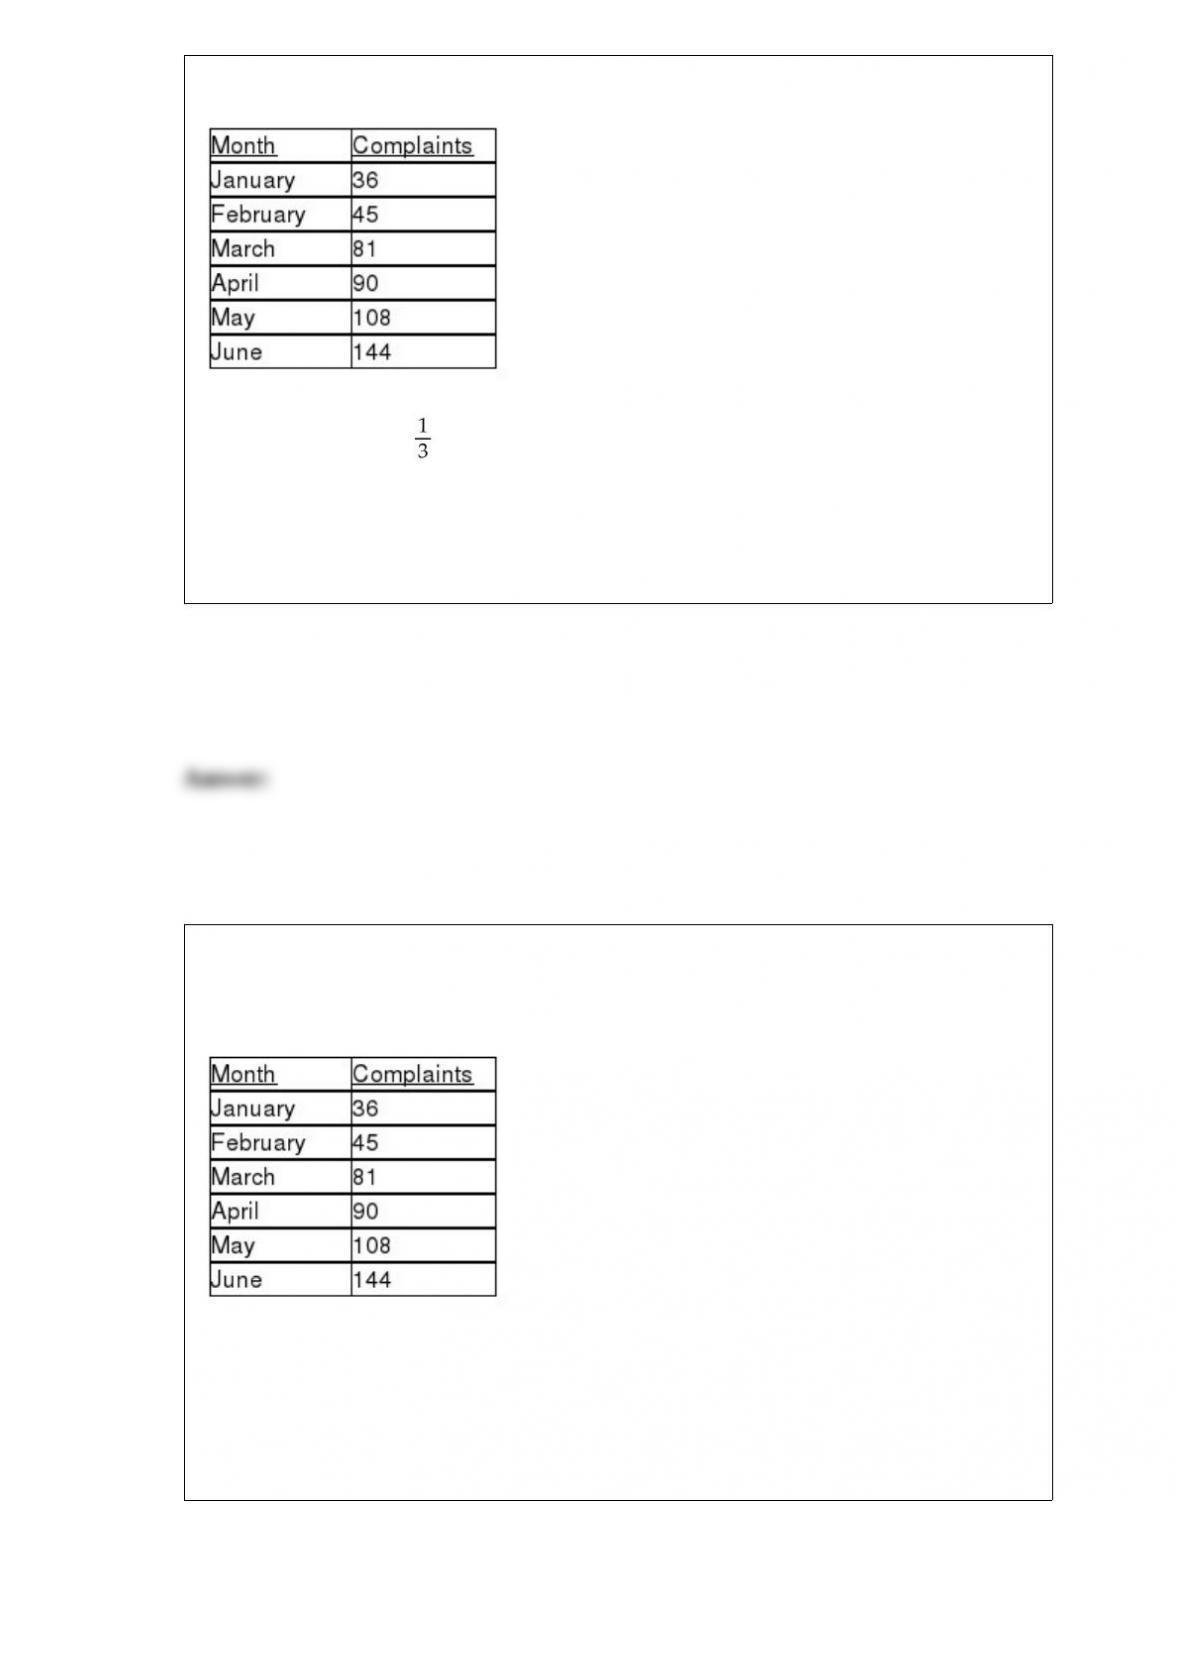
for the first 6 months of last year.
Referring to Table 16-3, if this series is smoothed using exponential smoothing with a
smoothing constant of , what would be the third value?
A) 53
B) 65.33
C) 68
D) 81
TABLE 16-3
The following table contains the number of complaints received in a department store
for the first 6 months of last year.
Referring to Table 16-3, if a three-month moving average is used to smooth this series,
what would be the last calculated value?
A) 72
B) 93
C) 114
D) 126

A catalog company that receives the majority of its orders by telephone conducted a
study to determine how long customers were willing to wait on hold before ordering a
product. The length of waiting time was found to be a variable best approximated by an
exponential distribution with a mean length of waiting time equal to 3 minutes (i.e. the
mean number of calls answered in a minute is ). Find the waiting time at which only
10% of the customers will continue to hold.
A) 2.3 minutes
B) 3.3 minutes
C) 6.9 minutes
D) 13.8 minutes
A tabular presentation that shows the outcome for each decision alternative under the
various states of nature is called
A) a payback period matrix.
B) a decision matrix.
C) a decision tree.
D) a payoff table.
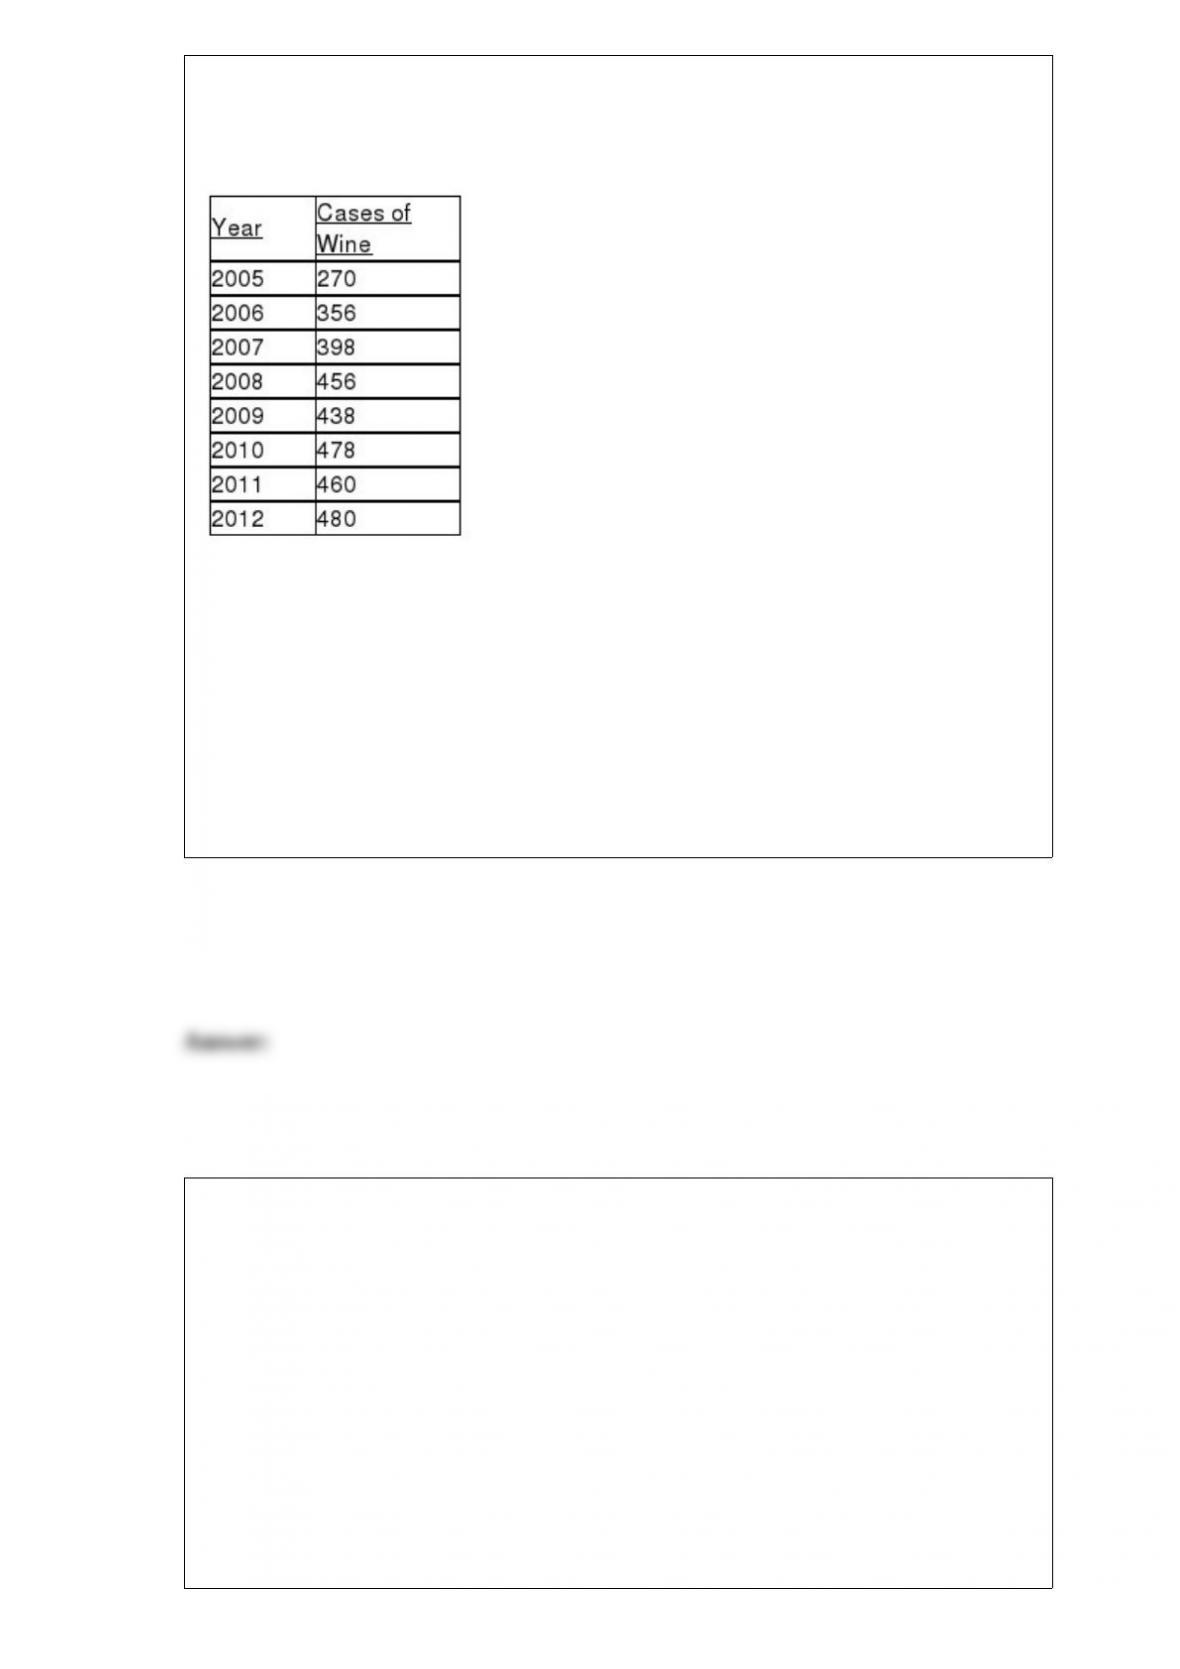
TABLE 16-1
The number of cases of chardonnay wine sold by a Paso Robles winery in an 8-year
period follows.
Referring to Table 16-1, does there appear to be a relationship between year and the
number of cases of wine sold?
A) No, there appears to be no relationship between the year and the number of cases of
wine sold by the vintner.
B) Yes, there appears to be a slight negative linear relationship between the year and the
number of cases of wine sold by the vintner.
C) Yes, there appears to be a slight positive relationship between the year and the
number of cases of wine sold by the vintner.
D) Yes, there appears to be a negative nonlinear relationship between the year and the
number of cases of wine sold by the vintner.
TABLE 6-7
A company has 125 personal computers. The probability that any one of them will
require repair on a given day is 0.15.
Referring to Table 6-7, which of the following is one of the properties required so that
the binomial distribution can be used to compute the probability that no more than 2
computers will require repair on a given day?
A) The probability that a computer that will require repair in the morning is the same as
that in the afternoon.
B) A randomly selected computer on a given day will either require a repair or will not.

C) The number of computers that will require repair in the morning is independent of
the number of computers that will require repair in the afternoon.
D) The probability that two or more computers that will require repair in a given day
approaches zero.
TABLE 4-5
In a meat packaging plant Machine A accounts for 60% of the plant’s output, while
Machine B accounts for 40% of the plant’s output. In total, 4% of the packages are
improperly sealed. Also, 3% of the packages are from Machine A and are improperly
sealed.
Referring to Table 4-5, if a package selected at random is improperly sealed, the
probability that it came from machine A is ________.
TABLE 10-7
A buyer for a manufacturing plant suspects that his primary supplier of raw materials is
overcharging. In order to determine if his suspicion is correct, he contacts a second
supplier and asks for the prices on various identical materials. He wants to compare
these prices with those of his primary supplier. The data collected is presented in the
table below, with some summary statistics presented (all of these might not be
necessary to answer the questions which follow). The buyer believes that the
differences are normally distributed and will use this sample to perform an appropriate
test at a level of significance of 0.01.
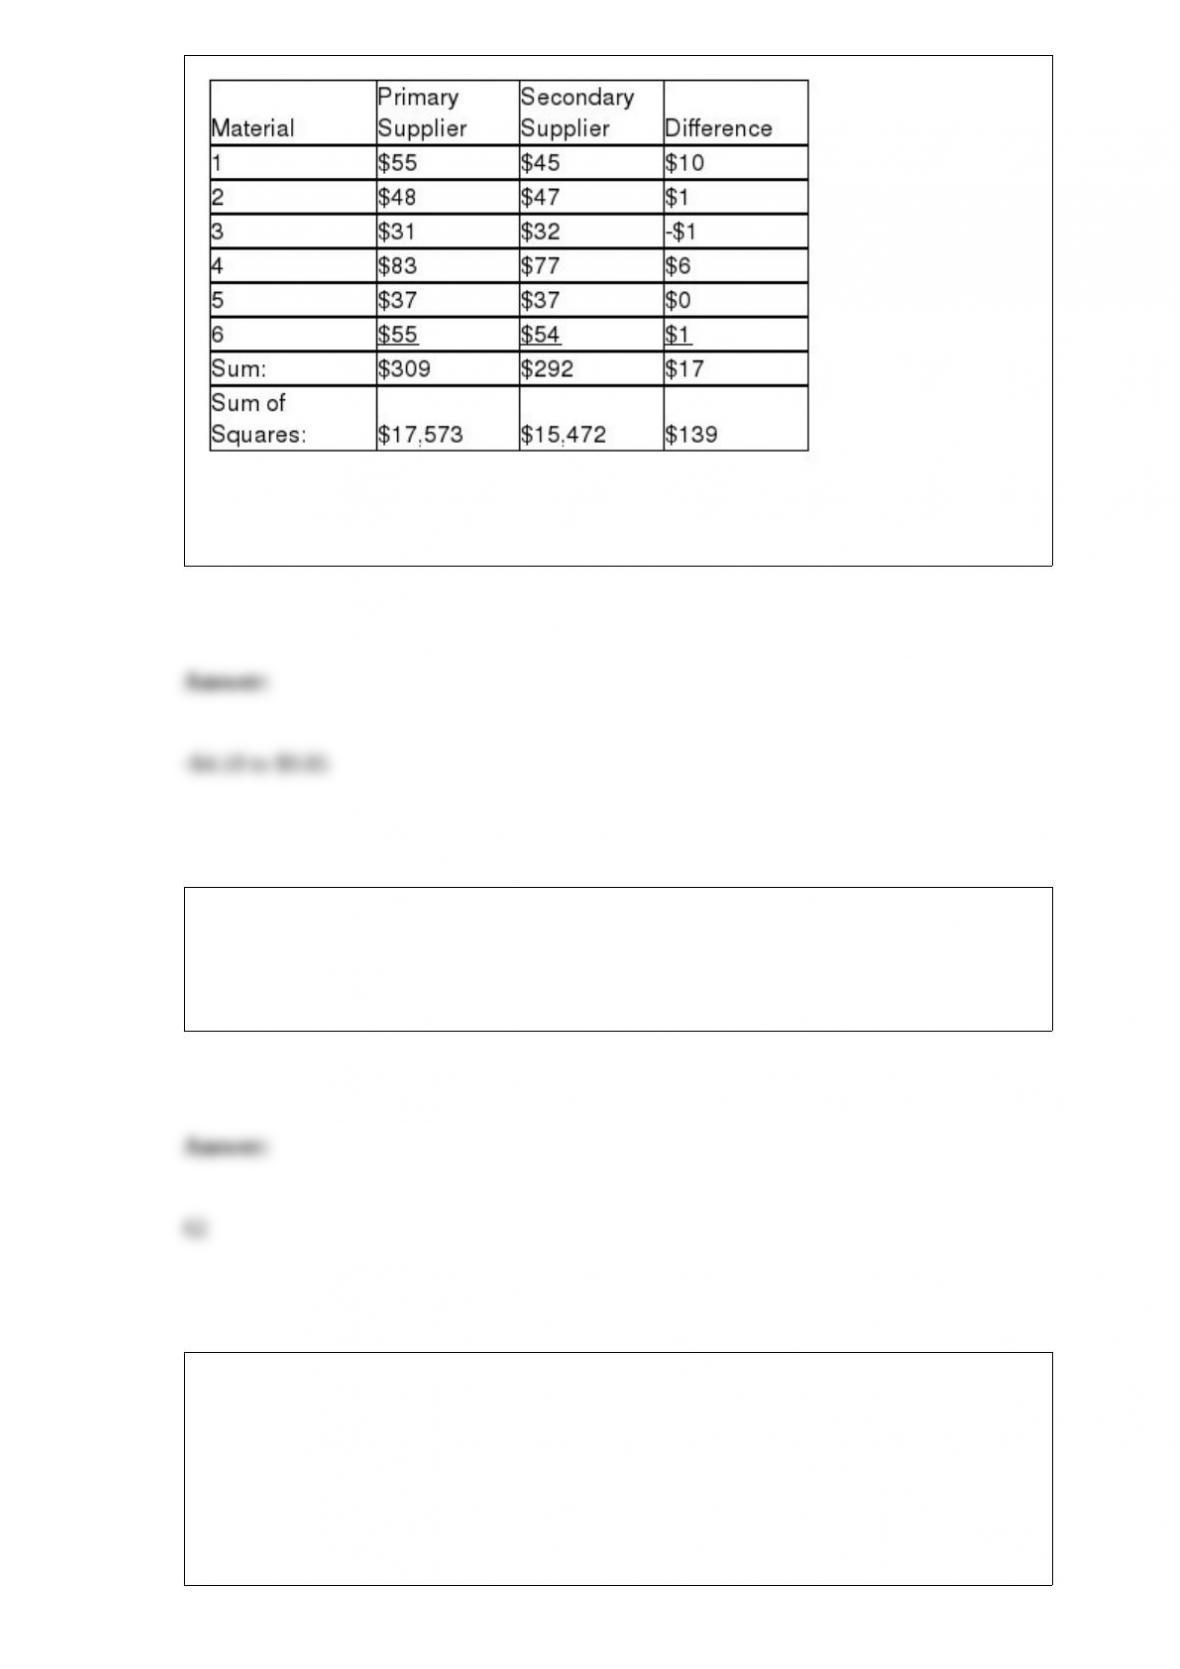
Referring to Table 10-7, what is the 99% confidence interval estimate for the mean
difference in prices?
Suppose a department store wants to estimate the mean age of the customers of its
contemporary apparel department, correct to within 2 years, with level of confidence
equal to 95%. Management believes that the standard deviation is 8 years. The sample
size they should take is ________.
TABLE 17-8
The superintendent of a school district wanted to predict the percentage of students
passing a sixth-grade proficiency test. She obtained the data on percentage of students
passing the proficiency test (% Passing), daily mean of the percentage of students
attending class (% Attendance), mean teacher salary in dollars (Salaries), and
instructional spending per pupil in dollars (Spending) of 47 schools in the state.
Following is the multiple regression output with Y = % Passing as the dependent
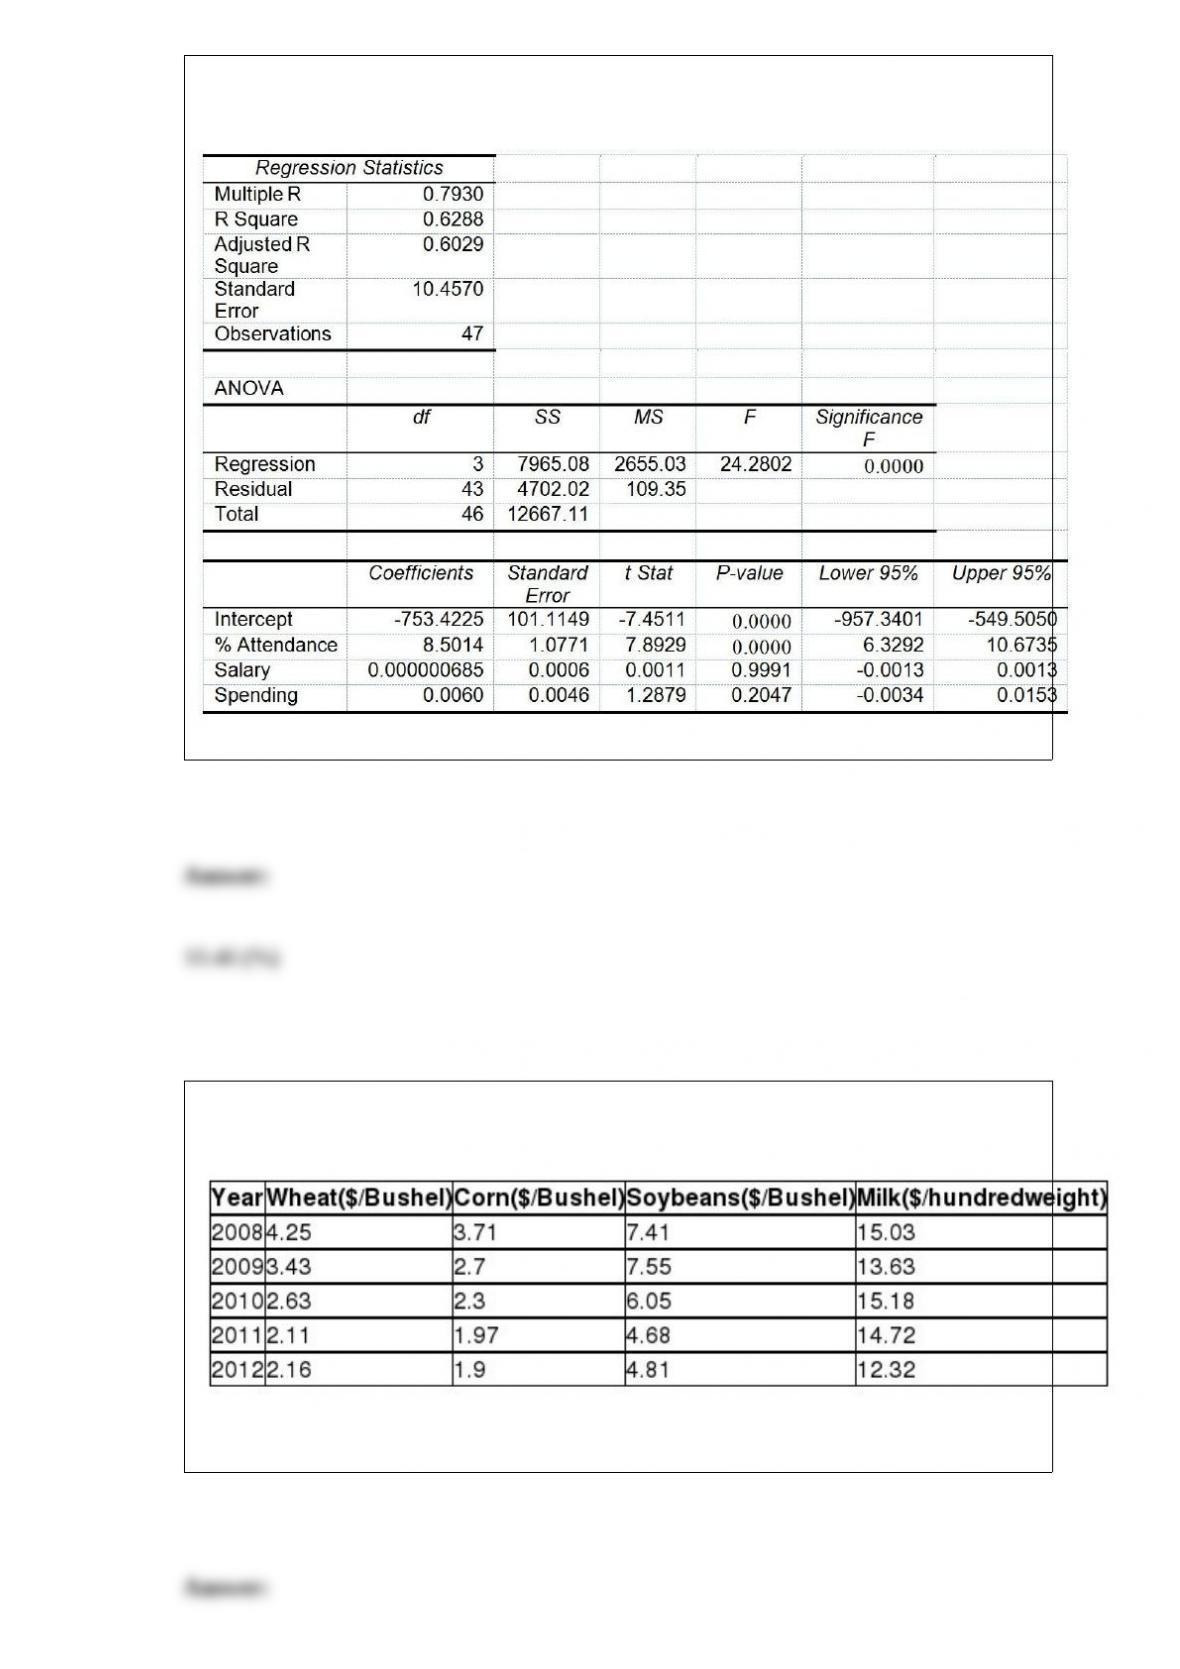
variable, X1 = % Attendance, X2 = Salaries and X3 = Spending:
Referring to Table 17-8, what is the standard error of estimate?
TABLE 16-16
Given below are the prices of a basket of four food items from 2008 to 2012.
Referring to Table 16-16, what are the simple price indices for wheat, corn, soybeans
and milk, respectively, in 2010 using 2008 as the base year?

Referring to Table 14-8, the value of the F-statistic for testing the
signi”cance of the entire regression is ________.TABLE 14-8
A “nancial analyst wanted to examine the relationship between salary
(in $1,000) and 2 variables: age
(X1 = Age) and experience in the “eld (X2 = Exper). He took a sample
of 20 employees and obtained the following Microsoft Excel output:
Also, the sum of squares due to the regression for the model that
includes only Age is 5022.0654 while the sum of squares due to the
regression for the model that includes only Exper is 125.9848.
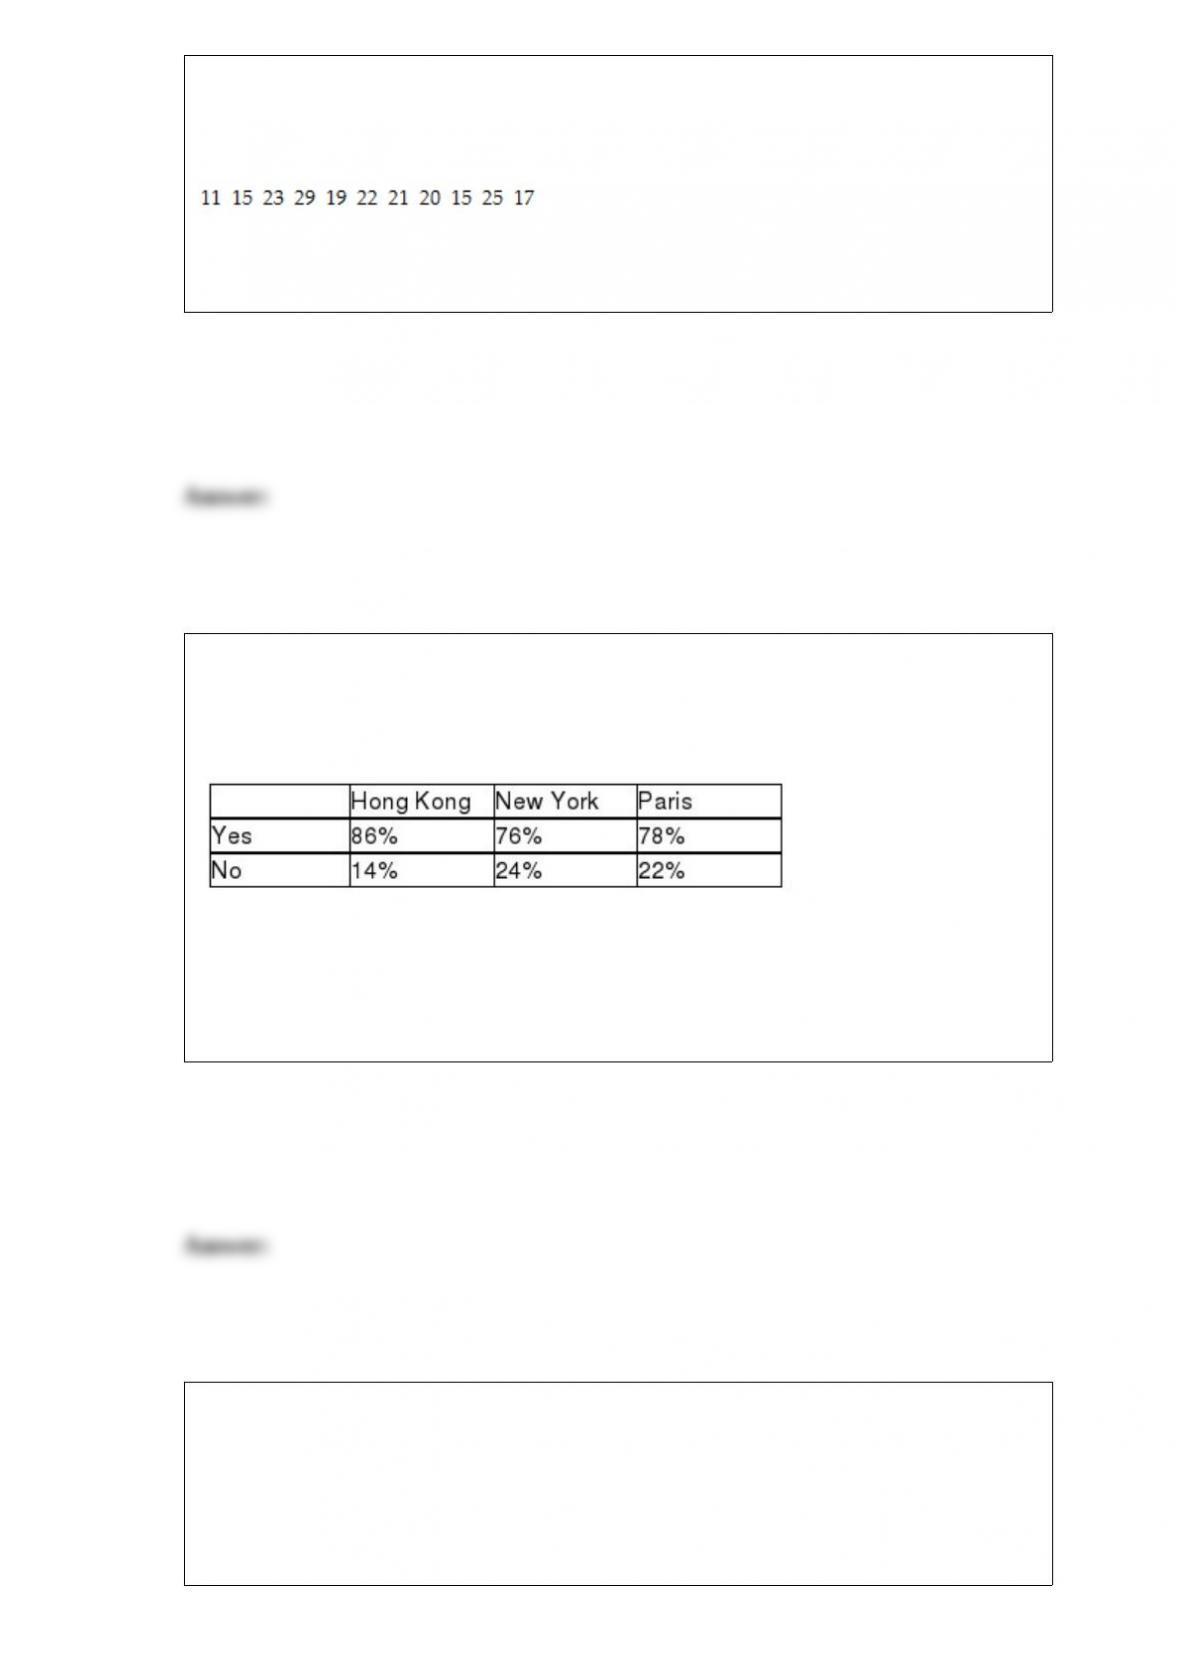
TABLE 3-2
The data below represent the amount of grams of carbohydrates in a serving of
breakfast cereal in a sample of 11 different servings.
Referring to Table 3-2, is the carbohydrate amount in the cereal leptokurtic or
platykurtic?
TABLE 12-7
Data on the percentage of 200 hotels in each of the three large cities across the world on
whether minibar charges are correctly posted at checkout are given below.
At the 0.05 level of significance, you want to know if there is evidence of a difference
in the proportion of hotels that correctly post minibar charges among the three cities.
Referring to Table 12-7, the critical value of the test is ________.
TABLE 9-10
A manufacturer produces light bulbs that have a mean life of at least 500 hours when
the production process is working properly. Based on past experience, the population
standard deviation is 50 hours and the light bulb life is normally distributed. The
operations manager stops the production process if there is evidence that the population

mean light bulb life is below 500 hours.
Referring to Table 9-10, if you select a sample of 100 light bulbs and are willing to have
a level of significance of 0.05, the probability of the operations manager not stopping
the process when the process is in fact working properly is in fact below 500 hours is
________.
TABLE 3-7
In a recent academic year, many public universities in the United States raised tuition
and fees due to a decrease in state subsidies. The change in the cost of tuition, a shared
dormitory room, and the most popular meal plan from the previous academic year for a
sample of 10 public universities were as follows: $1,589, $593, $1,223, $869, $423,
$1,720, $708, $1,425, $922 and $308.
Referring to Table 3-7, what is the mean and median change in the cost?