True or False: “Big data” are data being collected in huge volumes and at very fast
rates, and they typically arrive in a variety of forms, organized and unorganized.
True or False: The amount of calories contained in a 12-ounce package of cheese is an
example of a discrete variable.
True or False: Data were collected on the amount of detergent used in gallons in a
month by 25 drive-through car wash operations in Phoenix. You can use a time-series
plot to present this information.
True or False: The Guidelines for Developing Visualizations recommend using the
simplest possible visualization.
True or False: The Z scores can be used to identify outliers.
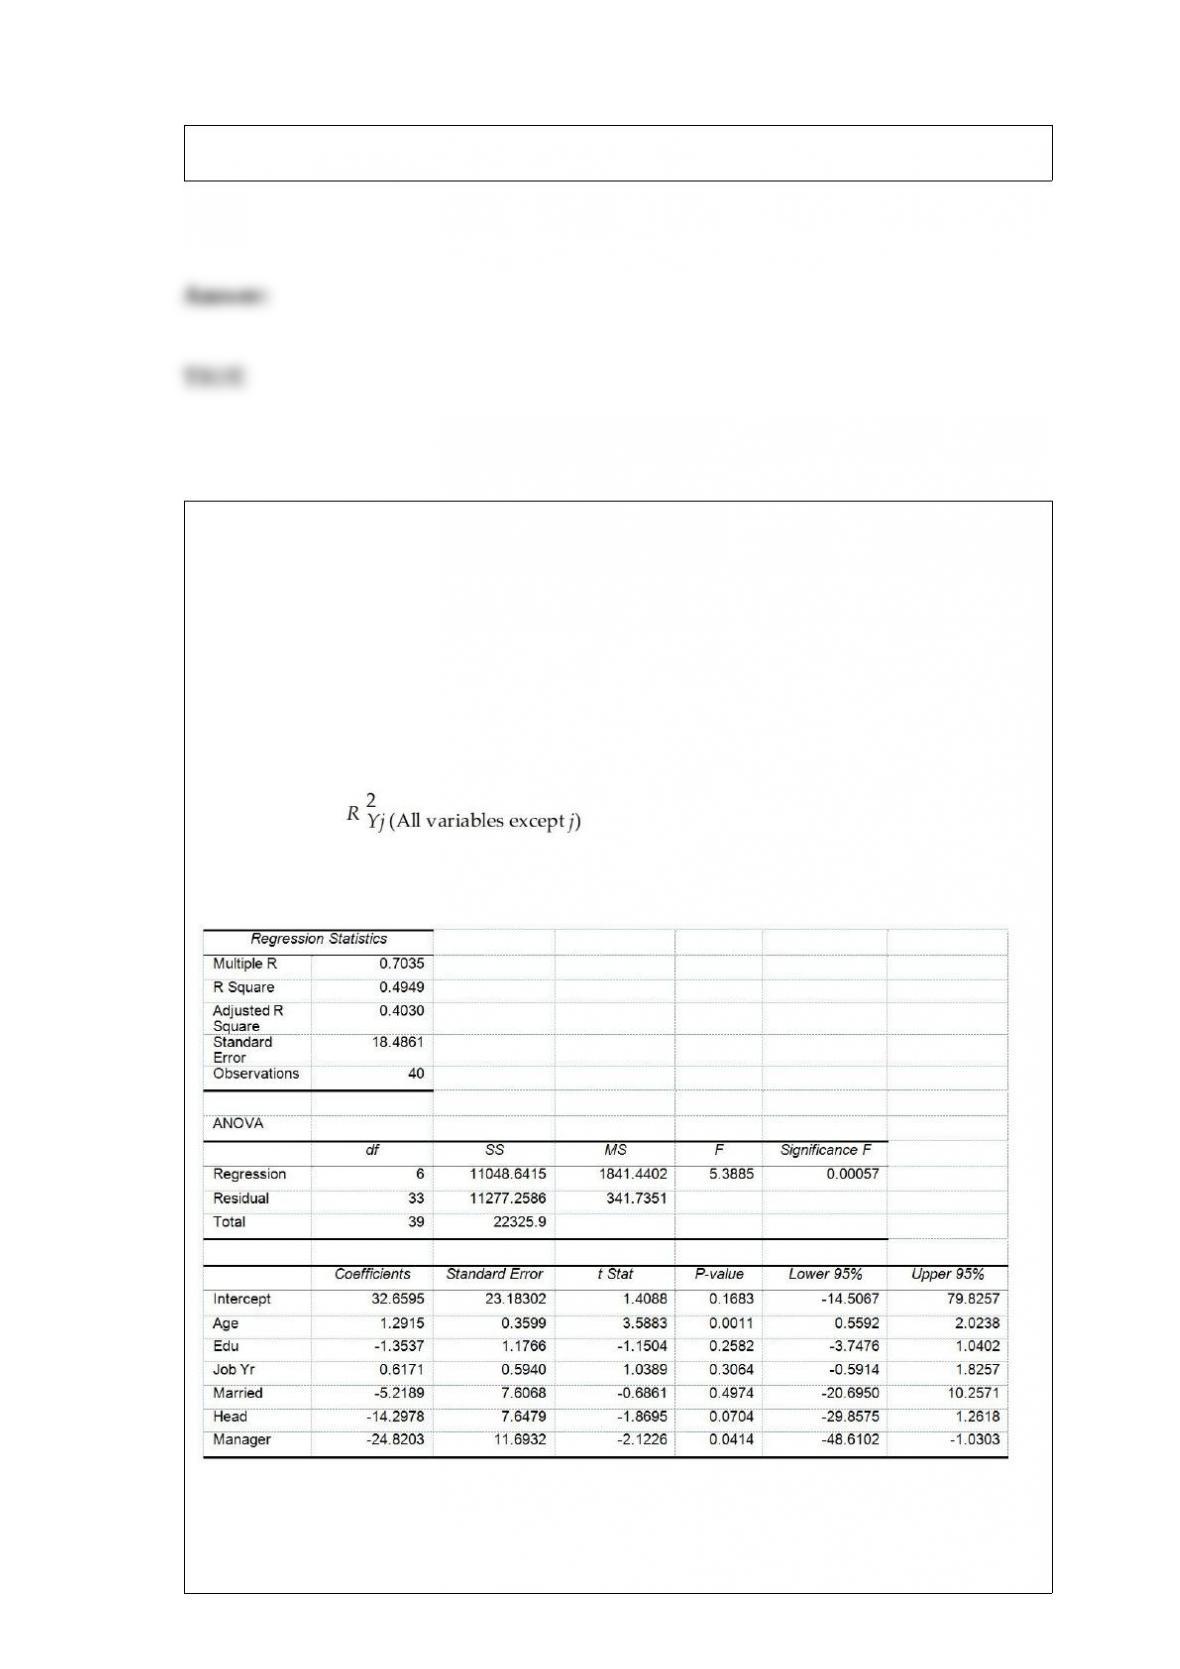
True or False: TABLE 17-10
Given below are results from the regression analysis where the dependent variable is
the number of weeks a worker is unemployed due to a layoff (Unemploy) and the
independent variables are the age of the worker (Age), the number of years of education
received (Edu), the number of years at the previous job (Job Yr), a dummy variable for
marital status (Married: 1 = married, 0 = otherwise), a dummy variable for head of
household (Head: 1 = yes, 0 = no) and a dummy variable for management position
(Manager: 1 = yes, 0 = no). We shall call this Model 1. The coefficient of partial
determination ( ) of each of the 6 predictors are, respectively,
0.2807, 0.0386, 0.0317, 0.0141, 0.0958, and 0.1201.
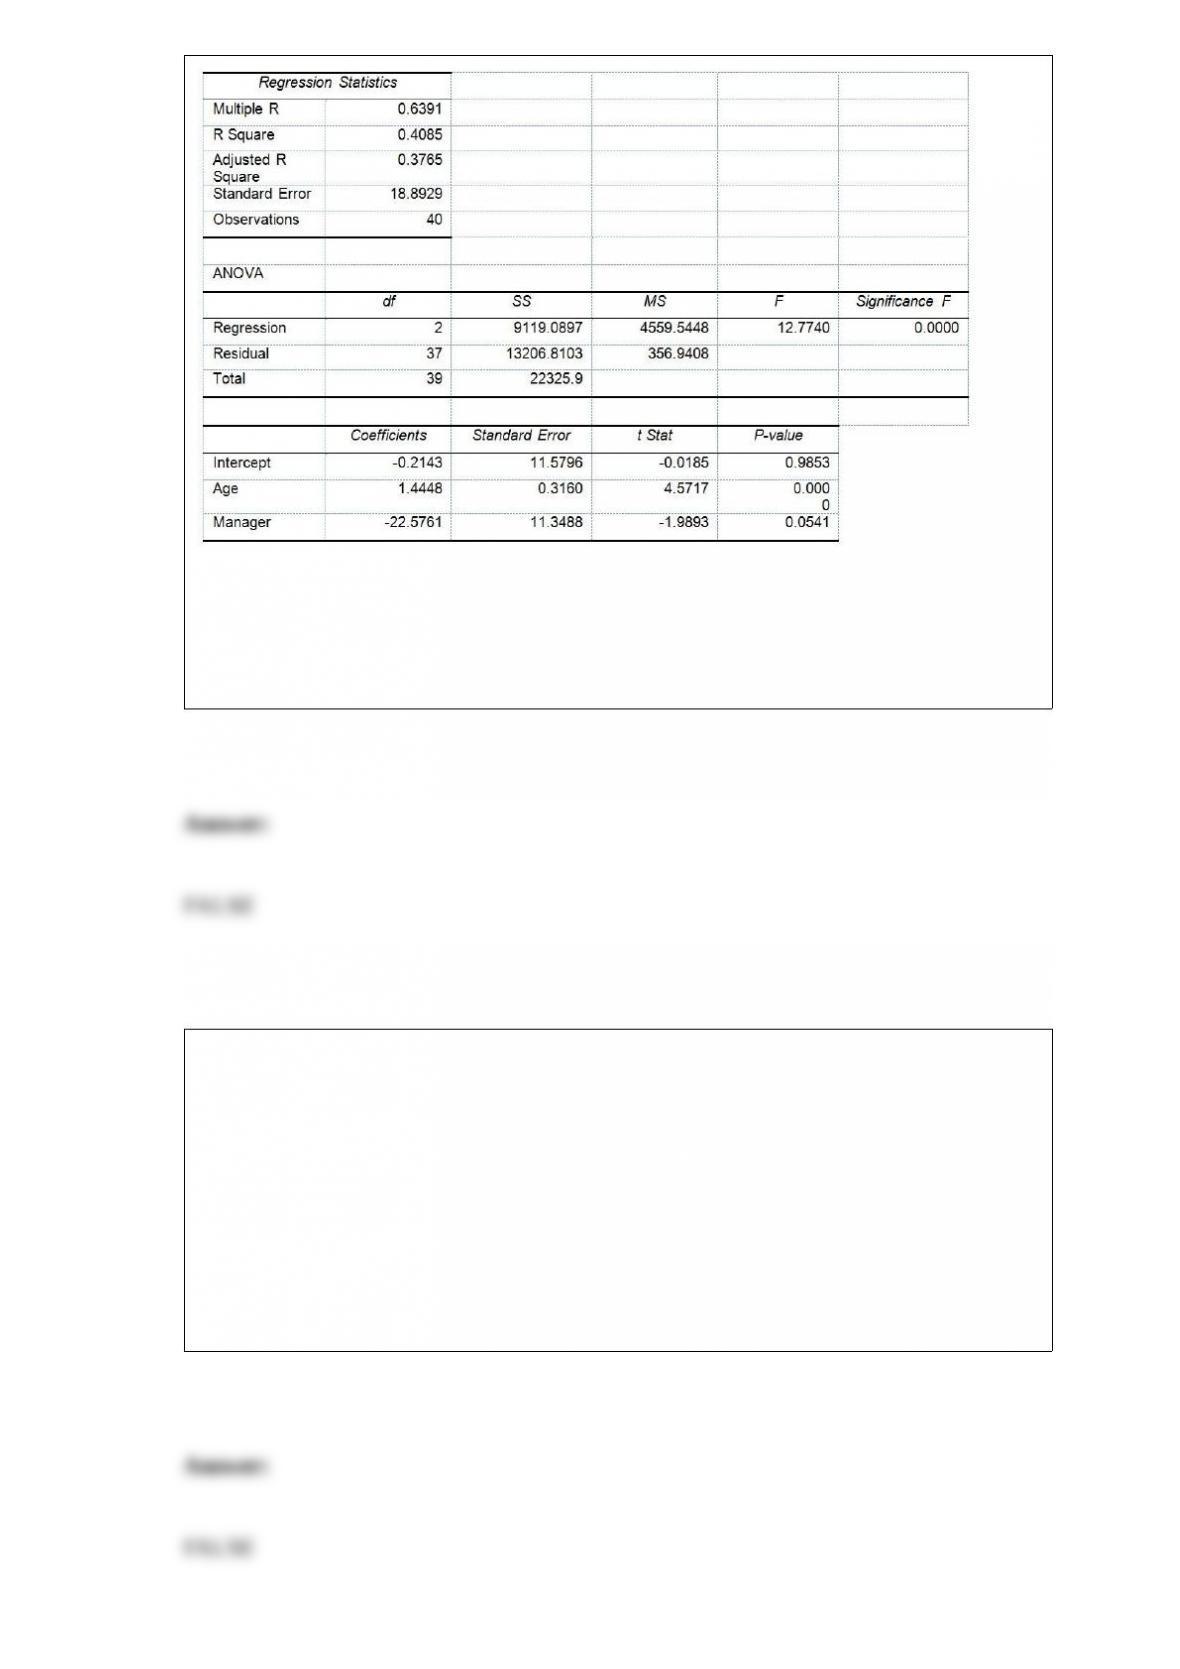
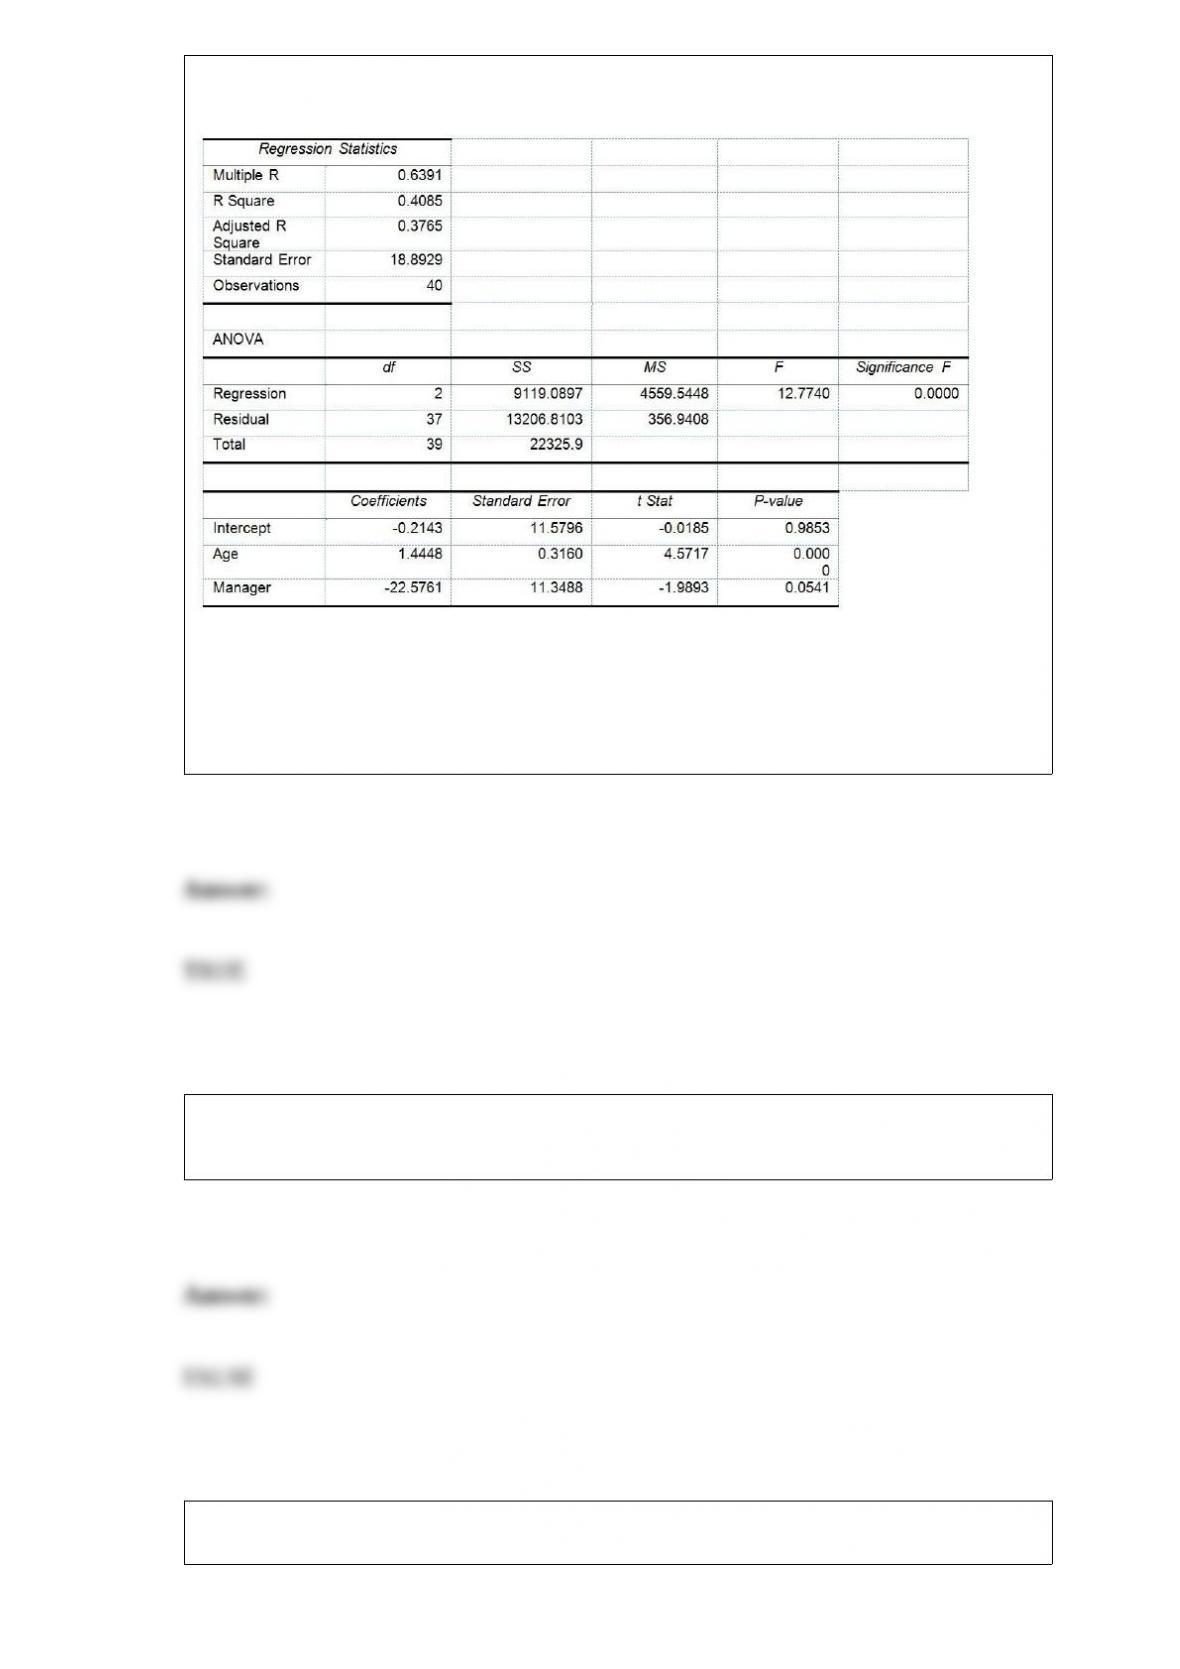
Model 2 is the regression analysis where the dependent variable is Unemploy and the
independent variables are Age and Manager. The results of the regression analysis are
given below:
Referring to Table 17-10, Model 1, the null hypothesis should be rejected at a 10% level
of significance when testing whether being married or not makes a difference in the
mean number of weeks a worker is unemployed due to a layoff while holding constant
the effect of all the other independent variables.
TABLE 8-9
A university wanted to find out the percentage of students who felt comfortable
reporting cheating by their fellow students. A survey of 2,800 students was conducted
and the students were asked if they felt comfortable reporting cheating by their fellow
students. The results were 1,344 answered “Yes” and 1,456 answered “No.”
True or False: Referring to Table 8-9, a confidence interval estimate of the population
proportion would only be valid if the distribution of the number of students who feel
comfortable reporting cheating by their fellow students is normal.
True or False: In forming a 90% confidence interval for a population mean from a
sample size of 22, the number of degrees of freedom from the t distribution equals 22.
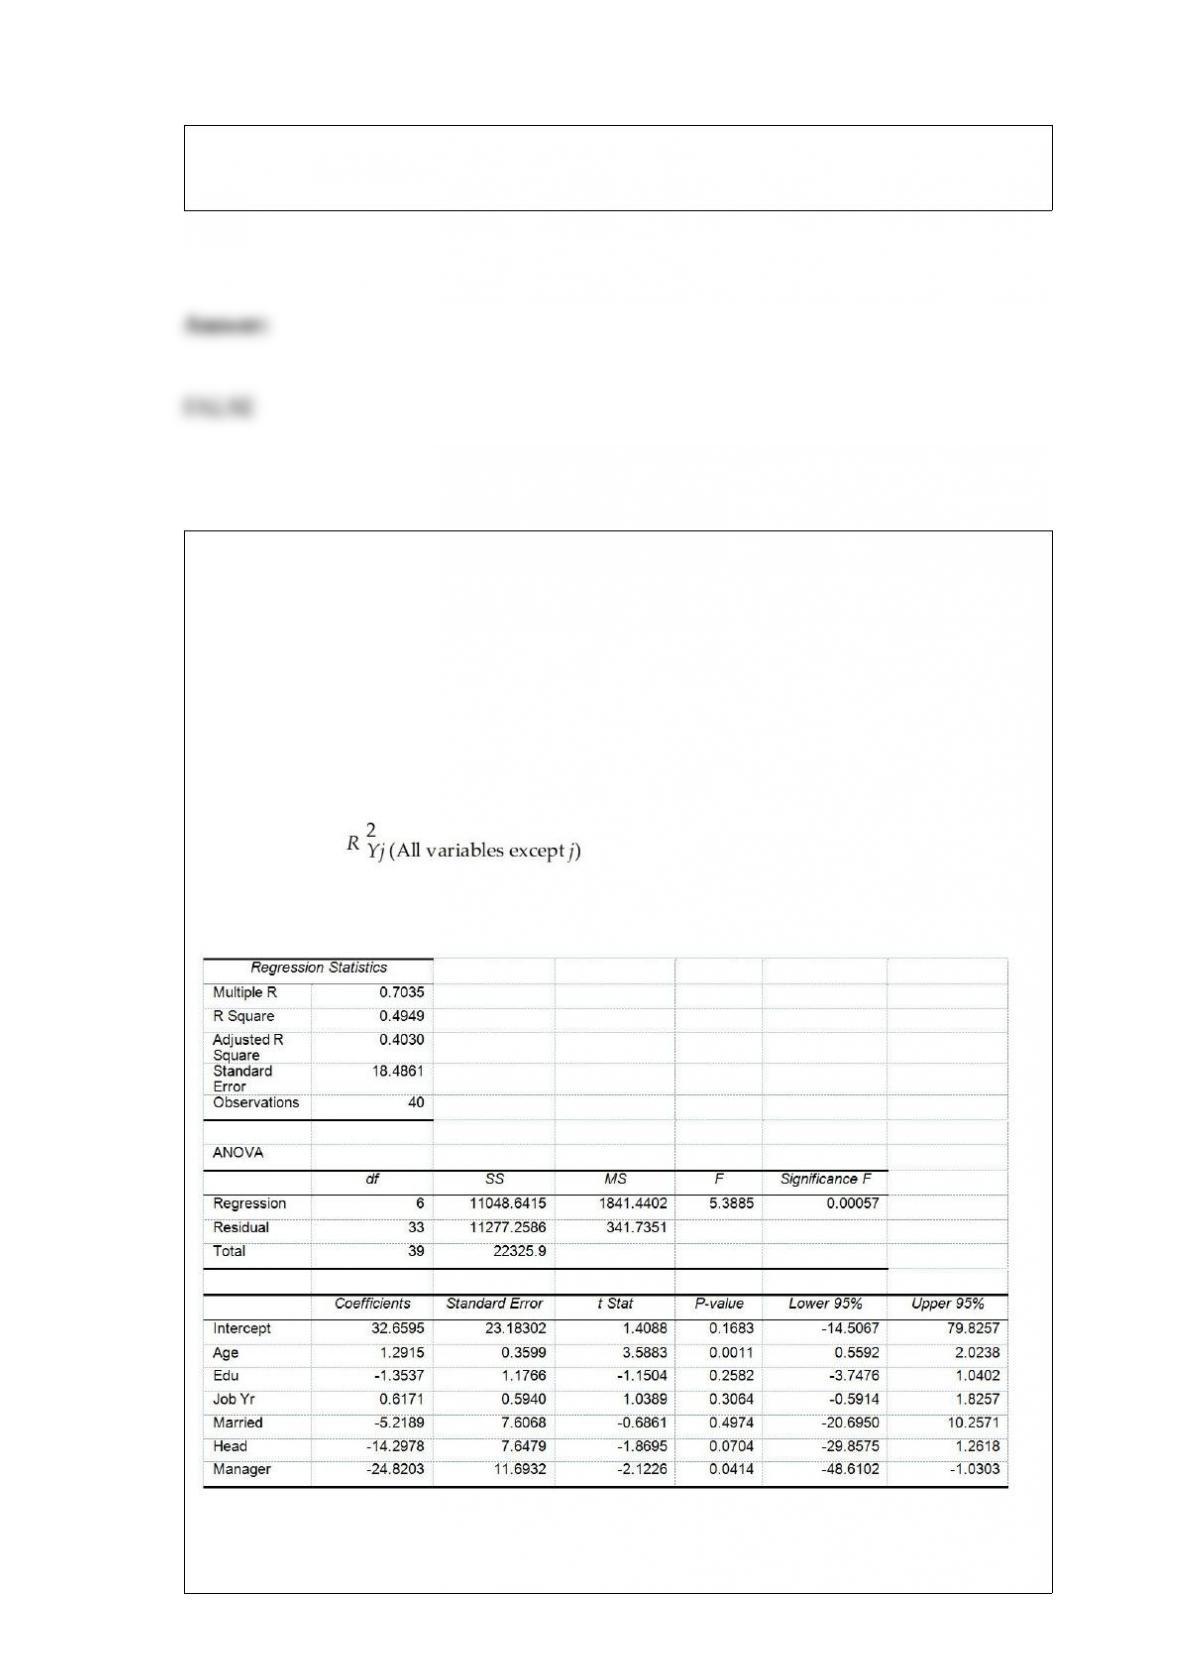
True or False: TABLE 17-10
Given below are results from the regression analysis where the dependent variable is
the number of weeks a worker is unemployed due to a layoff (Unemploy) and the
independent variables are the age of the worker (Age), the number of years of education
received (Edu), the number of years at the previous job (Job Yr), a dummy variable for
marital status (Married: 1 = married, 0 = otherwise), a dummy variable for head of
household (Head: 1 = yes, 0 = no) and a dummy variable for management position
(Manager: 1 = yes, 0 = no). We shall call this Model 1. The coefficient of partial
determination ( ) of each of the 6 predictors are, respectively,
0.2807, 0.0386, 0.0317, 0.0141, 0.0958, and 0.1201.
Model 2 is the regression analysis where the dependent variable is Unemploy and the
independent variables are Age and Manager. The results of the regression analysis are
given below:
Referring to Table 17-10, Model 1, the null hypothesis should be rejected at a 10% level
of significance when testing whether there is a significant relationship between the
number of weeks a worker is unemployed due to a layoff and the entire set of
explanatory variables.
True or False: The probability that a standard normal variable, Z, is less than 5.0 is
approximately 0.
True or False: Larger Cpk indicates larger capability of meeting the requirements.
True or False: Another name for the mean of a probability distribution is its expected
value.
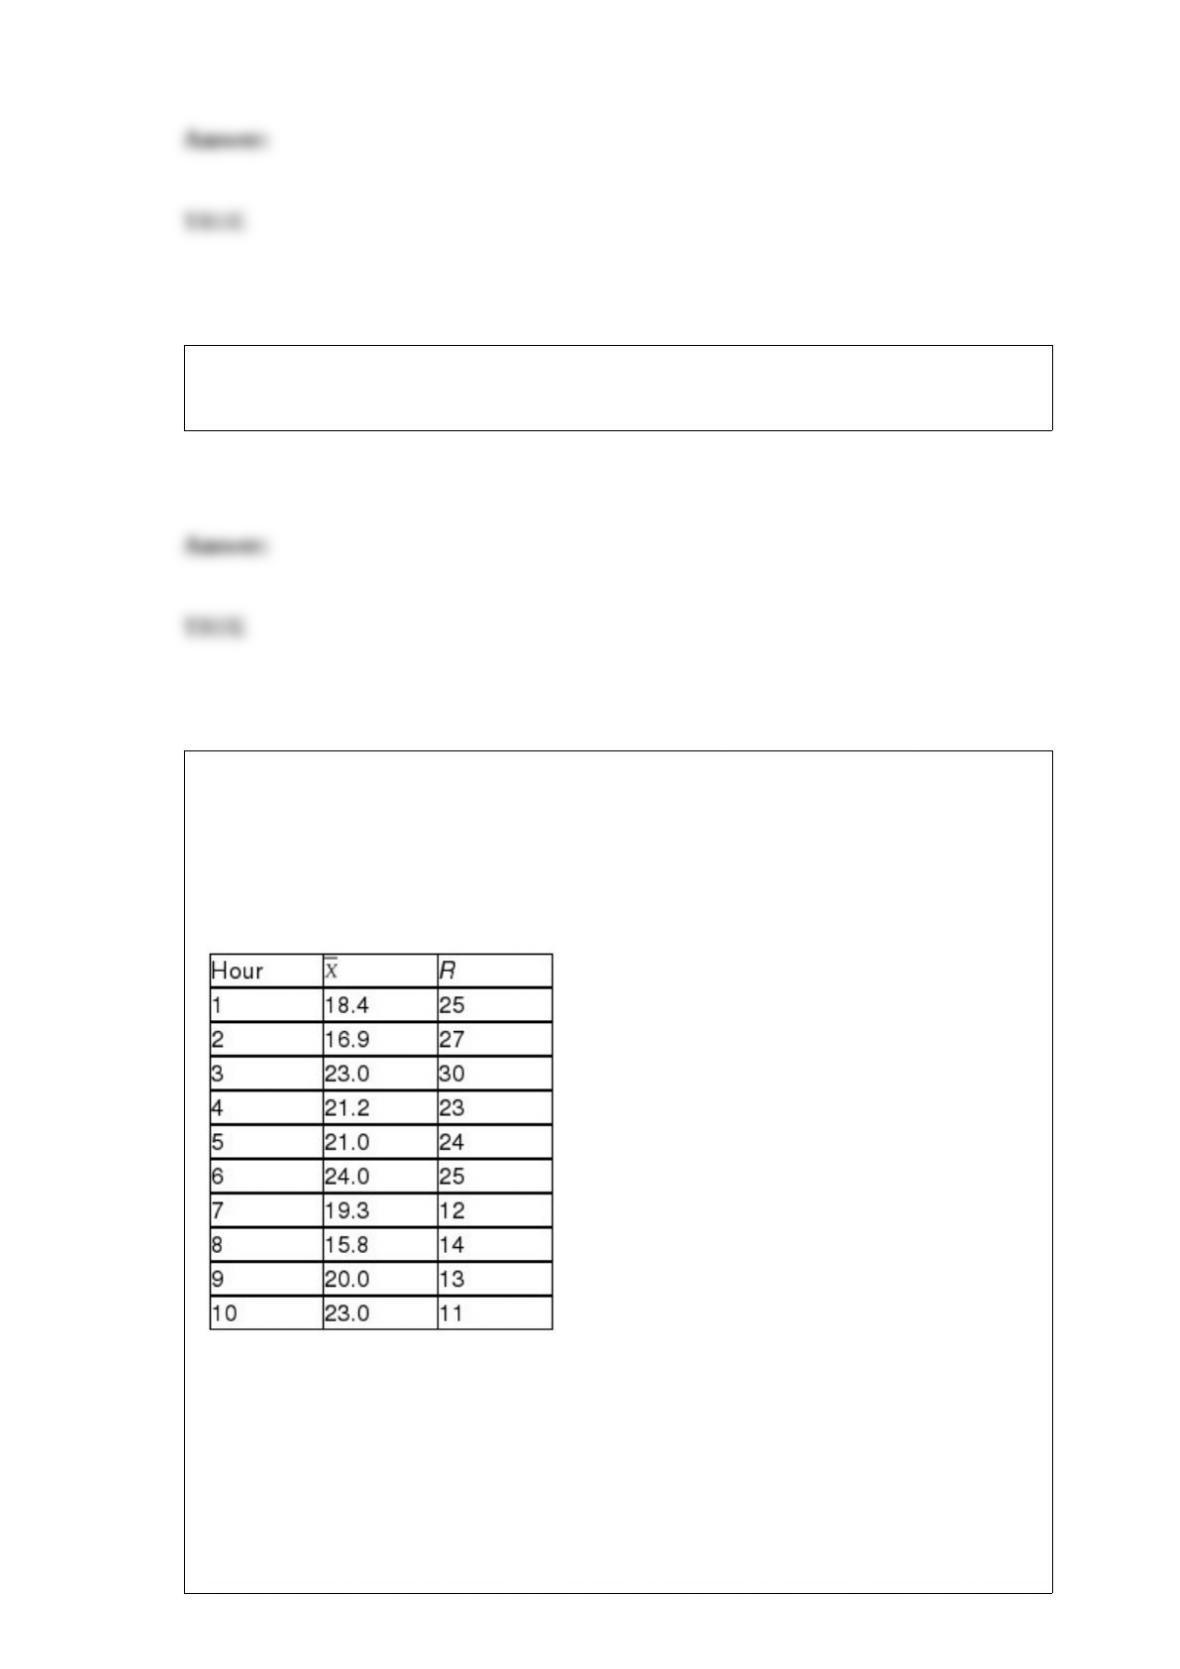
TABLE 18-4
A factory supervisor is concerned that the time it takes workers to complete an
important production task (measured in seconds) is too erratic and adversely affects
expected profits. The supervisor proceeds by randomly sampling 5 individuals per hour
for a period of 10 hours. The sample mean and range for each hour are listed below.
She also decides that lower and upper specification limit for the critical-to-quality
variable should be 10 and 30 seconds, respectively.
Referring to Table 18-4, suppose the supervisor constructs an R chart to see if the
variability in collection times is in-control. This R chart is characterized by which of the
following?
A) Decreasing trend
B) Increasing trend
C) In-control
D) Individual outliers
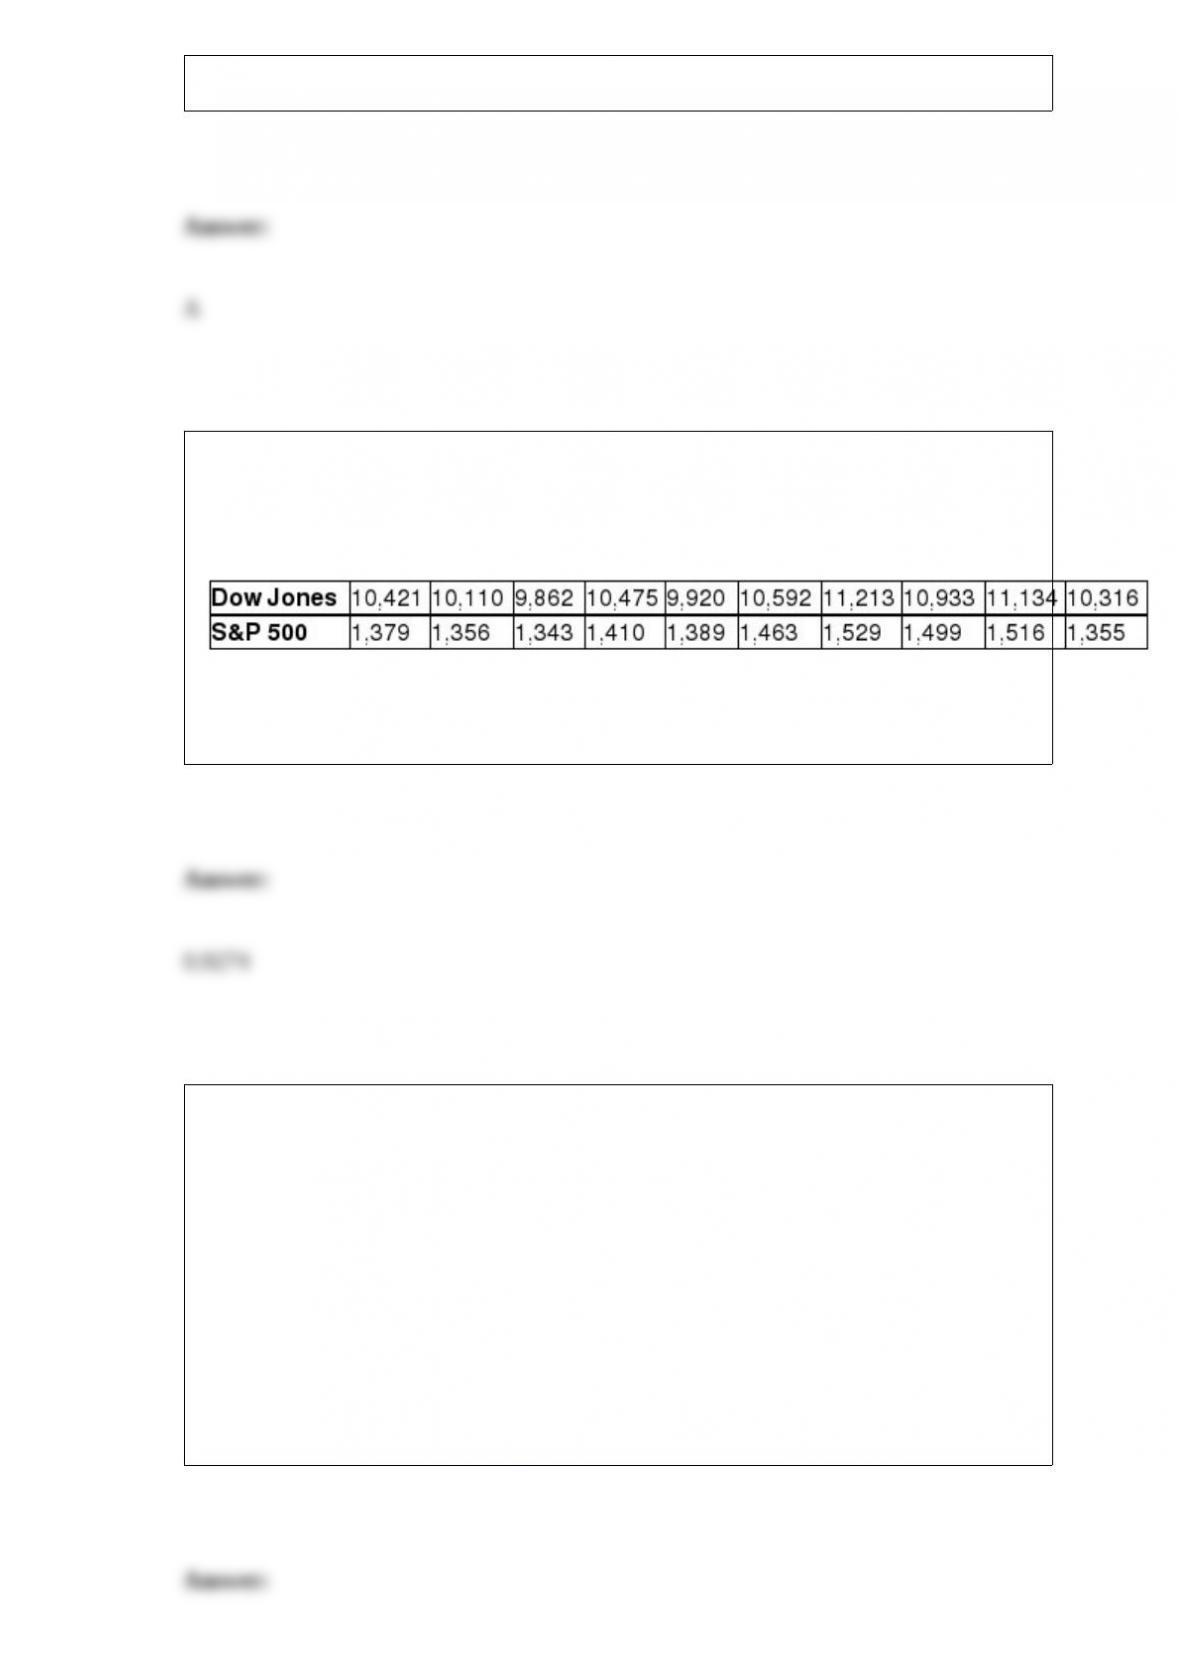
TABLE 3-11
Given below are the closing prices for the Dow Jones Industrial Average (DJIA) and the
Standard & Poor’s (S&P) 500 Index over 10 weeks.
Referring to Table 3-11, what is the sample correlation coefficient between the DJIA
and the S&P 500 index?
An economist is interested in studying the incomes of consumers in a particular country.
The population standard deviation is known to be $1,000. A random sample of 50
individuals resulted in a mean income of $15,000. What is the upper end point in a 99%
confidence interval for the average income?
A) $15,052
B) $15,141
C) $15,330
D) $15,364
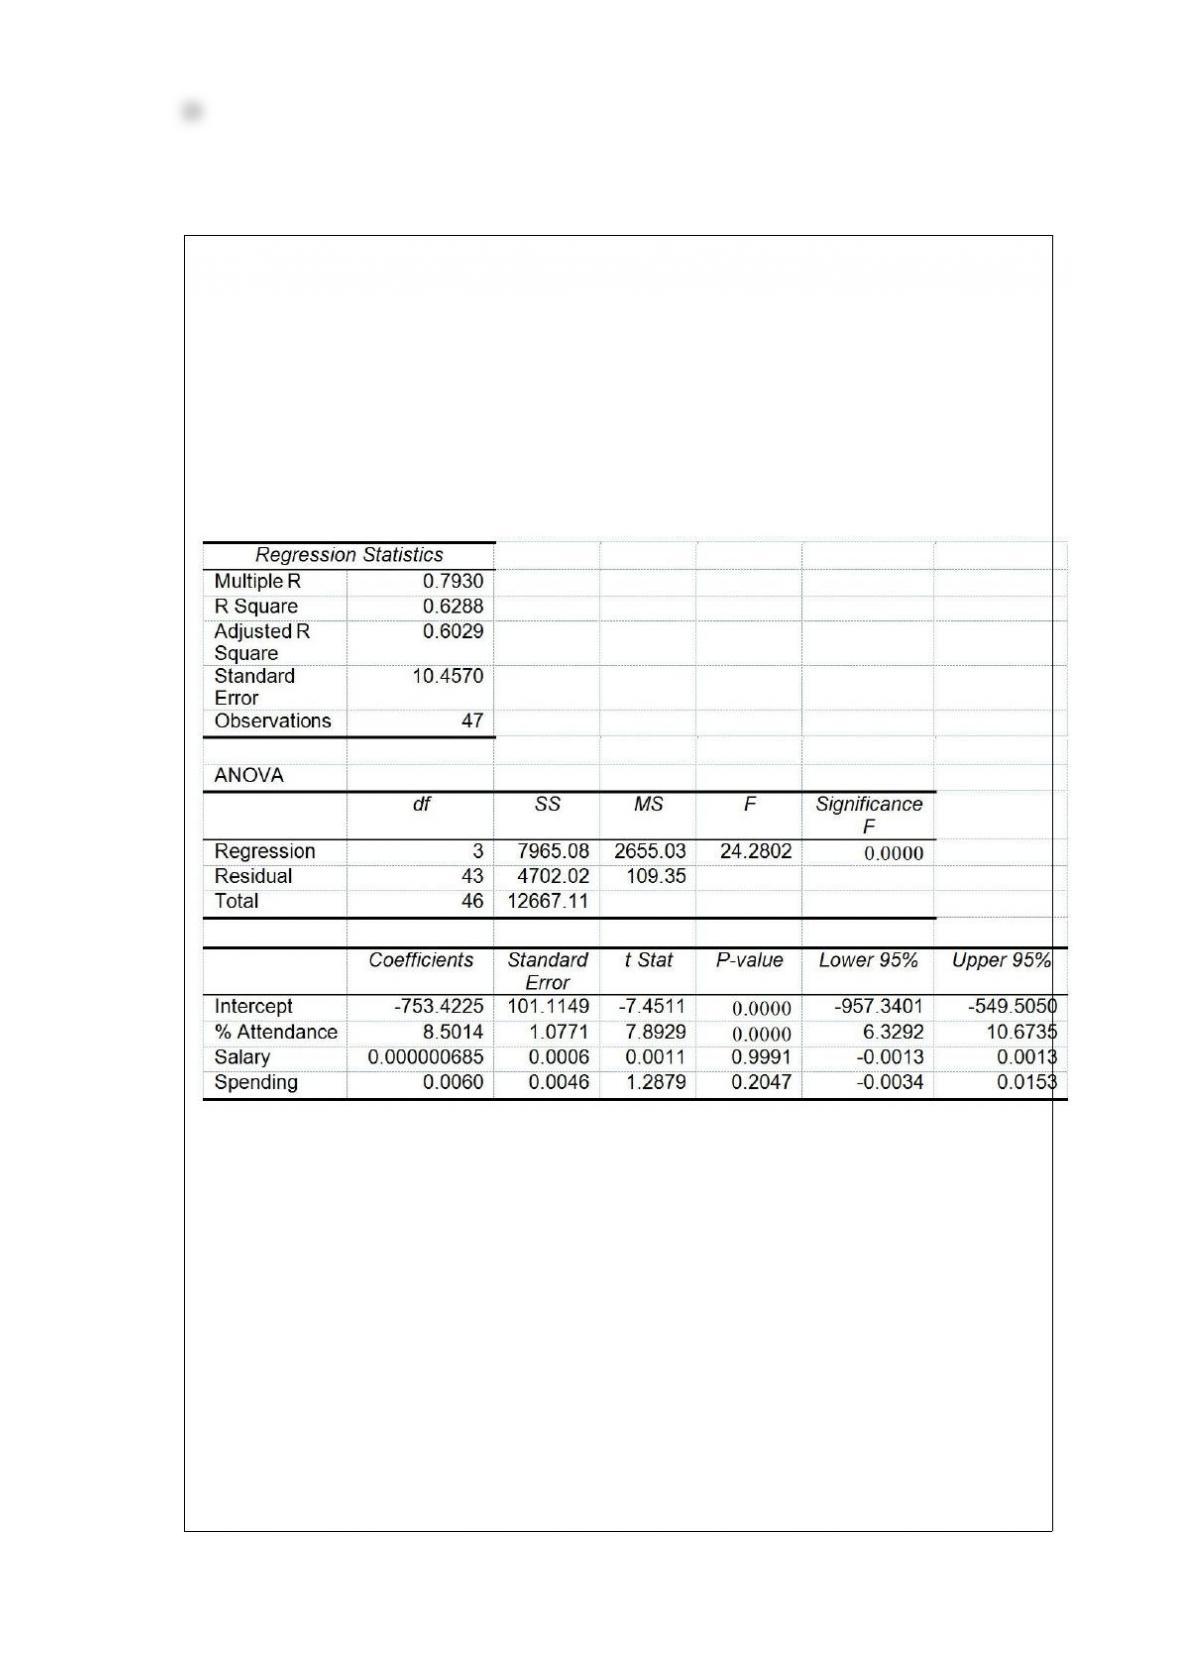
TABLE 17-8
The superintendent of a school district wanted to predict the percentage of students
passing a sixth-grade proficiency test. She obtained the data on percentage of students
passing the proficiency test (% Passing), daily mean of the percentage of students
attending class (% Attendance), mean teacher salary in dollars (Salaries), and
instructional spending per pupil in dollars (Spending) of 47 schools in the state.
Following is the multiple regression output with Y = % Passing as the dependent
variable, X1 = % Attendance, X2 = Salaries and X3 = Spending:
Referring to Table 17-8, which of the following is a correct statement?
A) 60.29% of the total variation in the percentage of students passing the proficiency
test can be explained by daily mean of the percentage of students attending class, mean
teacher salary, and instructional spending per pupil.
B) 60.29% of the total variation in the percentage of students passing the proficiency
test can be explained by daily mean of the percentage of students attending class, mean
teacher salary, and instructional spending per pupil after adjusting for the number of
predictors and sample size.
C) 60.29% of the total variation in the percentage of students passing the proficiency
test can be explained by daily mean of the percentage of students attending class
holding constant the effect of mean teacher salary, and instructional spending per pupil.
D) 60.29% of the total variation in the percentage of students passing the proficiency
test can be explained by daily mean of the percentage of students attending class after
adjusting for the effect of mean teacher salary, and instructional spending per pupil.

Suppose we wish to test H0 : 47 versus H1 : > 47. What will result if we
conclude that the mean is greater than 47 when its true value is really 52?
A) We have made a Type I error.
B) We have made a Type II error.
C) We have made a correct decision.
D) None of the above are correct.
The closing price of a company’s stock tomorrow can be lower, higher or the same as
today’s closing price. Without any prior information that may affect the price of the
stock tomorrow, the probability that it will close higher than today’s close is . This is
an example of using which of the following probability approaches?
A) a priori probability
B) empirical probability
C) subjective probability
D) conditional probability

A stock analyst was provided with a list of 25 stocks. He was expected to pick 3 stocks
from the list whose prices are expected to rise by more than 20% after 30 days. In
reality, the prices of only 5 stocks would rise by more than 20% after 30 days. If he
randomly selected 3 stocks from the list, he would use what type of probability
distribution to compute the probability that all of the chosen stocks would appreciate
more than 20% after 30 days?
A) Binomial distribution
B) Poisson distribution
C) Hypergeometric distribution
D) None of the above
TABLE 1-2
A Wall Street Journal poll asked 2,150 adults in the United States a series of questions
to find out their view on the U.S. economy.
Referring to Table 1-2, the possible responses to the question “What do you think is the
current unemployment rate?” result in
A) a nominal scale variable.
B) an ordinal scale variable.
C) an interval scale variable.
D) a ratio scale variable.
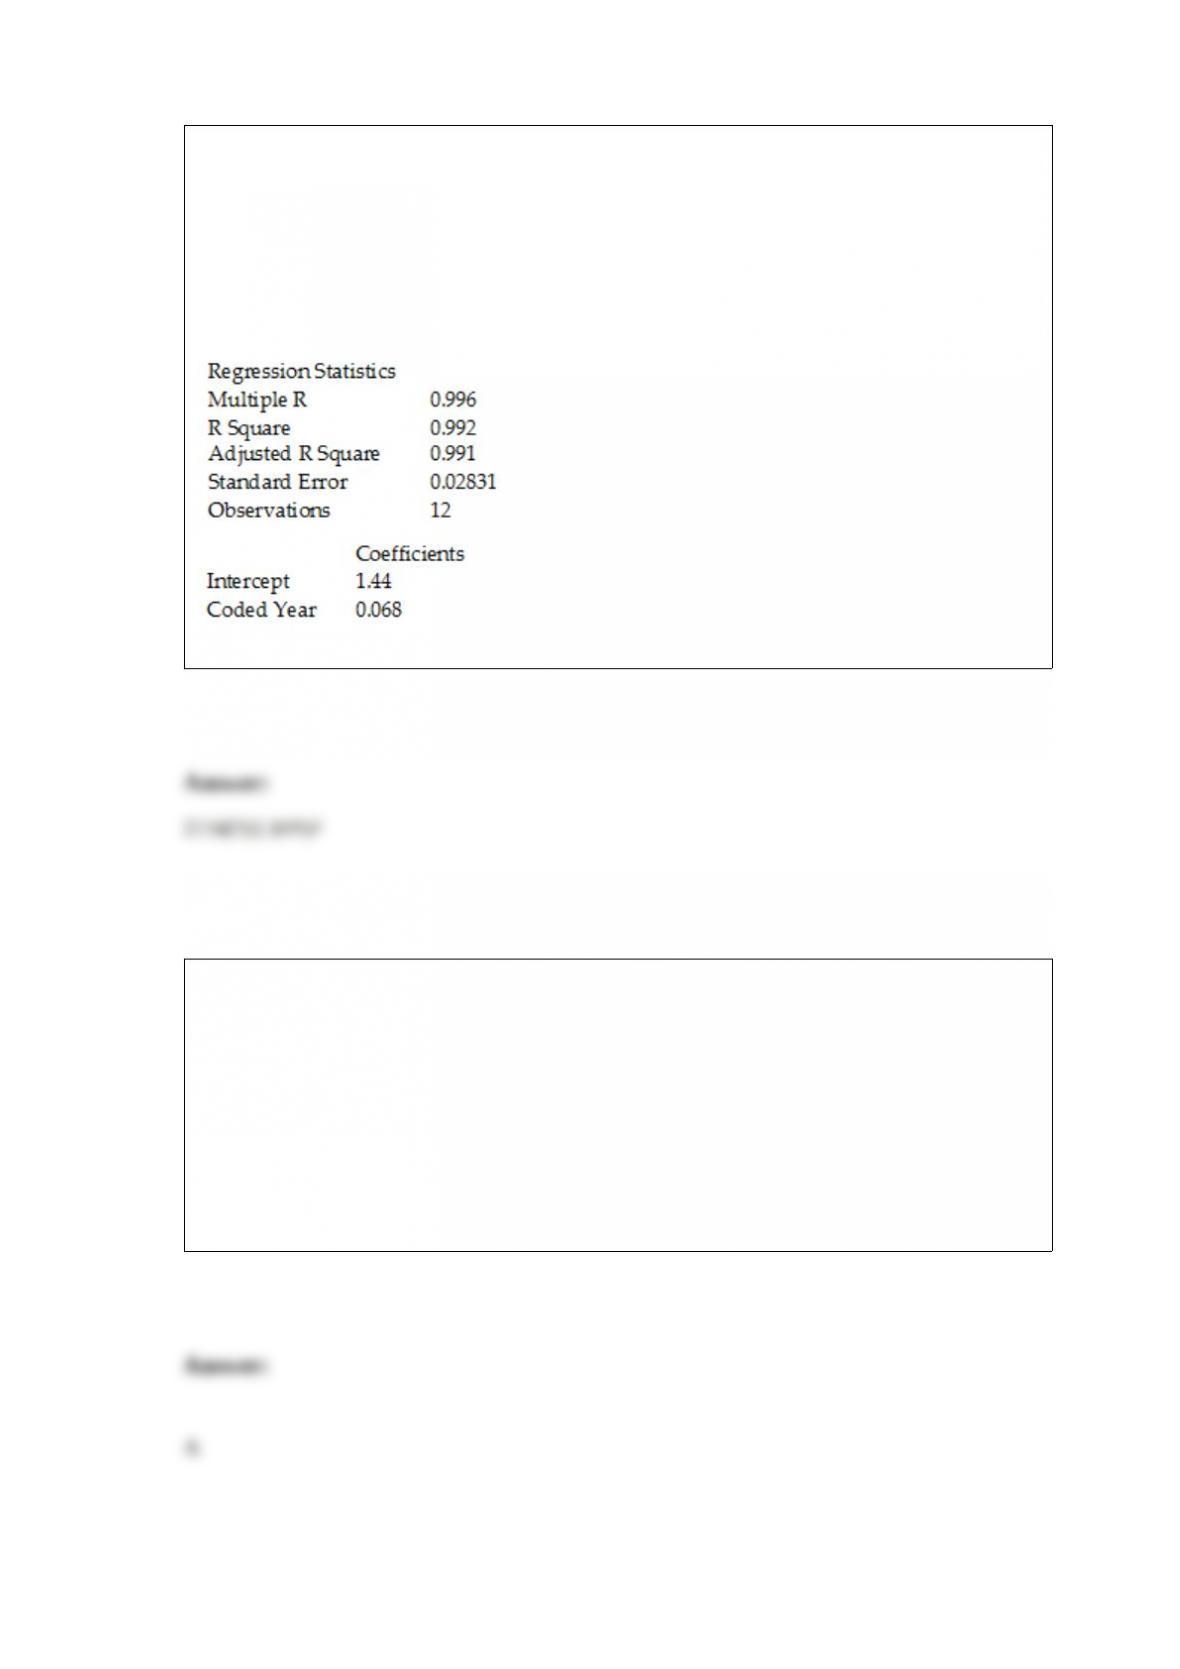
TABLE 16-7
The executive vice-president of a drug manufacturing firm believes that the demand for
the firm’s most popular drug has been evidencing an exponential trend since 1999. She
uses Microsoft Excel to obtain the partial output below. The dependent variable is the
log base 10 of the demand for the drug, while the independent variable is years, where
1999 is coded as 0, 2000 is coded as 1, etc.
SUMMARY OUTPUT
Referring to Table 16-7, the fitted exponential trend equation to predict Y is ________.
Which of the following would be an appropriate null hypothesis?
A) The mean of a population is equal to 55.
B) The mean of a sample is equal to 55.
C) The mean of a population is greater than 55.
D) Only A and C are appropriate.
The effect of an unpredictable, rare event will be contained in the ________
component.
A) trend
B) cyclical
C) irregular
D) seasonal
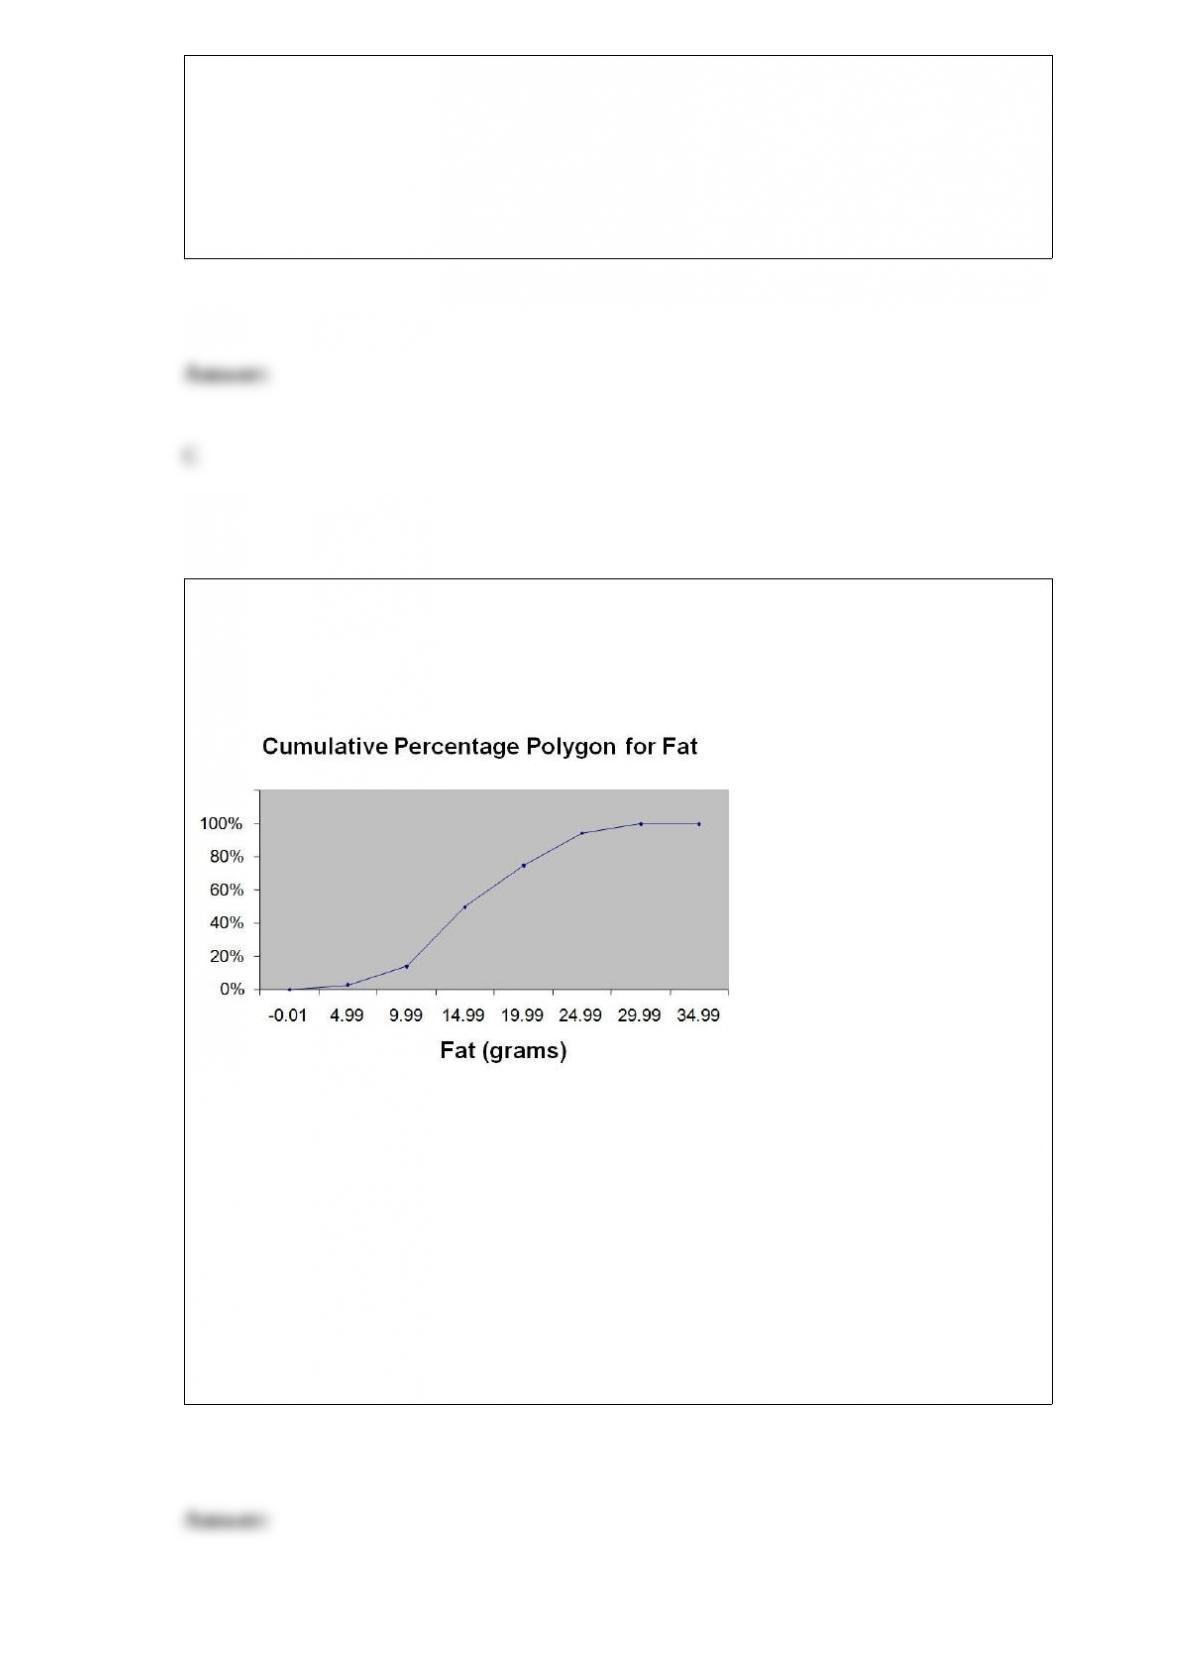
TABLE 2-15
The figure below is the ogive for the amount of fat (in grams) for a sample of 36 pizza
products where the upper boundaries of the intervals are: 5, 10, 15, 20, 25, and 30.
Referring to Table 2-15, roughly what percentage of pizza products contains less than
10 grams of fat?
A) 3%
B) 14%
C) 50%
D) 75%
A company that manufactures designer jeans is contemplating whether to increase its
advertising budget by $1 million for next year. If the expanded advertising campaign is
successful, the company expects sales to increase by $1.6 million next year. If the
advertising campaign fails, the company expects sales to increase by only $400,000
next year. If the advertising budget is not increased, the company expects sales to
increase by $200,000. Identify the events in this decision-making problem.
A) Two choices: <1> increase the budget and <2> do not increase the budget.
B) Two possibilities: <1> campaign is successful and <2> campaign is not successful.
C) Four consequences resulting from the Increase/Do Not Increase and Successful/Not
Successful combinations.
D) The increase in sales dollars next year.
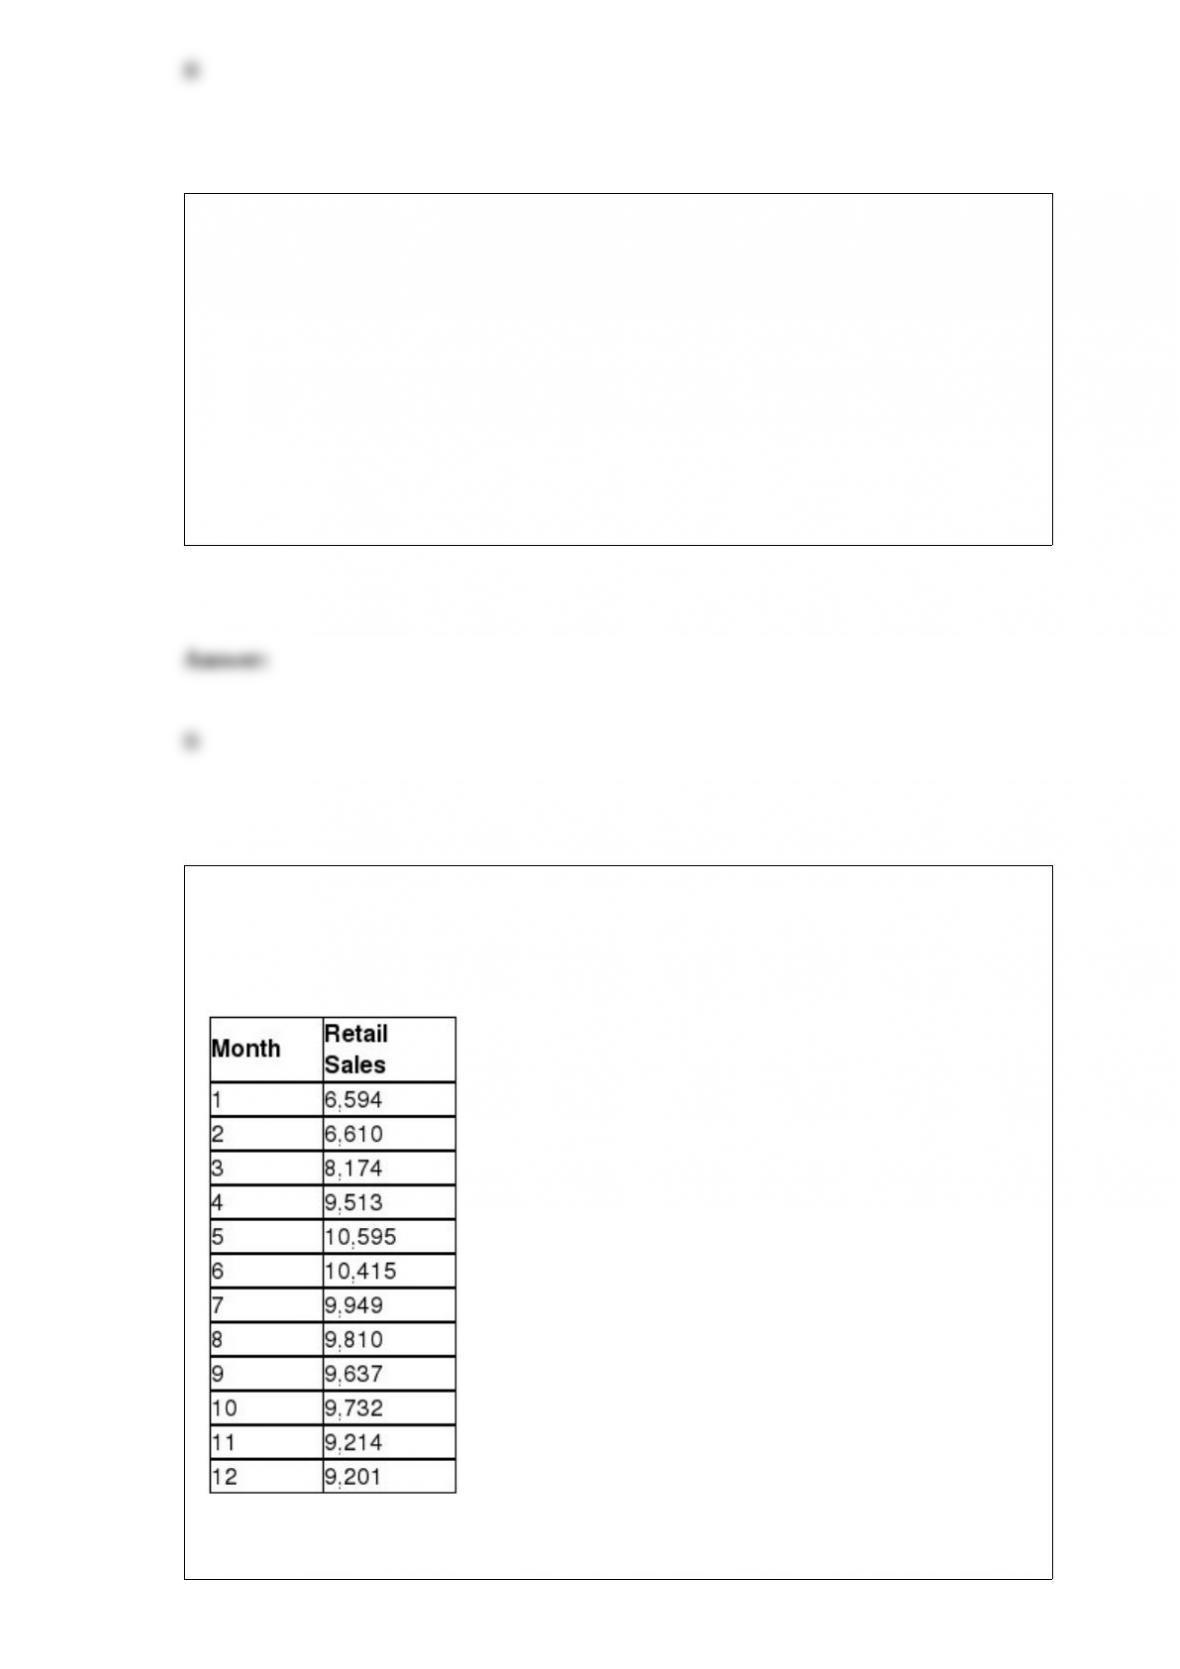
TABLE 16-13
Given below is the monthly time-series data for U.S. retail sales of building materials
over a specific year.
The results of the linear trend, quadratic trend, exponential trend, first-order
autoregressive, second-order autoregressive and third-order autoregressive model are
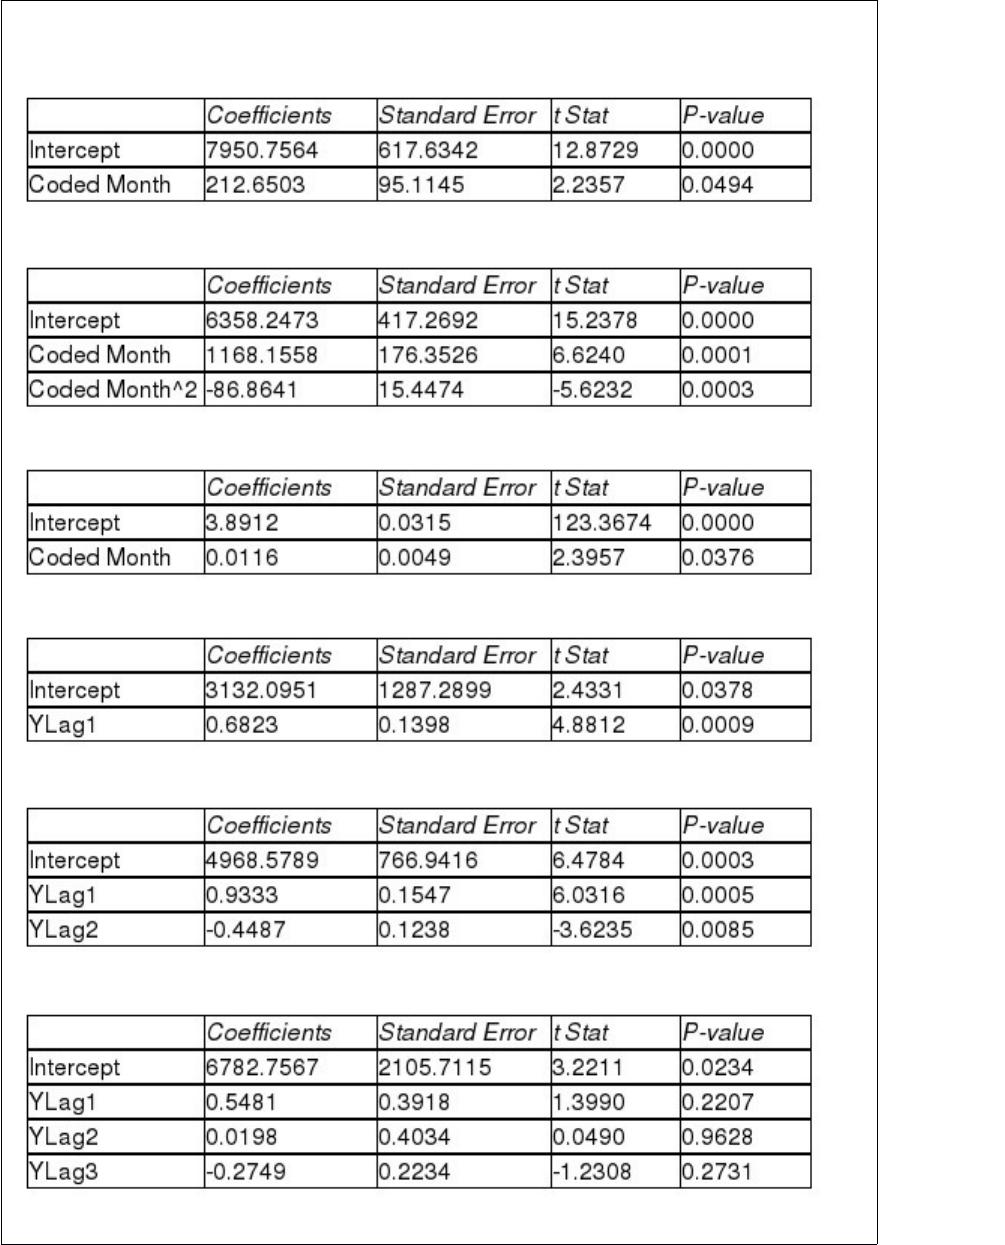
presented below in which the coded month for the 1st month is 0:
Linear trend model:
Quadratic trend model:
Exponential trend model:
First-order autoregressive:
Second-order autoregressive:
Third-order autoregressive:
Below is the residual plot of the various models:
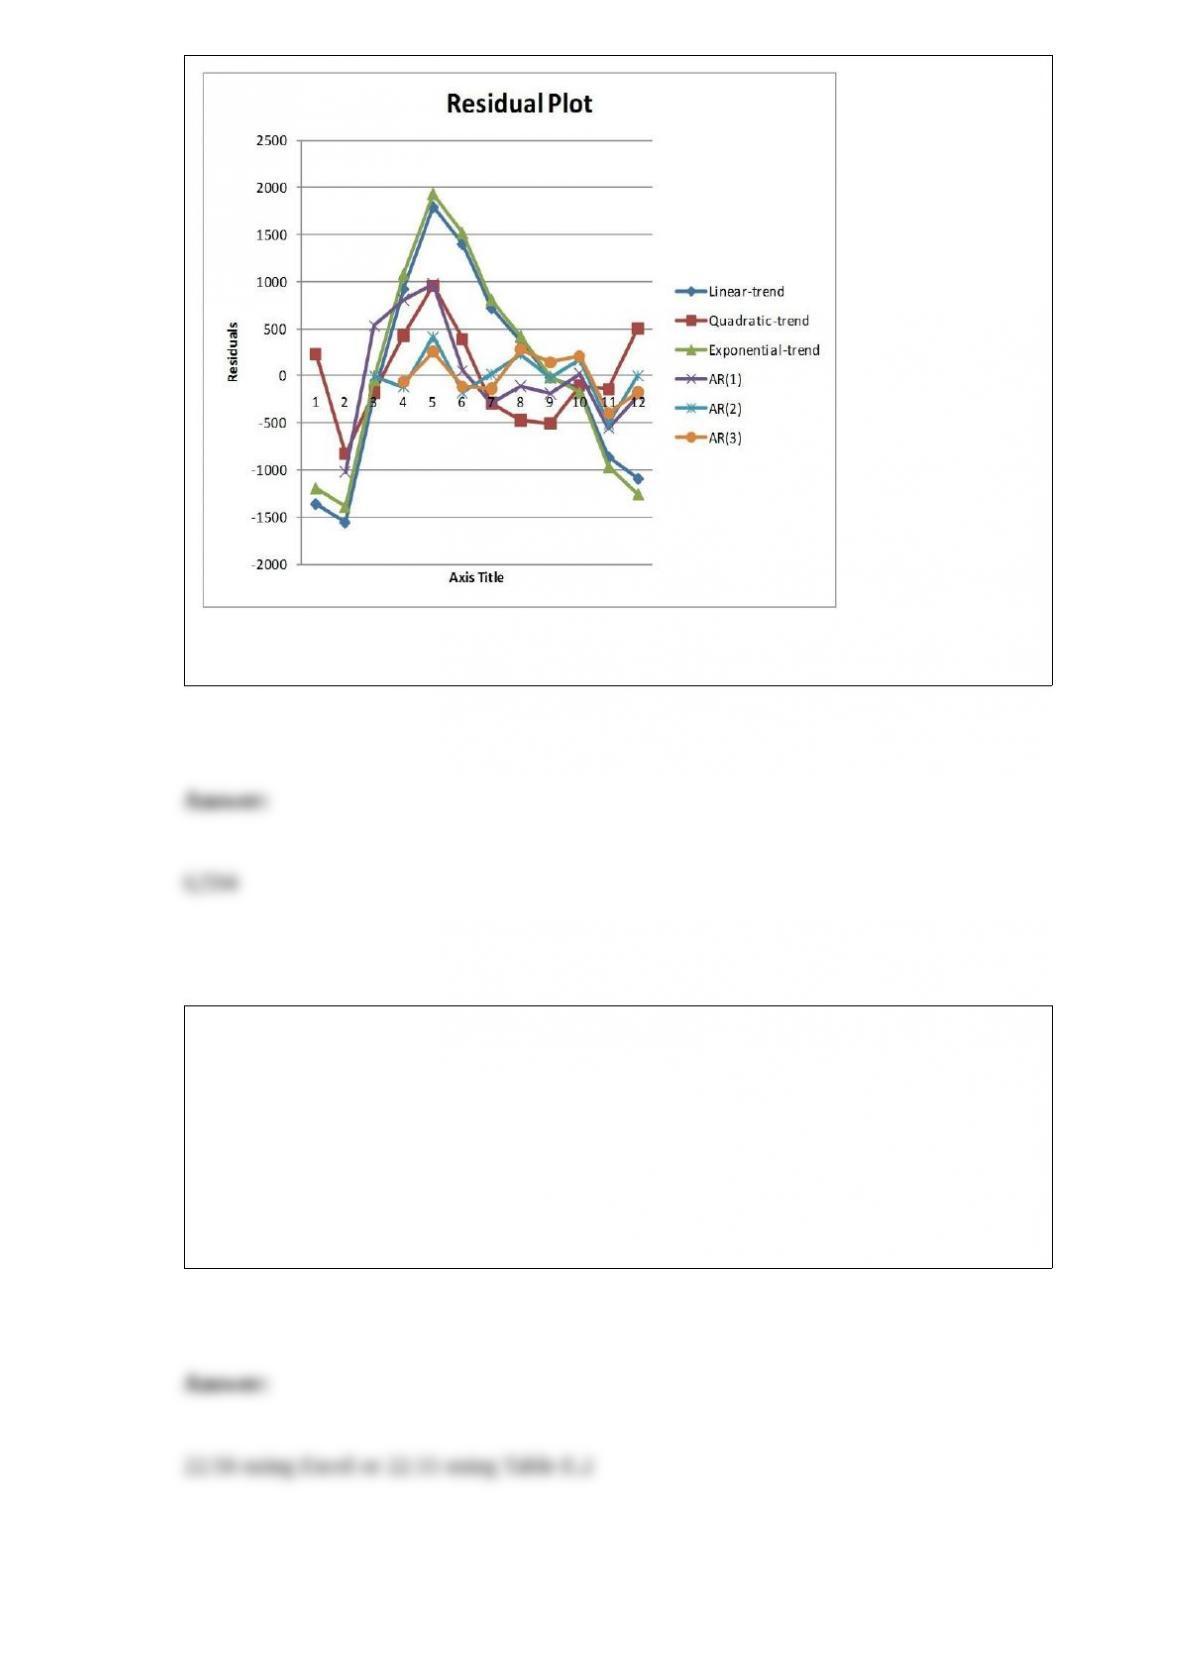
Referring to Table 16-13, what is the exponentially smoothed value for the first month
using a smoothing coefficient of W = 0.5?
TABLE 7-5
According to an article, 19% of the entire population in a developing country has
high-speed access to the Internet. Random sample sizes of 200 are selected from the
country’s population.
Referring to Table 7-5, among all the random sample sizes of 200, 90% will have less
than ________% who have high-speed access to the Internet.

TABLE 5-9
A major hotel chain keeps a record of the number of mishandled bags per 1,000
customers. In a recent year, the hotel chain had 4.06 mishandled bags per 1,000
customers. Assume that the number of mishandled bags has a Poisson distribution.
Referring to Table 5-9, what is the probability that in the next 1,000 customers, the
hotel chain will have no more than three mishandled bags?
TABLE 5-9
A major hotel chain keeps a record of the number of mishandled bags per 1,000
customers. In a recent year, the hotel chain had 4.06 mishandled bags per 1,000
customers. Assume that the number of mishandled bags has a Poisson distribution.
Referring to Table 5-9, what is the probability that in the next 1,000 customers, the
hotel chain will have more than five but less than eight mishandled bags?
TABLE 12-15
Two new different models of compact SUVs have just arrived at the market. You are
interested in comparing the gas mileage performance of both models to see if they are
the same. A partial computer output for twelve compact SUVs of model 1 and thirteen
of model 2 is given below:
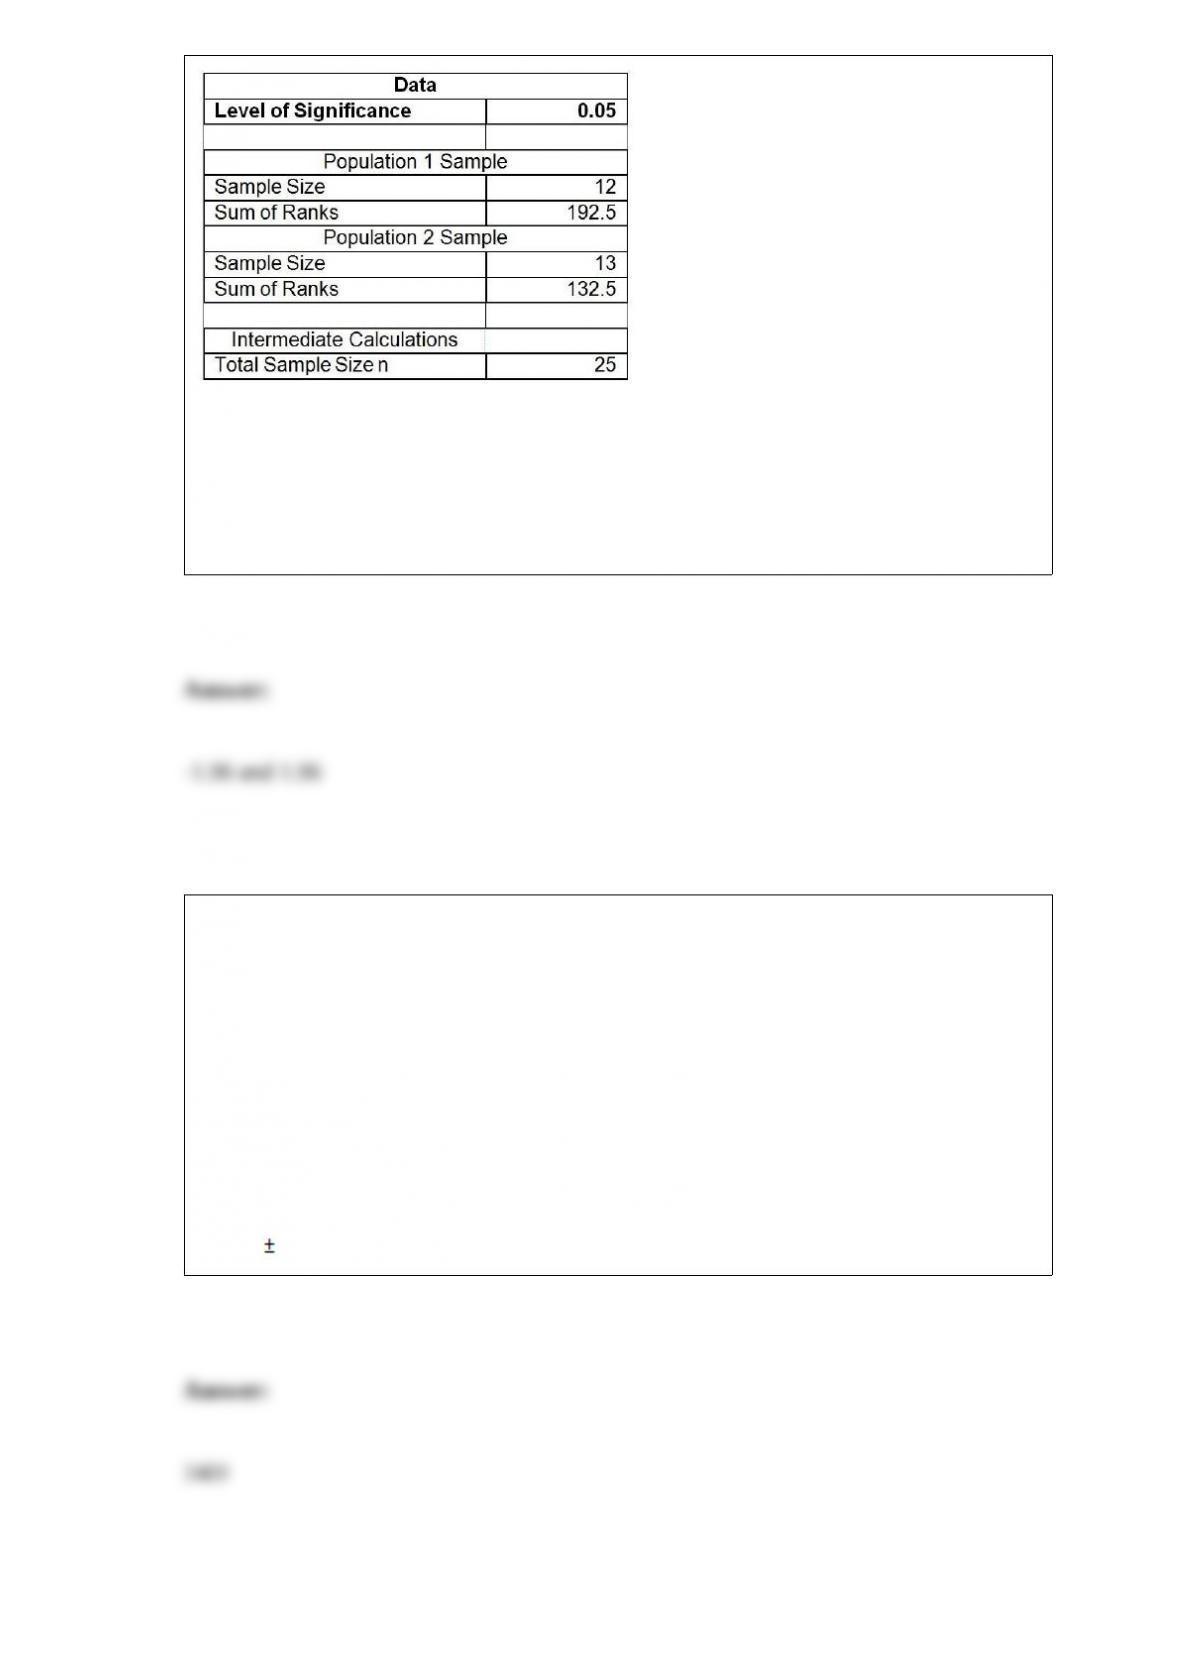
You are told that the gas mileage population distributions for both models are not
normally distributed.
Referring to Table 12-15, what is(are) the critical value(s) using a 5% level of
significance?
TABLE 8-10
A sales and marketing management magazine conducted a survey on salespeople
cheating on their expense reports and other unethical conduct. In the survey on 200
managers, 58% of the managers have caught salespeople cheating on an expense report,
50% have caught salespeople working a second job on company time, 22% have caught
salespeople listing a ‘strip bar” as a restaurant on an expense report, and 19% have
caught salespeople giving a kickback to a customer.
Referring to Table 8-10, determine the sample size needed to estimate the proportion of
managers who have caught salespeople working a second job on company time to
within 0.02 with 95% confidence.

The owner of a fish market determined that the average weight for a catfish is 3.2
pounds with a standard deviation of 0.8 pound. Assuming the weights of catfish are
normally distributed, the probability that a randomly selected catfish will weigh more
than 4.4 pounds is ________.
TABLE 8-16
The president of a university is concerned that the percentage of students who have
cheated on an exam is higher than the 1% acceptable level. A confidential random
sample of 1,000 students from a population of 7,000 revealed that 6 of them said that
they had cheated on an exam during the last semester.
Referring to Table 8-16, what is the critical value for the 90% one-sided confidence
interval for the proportion of students who had cheated on an exam during the last 12
months?