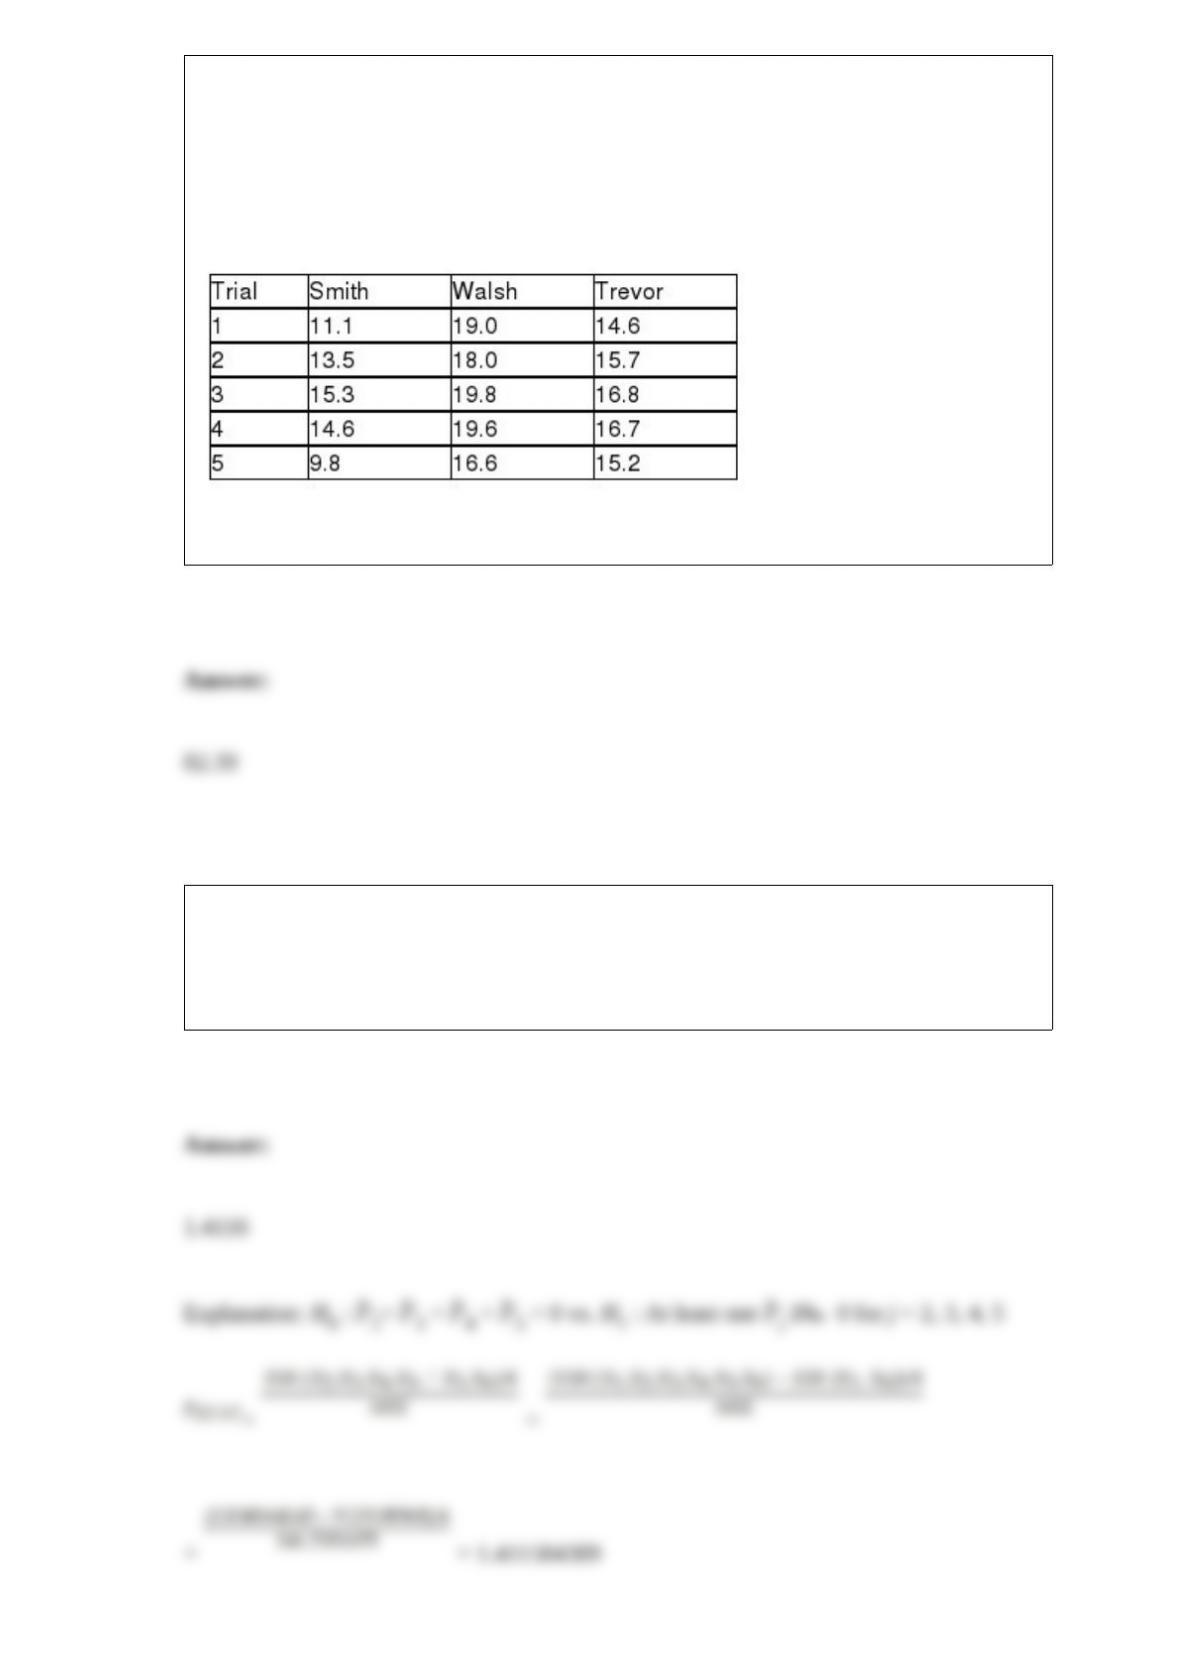
TABLE 11-4
An agronomist wants to compare the crop yield of 3 varieties of chickpea seeds. She
plants 15 fields, 5 with each variety. She then measures the crop yield in bushels per
acre. Treating this as a completely randomized design, the results are presented in the
table that follows.
Referring to Table 11-4, the among-group variation or SSA is ________.
Referring to Table 17-10 and using both Model 1 and Model 2, what is the value of the
test statistic for testing whether the independent variables that are not significant
individually are also not significant as a group in explaining the variation in the
dependent variable at a 5% level of significance?
To use the normal distribution to approximate the binomial distribution, we need
________ and ________ to be at least 5.
The true length of boards cut at a mill with a listed length of 10 feet is normally
distributed with a mean of 123 inches and a standard deviation of 1 inch. What
proportion of the boards will be over 125 inches in length?
TABLE 3-1
Health care issues are receiving much attention in both academic and political arenas. A
sociologist recently conducted a survey of citizens over 60 years of age whose net
worth is too high to qualify for Medicaid. The ages of 25 senior citizens were as
follows:
Referring to Table 3-1, calculate the kurtosis statistic for the age of the senior citizens
accurate to two decimal places.

Referring to Table 14-8, the partial F test for
H0 : Variable X1 does not significantly improve the model after
variable X2 has been included
H1 : Variable X1 significantly improves the model after variable X2 has
been included
has ________ and ________ degrees of freedom.TABLE 14-8
A financial analyst wanted to examine the relationship between salary
(in $1,000) and 2 variables: age
(X1 = Age) and experience in the field (X2 = Exper). He took a sample
of 20 employees and obtained the following Microsoft Excel output:
Also, the sum of squares due to the regression for the model that
includes only Age is 5022.0654 while the sum of squares due to the
regression for the model that includes only Exper is 125.9848.
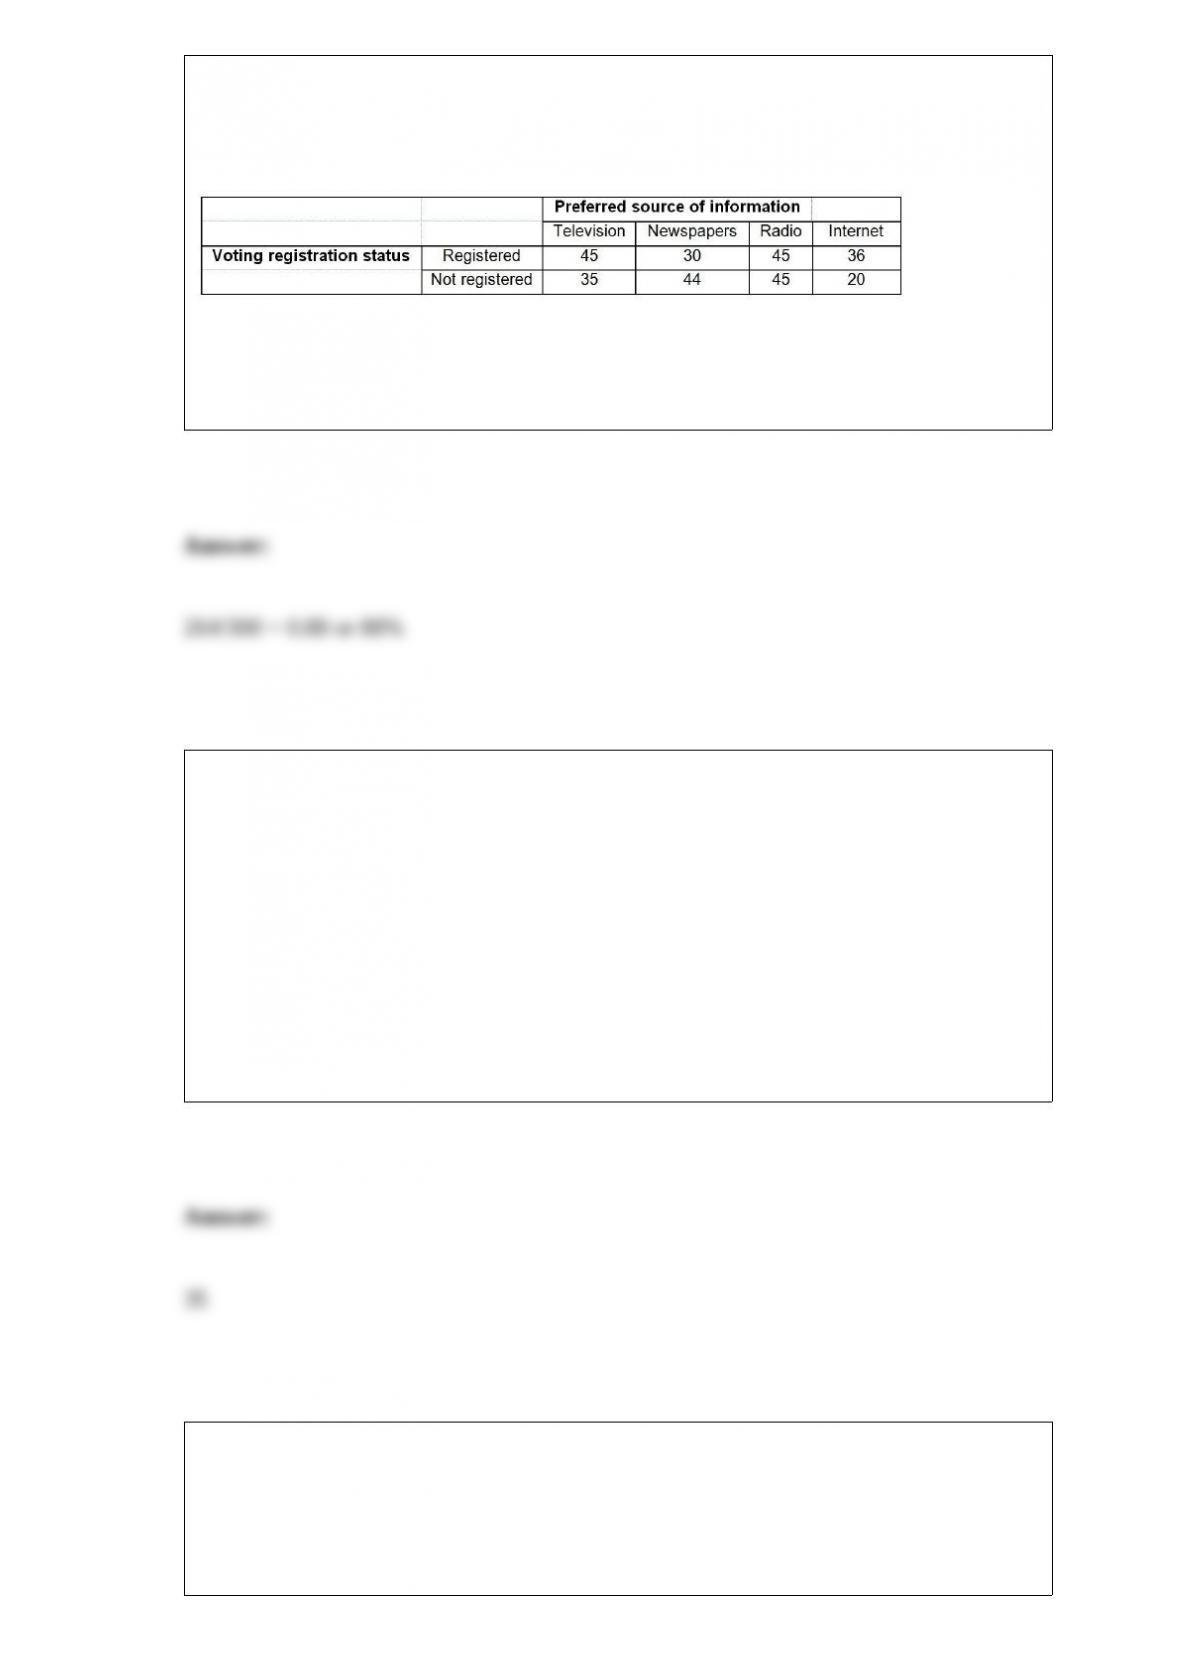
TABLE 4-11
A sample of 300 adults is selected. The contingency table below shows their registration
status and their preferred source of information on current events.
Referring to Table 4-11, if an adult is selected at random, what is the probability that
he/she is a not a registered voter or does not prefer to get his/her current information
from the internet?
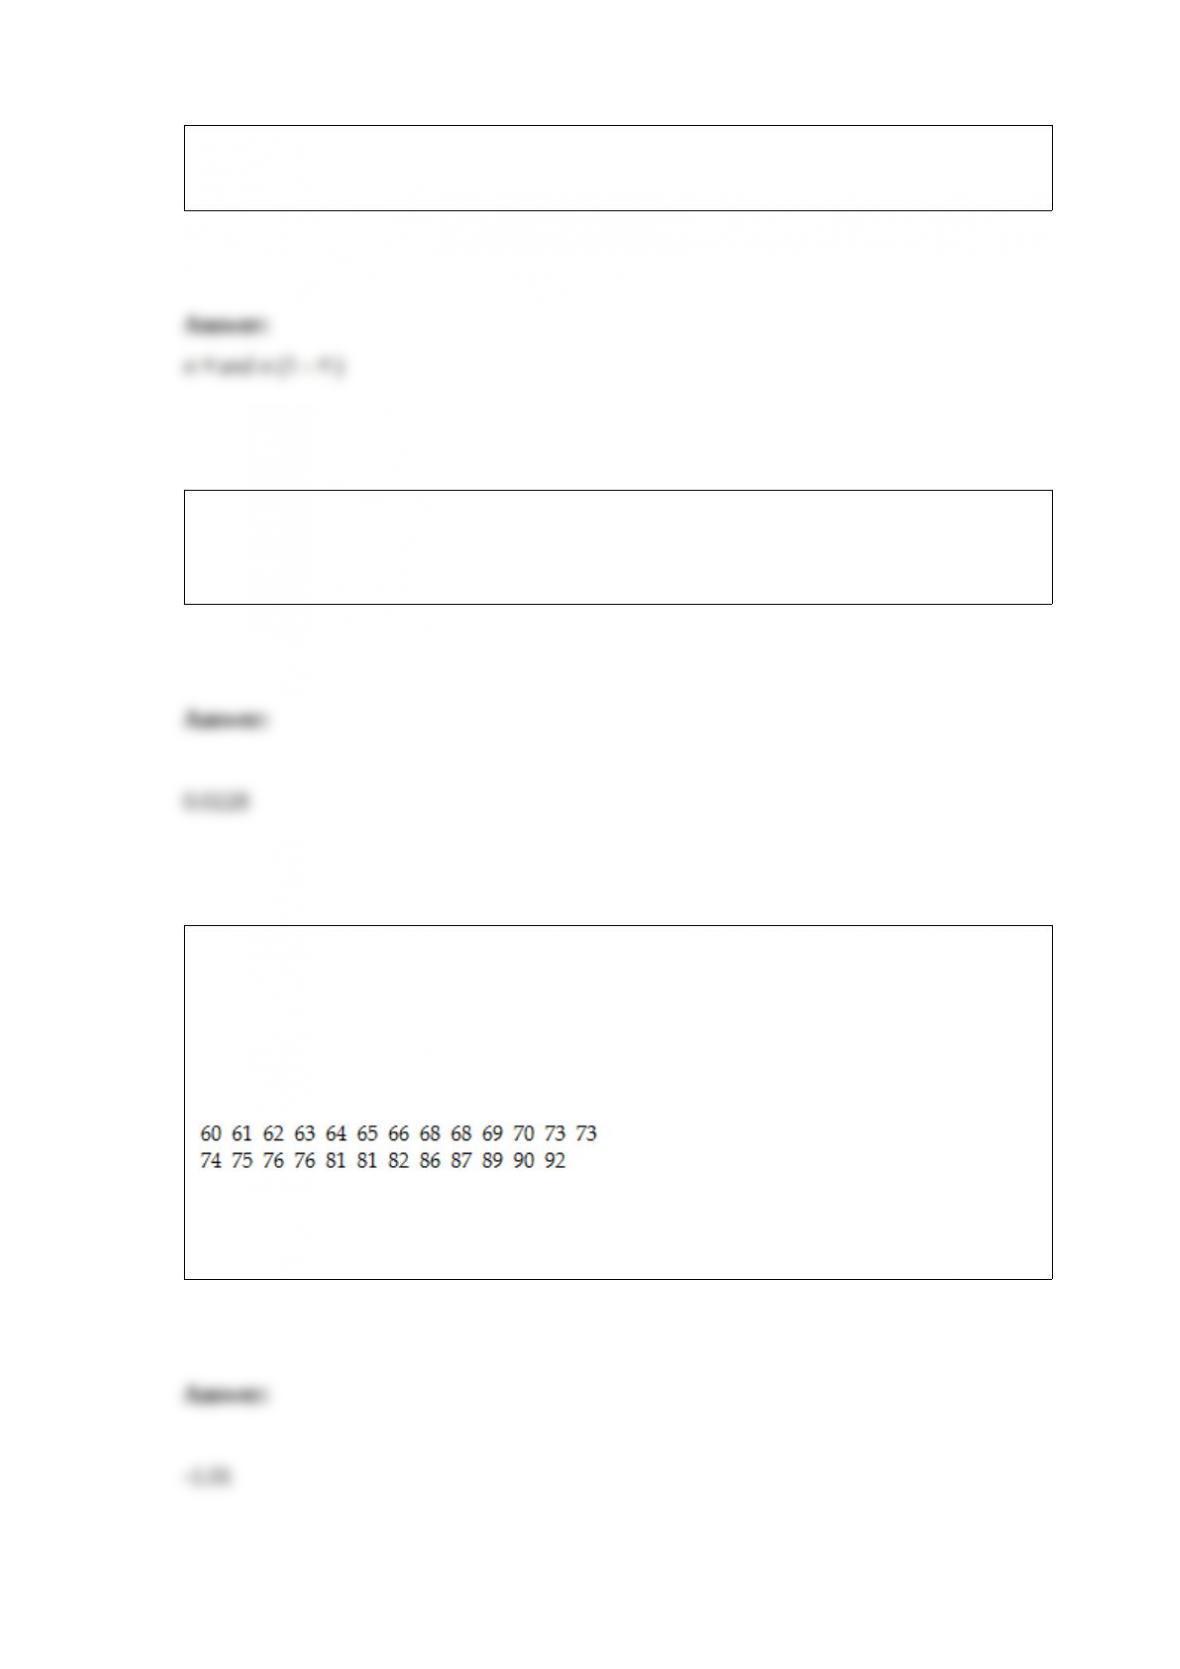
TABLE 3-3
The ordered array below represents the number of vitamin supplements sold by a health
food store in a sample of 16 days.
19, 19, 20, 20, 22, 23, 25, 26, 27, 30, 33, 34, 35, 36, 38, 41
Note: For this sample, the sum of the values is 448, and the sum of the squared
differences between each value and the mean is 812.
Referring to Table 3-3, the third quartile of the number of vitamin supplements sold in
this sample is ________.
TABLE 4-3
A survey is taken among customers of a fast-food restaurant to determine preference for
hamburger or chicken. Of 200 respondents selected, 75 were children and 125 were
adults. 120 preferred hamburger and 80 preferred chicken. 55 of the children preferred
hamburger.
Referring to Table 4-3, the probability that a randomly selected individual is an adult is
________.
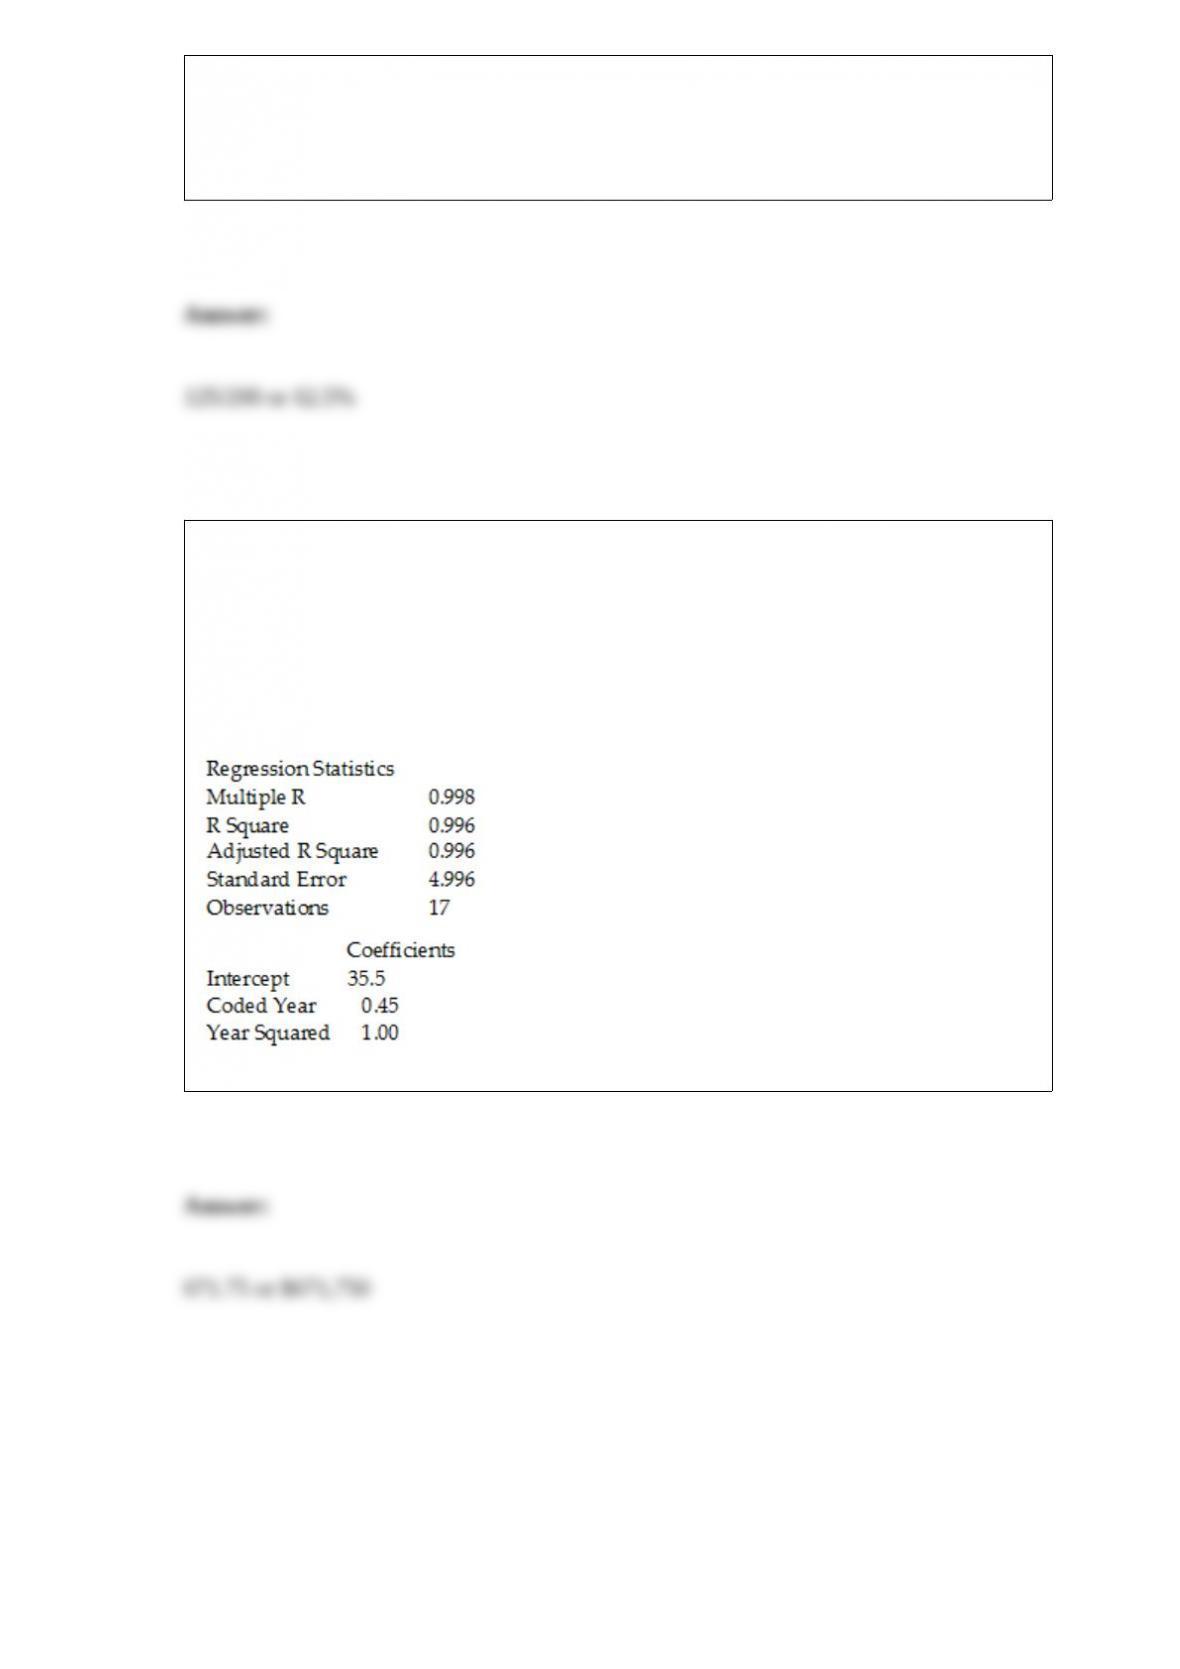
TABLE 16-8
The manager of a marketing consulting firm has been examining his company’s yearly
profits. He believes that these profits have been showing a quadratic trend since 1994.
He uses Microsoft Excel to obtain the partial output below. The dependent variable is
profit (in thousands of dollars), while the independent variables are coded years and
squared of coded years, where 1994 is coded as 0, 1995 is coded as 1, etc.
SUMMARY OUTPUT
Referring to Table 16-8, the forecast for profits in 2019 is ________.