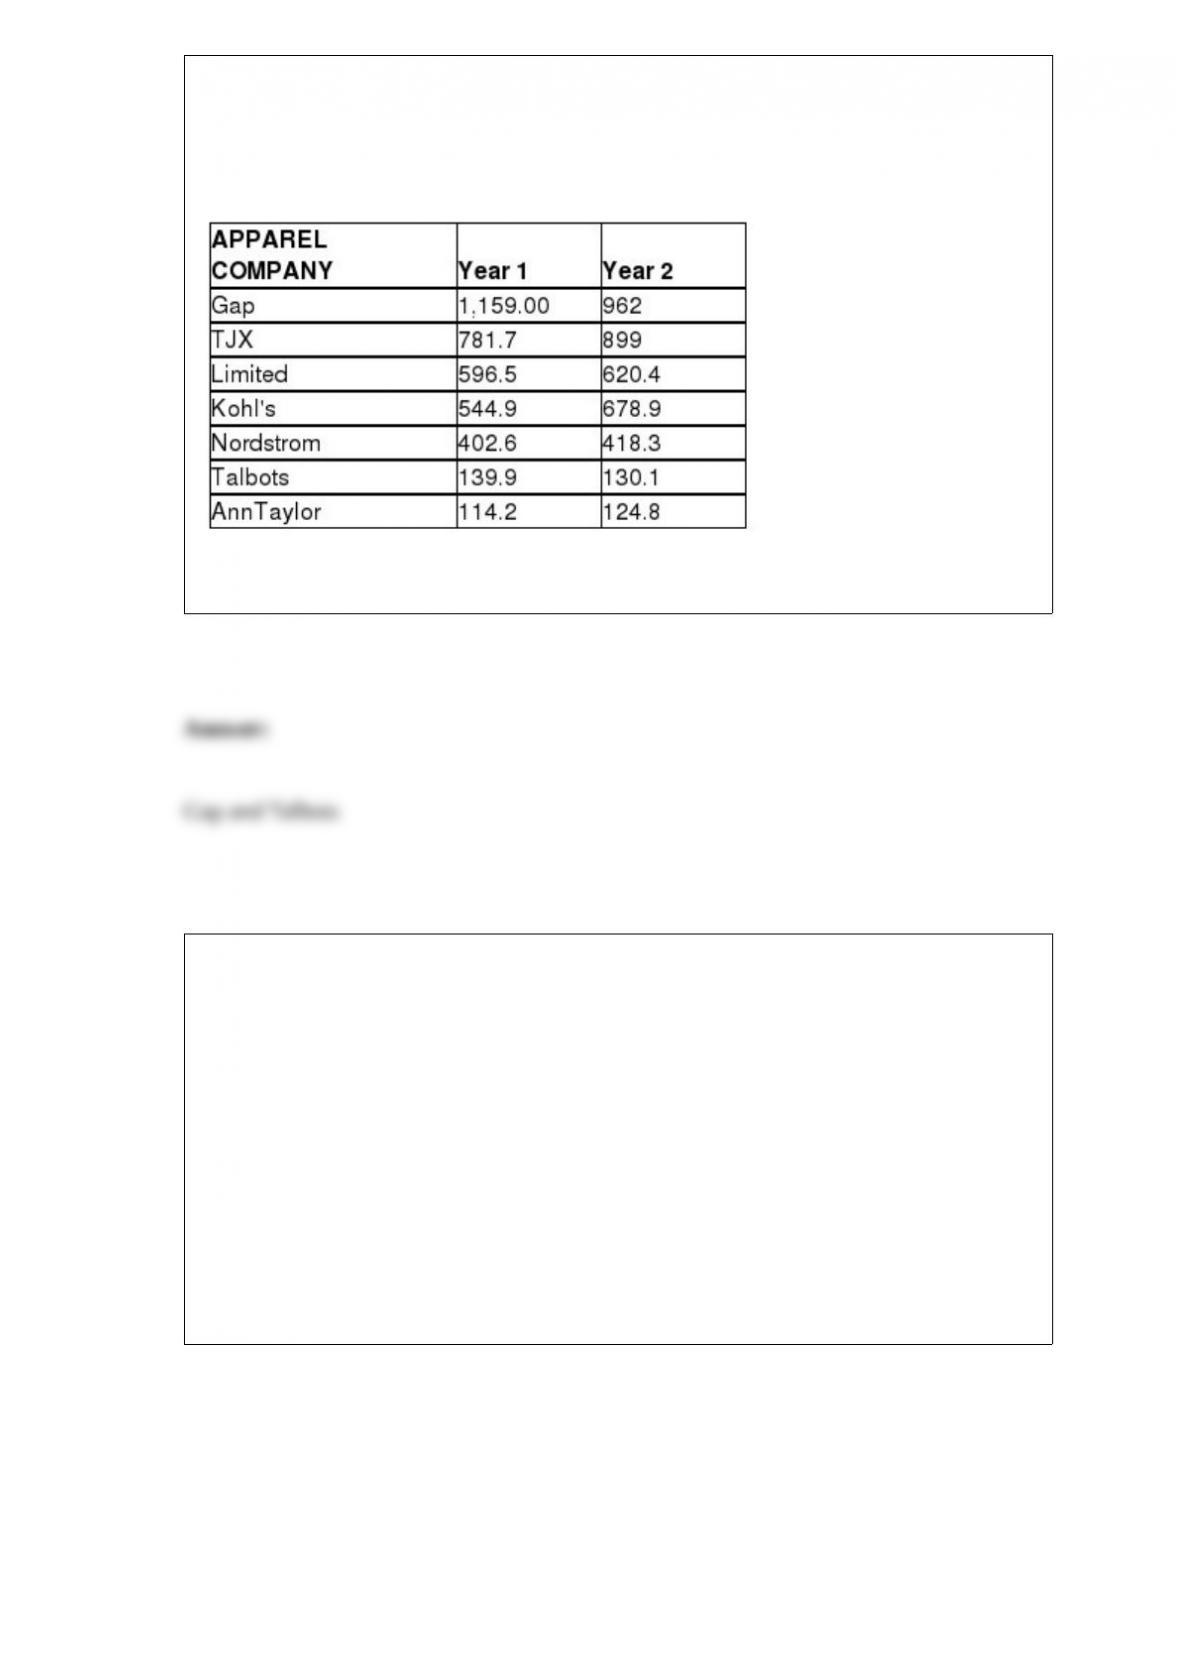
TABLE 2-17
The following table presents total retail sales in millions of dollars for the leading
apparel companies over a two-year period.
Referring to Table 2-17, among the 8 stores, ________ saw a sales decline.
TABLE 17-12
The marketing manager for a nationally franchised lawn service company would like to
study the characteristics that differentiate home owners who do and do not have a lawn
service. A random sample of 30 home owners located in a suburban area near a large
city was selected; 15 did not have a lawn service (code 0) and 15 had a lawn service
(code 1). Additional information available concerning these 30 home owners includes
family income (Income, in thousands of dollars), lawn size (Lawn Size, in thousands of
square feet), attitude toward outdoor recreational activities (Attitude 0 = unfavorable, 1
= favorable), number of teenagers in the household (Teenager), and age of the head of
the household (Age).
The Minitab output is given below:
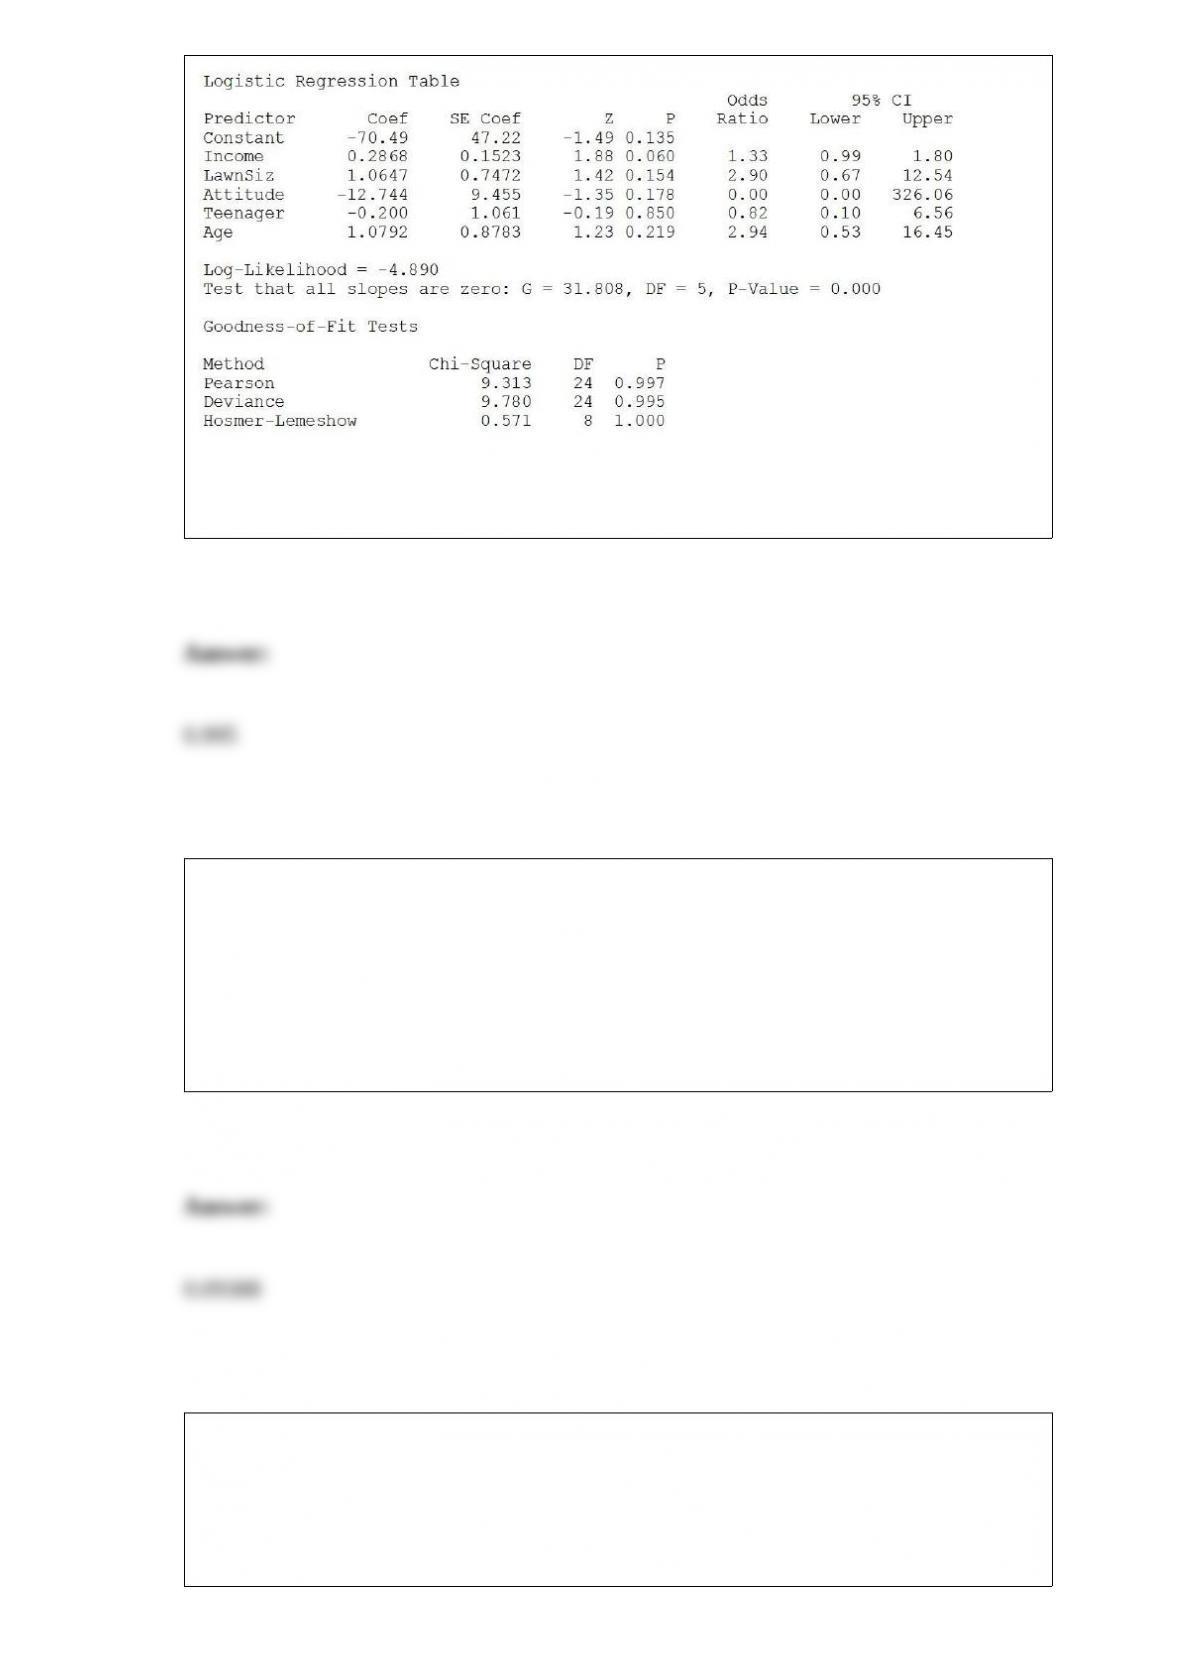
Referring to Table 17-12, what is the p-value of the test statistic when testing whether
the model is a good-fitting model?
TABLE 5-5
From an inventory of 48 new cars being shipped to local dealerships, corporate reports
indicate that 12 have defective radios installed.
Referring to Table 5-5, what is the probability out of the 8 new cars it just received that,
when each is tested, at least half of the cars have defective radios?
TABLE 11-11
A student team in a business statistics course designed an experiment to investigate
whether the brand of bubblegum used affected the size of bubbles they could blow. To
reduce the person-to-person variability, the students decided to use a randomized block
design using themselves as blocks.
Four brands of bubblegum were tested. A student chewed two pieces of a brand of gum
and then blew a bubble, attempting to make it as big as possible. Another student
measured the diameter of the bubble at its biggest point. The following table gives the
diameters of the bubbles (in inches) for the 16 observations.
Referring to Table 11-11, the among-group variation or SSA is ________.
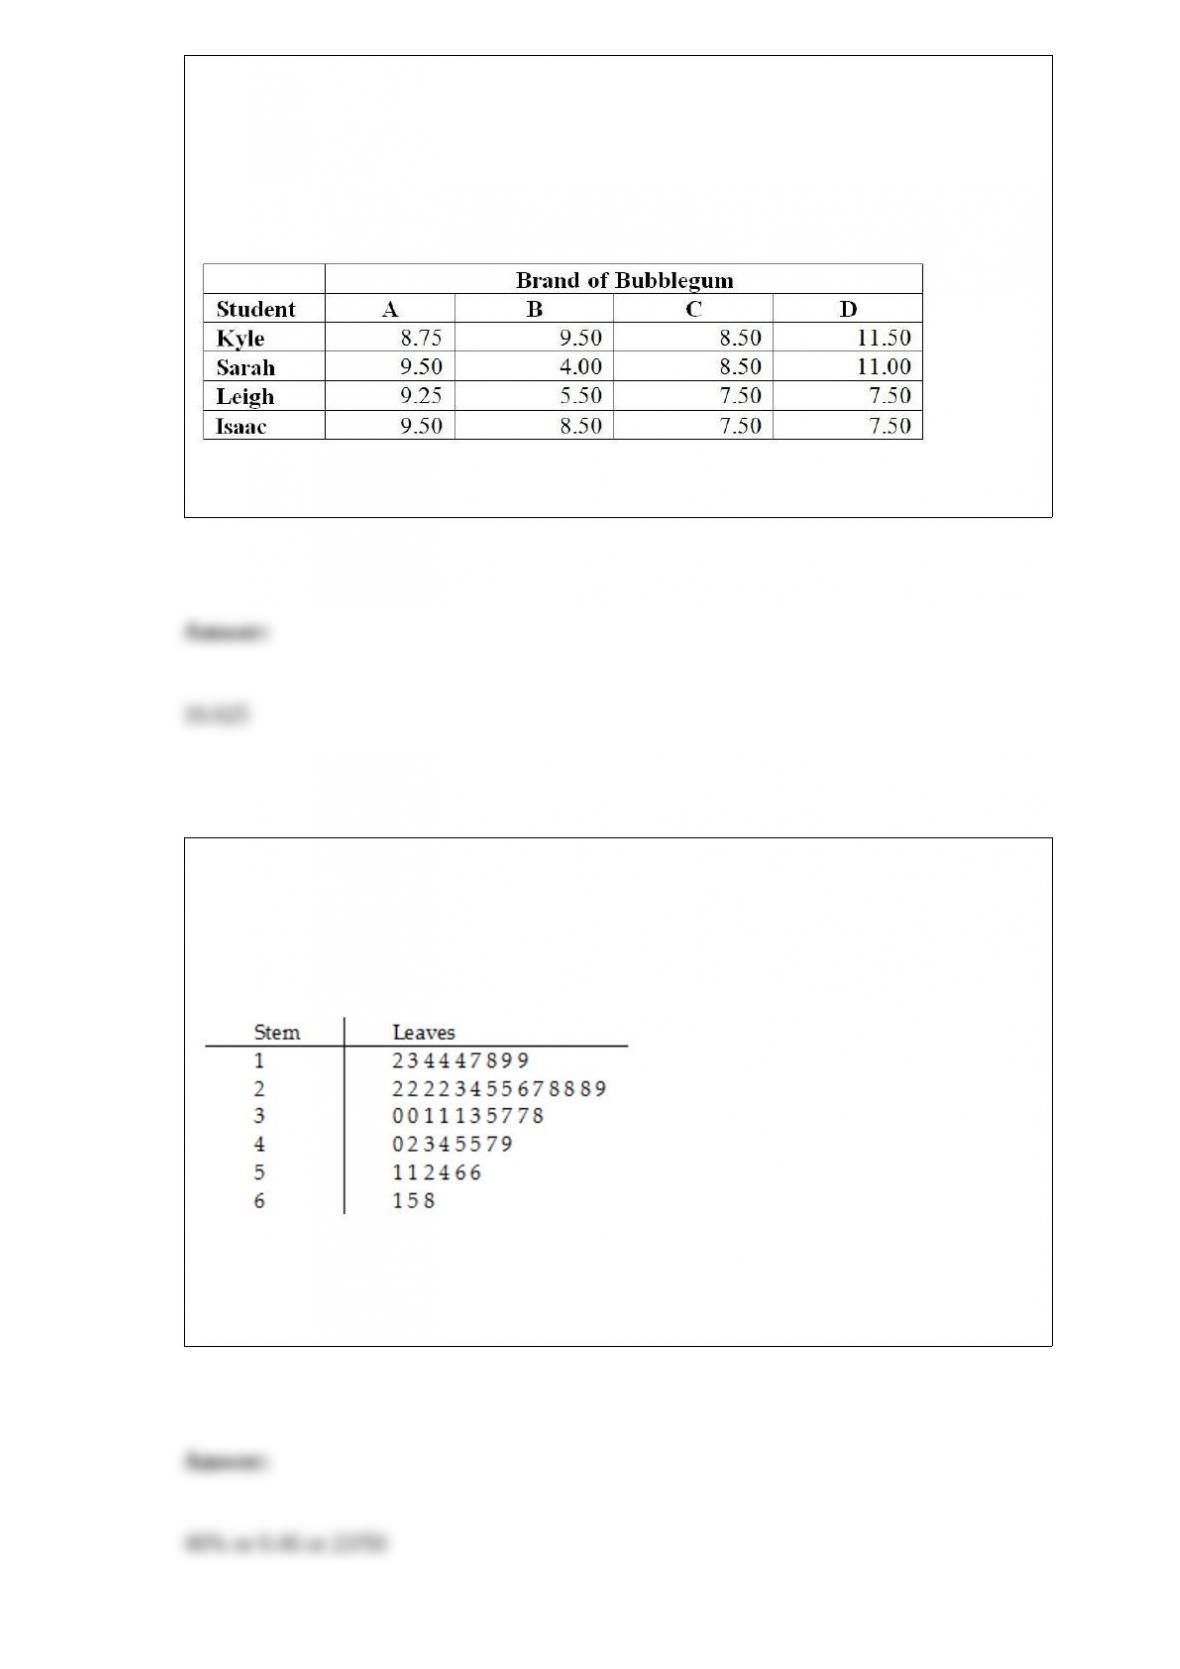
TABLE 2-7
The Stem-and-Leaf display below contains data on the number of months between the
date a civil suit is filed and when the case is actually adjudicated for 50 cases heard in
superior court.
Referring to Table 2-7, if a frequency distribution with equal sized classes was made
from this data, and the first class was “10 but less than 20,” the cumulative percentage
of the second class would be ________.