Archives
CAL 112 Midterm 2
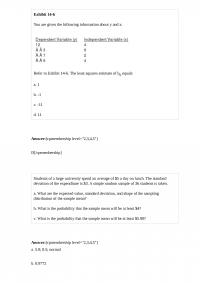
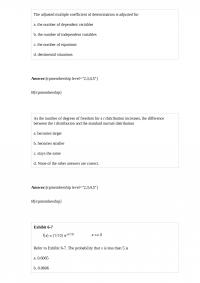
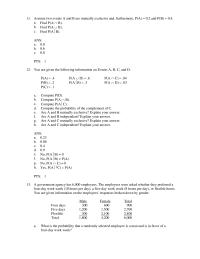
Exhibit 14-6 You are given the following information about y and x. Refer to Exhibit 14-6. The least squares estimate of b0 equals a. 1 b. -1 c. -11 d. 11 Students of a large university spend an average of […]
CAL 113 Final
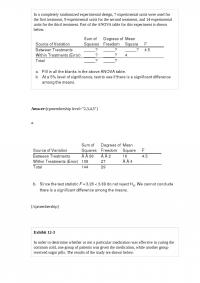
In a completely randomized experimental design, 7 experimental units were used for the first treatment, 9 experimental units for the second treatment, and 14 experimental units for the third treatment. Part of the ANOVA table for this experiment is shown […]
CAL 131 Test 1
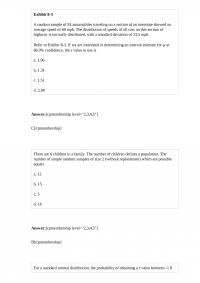
Exhibit 8-3 A random sample of 81 automobiles traveling on a section of an interstate showed an average speed of 60 mph. The distribution of speeds of all cars on this section of highway is normally distributed, with a standard […]
CAL 136 Midterm 2
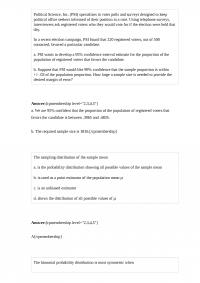
Political Science, Inc. (PSI) specializes in voter polls and surveys designed to keep political office seekers informed of their position in a race. Using telephone surveys, interviewers ask registered voters who they would vote for if the election were held […]
CAL 149
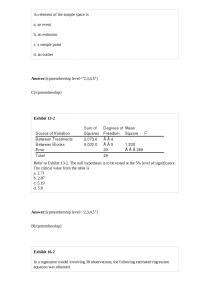
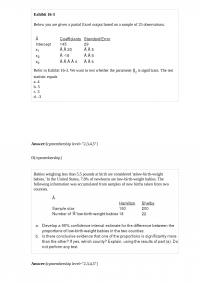
An element of the sample space is a. an event b. an estimator c. a sample point d. an outlier Exhibit 13-2 Refer to Exhibit 13-2. The null hypothesis is to be tested at the 5% level of significance. The […]
CAL 153 Test
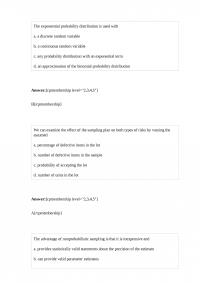
Exhibit 16-3 Below you are given a partial Excel output based on a sample of 25 observations. Refer to Exhibit 16-3. We want to test whether the parameter 2 is significant. The test statistic equals a. 4 b. 5 c. […]
CAL 156
The exponential probability distribution is used with a. a discrete random variable b. a continuous random variable c. any probability distribution with an exponential term d. an approximation of the binomial probability distribution We can examine the effect of the […]
CAL 168 Quiz 3
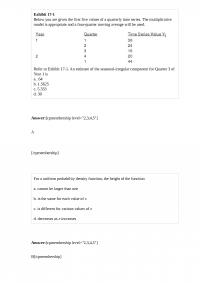
Exhibit 17-1 Below you are given the first five values of a quarterly time series. The multiplicative model is appropriate and a four-quarter moving average will be used. Refer to Exhibit 17-1. An estimate of the seasonal-irregular component for Quarter […]
CAL 205 Midterm
The variance is a weighted average of the a. square root of the deviations from the mean b. square root of the deviations from the median c. squared deviations from the median d. squared deviations from the mean Exhibit 18-6 […]
CAL 242 Midterm 2
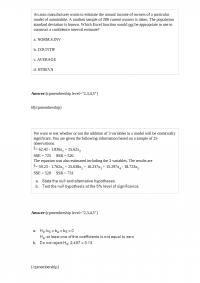
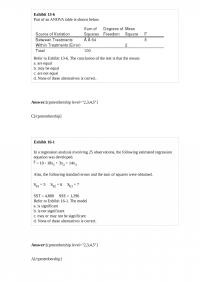
Exhibit 15-1 In a regression model involving 44 observations, the following estimated regression equation was obtained. = 29 + 18×1 +43×2 + 87×3 For this model SSR = 600 and SSE = 400. Refer to Exhibit 15-1. The computed F […]
CAL 255 Quiz 3
Missy Walters owns a mail-order business specializing in baby clothes. Missy is confident the dollar amounts of all her orders are normally distributed or nearly so. Assume she knows the mean and standard deviation are $249 and $46, respectively, for […]
CAL 290
The sample size that guarantees all estimates of proportions will meet the margin of error requirements is computed using a planning value of p equal to a. .01 b. .50 c. .51 d. .99 In an analysis of variance where […]
CAL 332 Quiz 3
If we change a 95% confidence interval estimate to a 99% confidence interval estimate, we can expect the a. width of the confidence interval to increase b. width of the confidence interval to decrease c. width of the confidence interval […]
CAL 336 Midterm
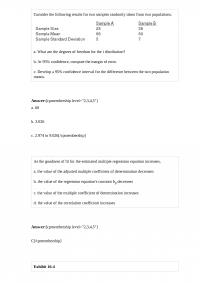
The adjusted multiple coefficient of determination is adjusted for a. the number of dependent variables b. the number of independent variables c. the number of equations d. detrimental situations As the number of degrees of freedom for a t distribution […]
CAL 364
An auto manufacturer wants to estimate the annual income of owners of a particular model of automobile. A random sample of 200 current owners is taken. The population standard deviation is known. Which Excel function would not be appropriate to […]
CAL 376
51. Which of the following observed on a control chart suggests a process that is not in control? a. Points follow a smooth pattern from the lower control limit to the upper control limit b. The number of points above […]
CAL 393 Quiz
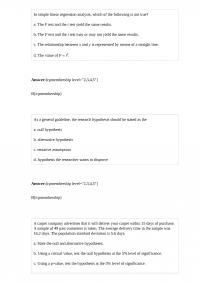
In simple linear regression analysis, which of the following is not true? a. The F test and the t test yield the same results. b. The F test and the t test may or may not yield the same results. […]
CAL 394
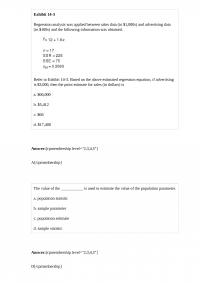
Exhibit 14-3 Regression analysis was applied between sales data (in $1,000s) and advertising data (in $100s) and the following information was obtained. Refer to Exhibit 14-3. Based on the above estimated regression equation, if advertising is $3,000, then the point […]
CAL 398 Test
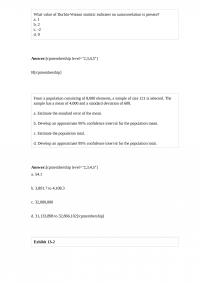
What value of Durbin-Watson statistic indicates no autocorrelation is present? a. 1 b. 2 c. -2 d. 0 From a population consisting of 8,000 elements, a sample of size 121 is selected. The sample has a mean of 4,000 and […]
CAL 403 Quiz 3
In hypothesis testing if the null hypothesis has been rejected when the alternative hypothesis has been true, a. a Type I error has been committed b. a Type II error has been committed c. either a Type I or Type […]
CAL 442 Test
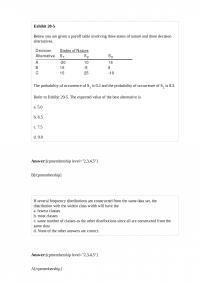
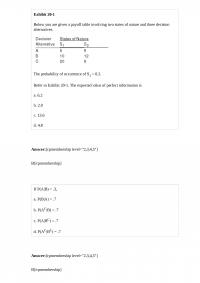
Exhibit 20-5 Below you are given a payoff table involving three states of nature and three decision alternatives. The probability of occurrence of S1 is 0.2 and the probability of occurrence of S2 is 0.3. Refer to Exhibit 20-5. The […]
CAL 471 Quiz
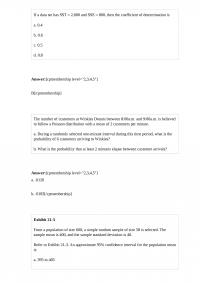
If a data set has SST 2,000 and SSE 800, then the coefficient of determination is a. 0.4 b. 0.6 c. 0.5 d. 0.8 The number of customers at Winkies Donuts between 8:00a.m. and 9:00a.m. is believed to […]
CAL 473 Test 1
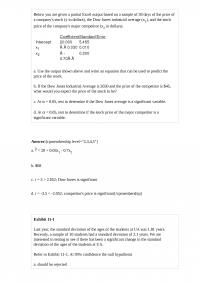
Below you are given a partial Excel output based on a sample of 30 days of the price of a company’s stock (y in dollars), the Dow Jones industrial average (x1), and the stock price of the company’s major competitor […]
CAL 475 Quiz 3
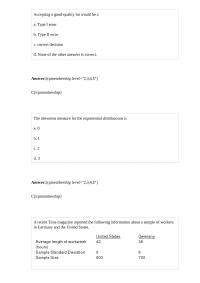
Accepting a good-quality lot would be a a. Type I error b. Type II error c. correct decision d. None of the other answers is correct. The skewness measure for the exponential distributions is a. 0 b. 1 c. 2 […]
CAL 483
It is known that the population variance equals 484. With a 0.95 probability, the sample size that needs to be taken to estimate the population mean if the desired margin of error is 5 or less is a. 25 b. […]
CAL 488
If the calculated lower-control limit of a p chart is negative, a. a mistake has been made in the calculations b. use the absolute value of the lower limit c. it is set to zero d. None of the other […]
CAL 512 Test
A standard normal distribution is a normal distribution with a. a mean of 1 and a standard deviation of 0 b. a mean of 0 and a standard deviation of 1 c. any mean and a standard deviation of 1 […]
CAL 562
Exhibit 11-1 Last year, the standard deviation of the ages of the students at UA was 1.81 years. Recently, a sample of 10 students had a standard deviation of 2.1 years. We are interested in testing to see if there […]
CAL 588 Quiz
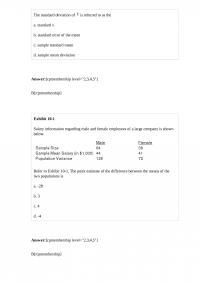
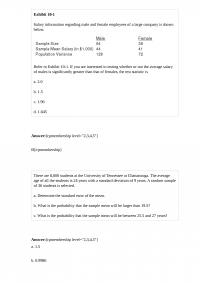
The standard deviation of is referred to as the a. standard x b. standard error of the mean c. sample standard mean d. sample mean deviation Exhibit 10-1 Salary information regarding male and female employees of a large company is […]
CAL 588 Quiz 2
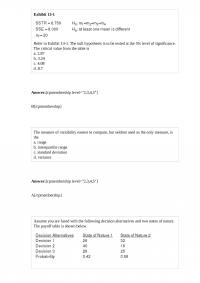
Exhibit 13-1 Refer to Exhibit 13-1. The null hypothesis is to be tested at the 5% level of significance. The critical value from the table is a. 2.87 b. 3.24 c. 4.08 d. 8.7 The measure of variability easiest to […]
CAL 615 Midterm 2
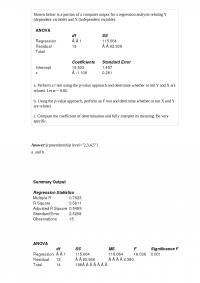
Shown below is a portion of a computer output for a regression analysis relating Y (dependent variable) and X (independent variable). a. Perform a t test using the p-value approach and determine whether or not Y and X are related. […]
CAL 623 Quiz 1
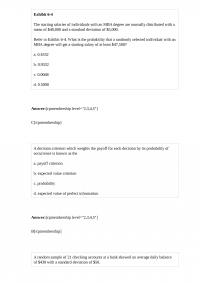
Exhibit 6-4 The starting salaries of individuals with an MBA degree are normally distributed with a mean of $40,000 and a standard deviation of $5,000. Refer to Exhibit 6-4. What is the probability that a randomly selected individual with an […]
CAL 643 Final
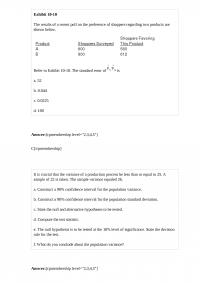
Exhibit 10-10 The results of a recent poll on the preference of shoppers regarding two products are shown below. Refer to Exhibit 10-10. The standard error of is a. 52 b. 0.044 c. 0.0225 d. 100 It is crucial that […]
CAL 656 Quiz 1
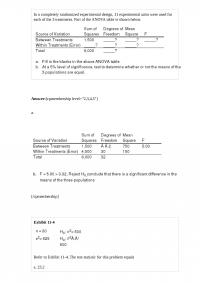
In a completely randomized experimental design, 11 experimental units were used for each of the 3 treatments. Part of the ANOVA table is shown below. Exhibit 11-4 Refer to Exhibit 11-4. The test statistic for this problem equals a. 23.2 […]
CAL 658 Test 2
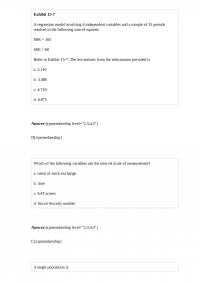
Exhibit 15-7 A regression model involving 4 independent variables and a sample of 15 periods resulted in the following sum of squares. SSR = 165 SSE = 60 Refer to Exhibit 15-7. The test statistic from the information provided is […]
CAL 662 Midterm
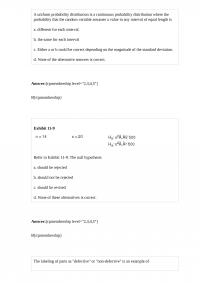
A uniform probability distribution is a continuous probability distribution where the probability that the random variable assumes a value in any interval of equal length is a. different for each interval b. the same for each interval c. Either a […]
CAL 664
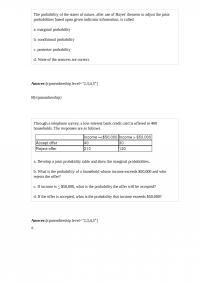
The probability of the states of nature, after use of Bayes’ theorem to adjust the prior probabilities based upon given indicator information, is called a. marginal probability b. conditional probability c. posterior probability d. None of the answers are correct. […]
CAL 675 Quiz 3
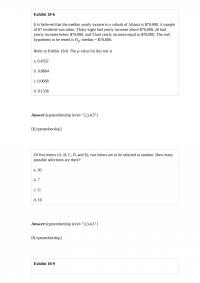
Exhibit 18-6 It is believed that the median yearly income in a suburb of Atlanta is $70,000. A sample of 67 residents was taken. Thirty-eight had yearly incomes above $70,000, 26 had yearly incomes below $70,000, and 3 had yearly […]
CAL 676 Midterm 2
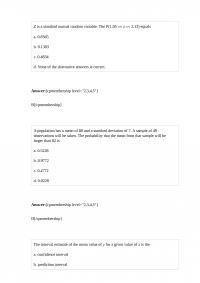
Z is a standard normal random variable. The P(1.05 z 2.13) equals a. 0.8365 b. 0.1303 c. 0.4834 d. None of the alternative answers is correct. A population has a mean of 80 and a standard deviation of […]
CAL 736
Exhibit 13-6 Part of an ANOVA table is shown below. Refer to Exhibit 13-6. The conclusion of the test is that the means a. are equal b. may be equal c. are not equal d. None of these alternatives is […]
CAL 748
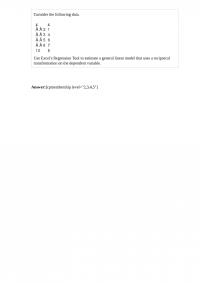
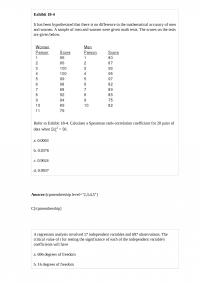
Consider the following data. Use Excel’s Regression Tool to estimate a general linear model that uses a reciprocal transformation on the dependent variable. Answer: Exhibit 18-4 It has been hypothesized that there is no difference in the mathematical accuracy of […]
CAL 752 Quiz 2
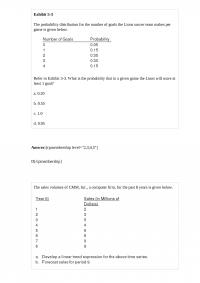
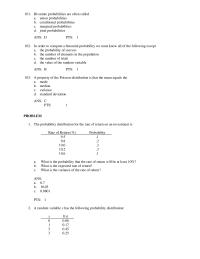
Exhibit 5-3 The probability distribution for the number of goals the Lions soccer team makes per game is given below. Refer to Exhibit 5-3. What is the probability that in a given game the Lions will score at least 1 […]
CAL 764 Test 2
Exhibit 18-4 It has been hypothesized that there is no difference in the mathematical accuracy of men and women. A sample of men and women were given math tests. The scores on the tests are given below. Refer to Exhibit […]
CAL 775 Midterm 1
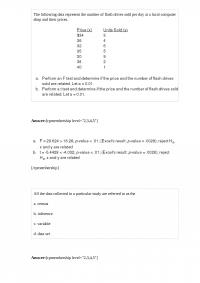
The following data represent the number of flash drives sold per day at a local computer shop and their prices. All the data collected in a particular study are referred to as the a. census b. inference c. variable d. […]
CAL 812 Quiz
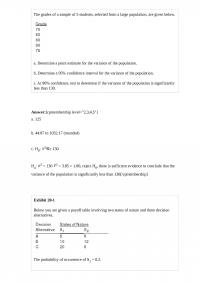
The grades of a sample of 5 students, selected from a large population, are given below. a. Determine a point estimate for the variance of the population. b. Determine a 95% confidence interval for the variance of the population. c. […]
Chapter 10 These Employees Have Gone through Training Session Both
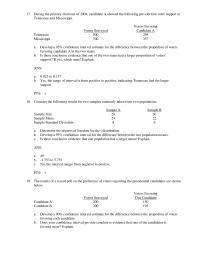
17. During the primary elections of 2004, candidate A showed the following pre-election voter support in Tennessee and Mississippi. Voters Surveyed Voters Favoring Candidate A Tennessee 500 295 Mississippi 700 357 a. Develop a 95% confidence interval estimate for the […]
Chapter 10 variance of the sampling distribution of
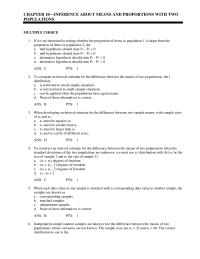
CHAPTER 10—INFERENCE ABOUT MEANS AND PROPORTIONS WITH TWO POPULATIONS MULTIPLE CHOICE 1. If we are interested in testing whether the proportion of items in population 1 is larger than the proportion of items in population 2, the a. null hypothesis […]
Chapter 11 Refer Exhibit 115 The Test Statistic For
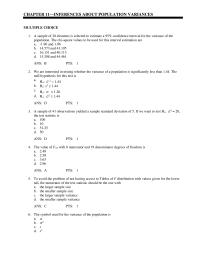
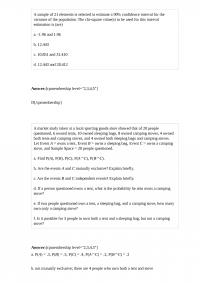
CHAPTER 11—INFERENCES ABOUT POPULATION VARIANCES MULTIPLE CHOICE 1. A sample of 28 elements is selected to estimate a 95% confidence interval for the variance of the population. The chi-square values to be used for this interval estimation are a. -1.96 […]
Chapter 11 The Grades Sample Students Selected From
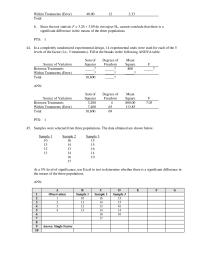
7. A lumber company has claimed that the standard deviation for the lengths of their 6 foot boards is 0.5 inches or less. To test their claim, a random sample of 17 six-foot boards is selected; and it is determined […]
Chapter 12 Five hundred randomly selected automobile owners were questioned
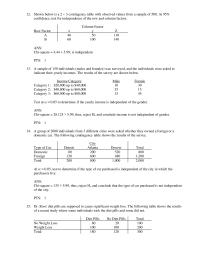
12. Shown below is a 2 3 contingency table with observed values from a sample of 500. At 95% confidence, test for independence of the row and column factors. Column Factor Row Factor x y Z A 40 50 […]
Chapter 12 Poisson Distribution Goodness Fit Test Normal Distribution
CHAPTER 12—TESTS OF GOODNESS OF FIT, INDEPENDENCE AND MULTIPLE PROPORTIONS MULTIPLE CHOICE 1. A population where each element of the population is assigned to one and only one of several classes or categories is a a. multinomial population b. Poisson […]
Chapter 13 A dietician wants to see if there is any difference
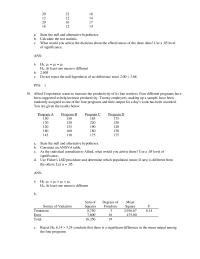
Within Treatments (Error) 40.00 12 3.33 44. In a completely randomized experimental design, 14 experimental units were used for each of the 5 levels of the factor (i.e., 5 treatments). Fill in the blanks in the following ANOVA table. Source […]
Chapter 13 Anova Procedure Used For Data
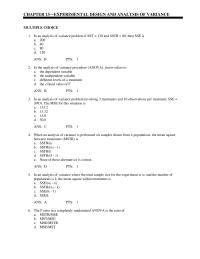
CHAPTER 13—EXPERIMENTAL DESIGN AND ANALYSIS OF VARIANCE MULTIPLE CHOICE 1. In an analysis of variance problem if SST = 120 and SSTR = 80, then SSE is a. 200 b. 40 c. 80 d. 120 2. In the analysis of […]
Chapter 13 The Three Major Automobile Manufacturers Have Entered
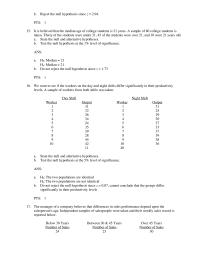
20 22 18 12 12 14 20 16 17 18 12 14 a. State the null and alternative hypotheses. b. Calculate the test statistic. c. What would you advise the dietician about the effectiveness of the three diets? Use a […]
Chapter 15 The numerical value of the coefficient of determination
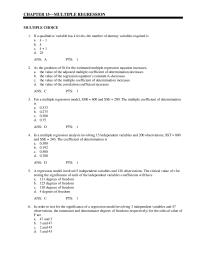
CHAPTER 15—MULTIPLE REGRESSION MULTIPLE CHOICE 1. If a qualitative variable has k levels, the number of dummy variables required is a. k − 1 b. k c. k + 1 d. 2k 2. As the goodness of fit for the […]
Chapter 16 Refer Exhibit 164 From The Above Function
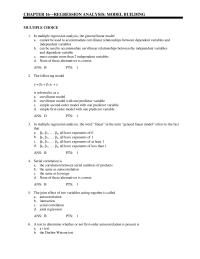
CHAPTER 16—REGRESSION ANALYSIS: MODEL BUILDING MULTIPLE CHOICE 1. In multiple regression analysis, the general linear model a. cannot be used to accommodate curvilinear relationships between dependent variables and independent variables b. can be used to accommodate curvilinear relationships between the […]
Chapter 16 Soft Drink Manufacturer Has Developed Regression
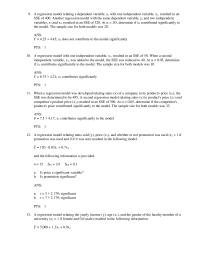
9. A regression model relating a dependent variable, y, with one independent variable, x1, resulted in an SSE of 400. Another regression model with the same dependent variable, y, and two independent variables, x1 and x2, resulted in an SSE […]
Chapter 17 Below You Are Given The Seasonal
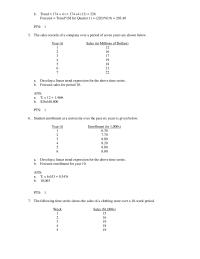
5. The sales records of a company over a period of seven years are shown below. Year (t) Sales (in Millions of Dollars) 1 12 2 16 3 17 4 19 5 18 6 21 7 22 a. Develop a […]
Chapter 17 the estimate of the seasonal component is 94%
Chapter 17 – Time Series Analysis and Forecasting MULTIPLE CHOICE 1. Common types of data patterns that can be identified when examining a time series plot include all of the following except a. horizontal b. vertical c. seasonal d. cyclical […]
Chapter 18 Exhibit 185 The Null Hypothesis Should Bea
CHAPTER 18—NONPARAMETRIC METHODS MULTIPLE CHOICE 1. Statistical methods that generally require very few, if any, assumptions about the population distribution are known as a. parametric b. nonparametric c. free methods d. None of these alternatives is correct. 2. Which of […]
Chapter 18 Three universities in your state have decided
15. It is believed that the median age of college students is 21 years. A sample of 80 college students is taken. Thirty of the students were under 21, 45 of the students were over 21, and 10 were 21 […]
Chapter 19 None The Other Answers Correctans Cpts 132
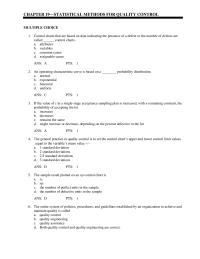
CHAPTER 19—STATISTICAL METHODS FOR QUALITY CONTROL MULTIPLE CHOICE 1. Control charts that are based on data indicating the presence of a defect or the number of defects are called ______ control charts. a. attributes b. variables c. common-cause d. assignable-cause […]
Chapter 2 Excels Can Used Construct
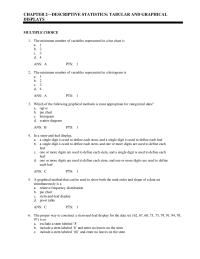
CHAPTER 2—DESCRIPTIVE STATISTICS: TABULAR AND GRAPHICAL DISPLAYS MULTIPLE CHOICE 1. The minimum number of variables represented in a bar chart is a. 1 b. 2 c. 3 d. 4 2. The minimum number of variables represented in a histogram is […]
Chapter 2 For The Following Observations Plot Scatter Diagram
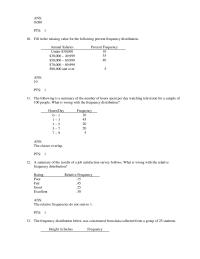
10. Fill in the missing value for the following percent frequency distribution. Annual Salaries Percent Frequency Under $30,000 10 $30,000 − 49,999 35 $50,000 − 69,999 40 $70,000 − 89,999 $90,000 and over 5 ANS: 10 PTS: 1 11. The […]
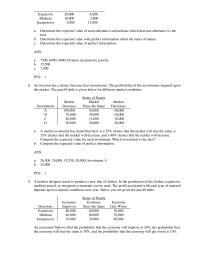
Chapter 20 Compute the expected value of perfect information
Expensive 20,000 -5,000 Medium 10,000 2,000 Inexpensive 5,000 11,000 a. Determine the expected value of each alternative and indicate which decision alternative is the best. b. Determine the expected value with perfect information about the states of nature. c. Determine […]
Chapter 20 Refer Exhibit 205 The Expected Value The
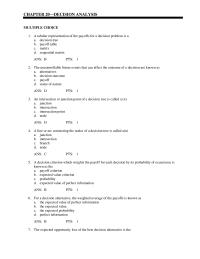
CHAPTER 20—DECISION ANALYSIS MULTIPLE CHOICE 1. A tabular representation of the payoffs for a decision problem is a a. decision tree b. payoff table c. matrix d. sequential matrix 2. The uncontrollable future events that can affect the outcome of […]
Chapter 21 Any method of sampling for which the probability of selecting
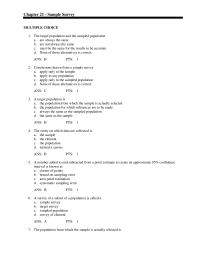
Chapter 21 – Sample Survey MULTIPLE CHOICE 1. The target population and the sampled population a. are always the same b. are not always the same c. must be the same for the results to be accurate d. None of […]
Chapter 3 Since The Covariance Negative Indicates Negative Relationship between
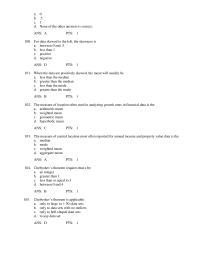
a. 0 b. .5 c. 1 d. None of the other answers is correct. 100. For data skewed to the left, the skewness is a. between 0 and .5 b. less than 1 c. positive d. negative ANS: D PTS: […]
Chapter 4 Company And Company The Probability Getting An offer
11. Assume two events A and B are mutually exclusive and, furthermore, P(A) = 0.2 and P(B) = 0.4. a. Find P(A B). b. Find P(A B). c. Find P(AB). 12. You are given the following information on […]
Chapter 4 Each urn contains chips numbered from 0 to 9
CHAPTER 4—INTRODUCTION TO PROBABILITY MULTIPLE CHOICE 1. The probability of at least one head in two flips of a coin is a. 0.33 b. 0.50 c. 0.75 d. 1.00 2. Revised probabilities of events based on additional information are a. […]
Chapter 5 Define The Random Variable Words For This
101. Bivariate probabilities are often called a. union probabilities b. conditional probabilities c. marginal probabilities d. joint probabilities 102. In order to compute a binomial probability we must know all of the following except a. the probability of success b. […]
Chapter 6 What Percentage All Bottles Produced Contains More
98. A property of the exponential distribution is that the mean equals the a. mode b. median c. variance d. standard deviation ANS: D PTS: 1 99. The skewness measure for the exponential distributions is a. 0 b. 1 c. […]
Chapter 7 Sample New Models Automobiles Provides The Following
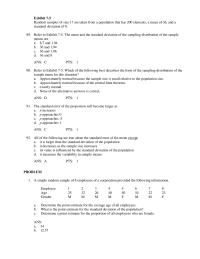
Exhibit 7-5 Random samples of size 17 are taken from a population that has 200 elements, a mean of 36, and a standard deviation of 8. 89. Refer to Exhibit 7-5. The mean and the standard deviation of the sampling […]
Chapter 7 The Distribution The Population Unknown The Mean
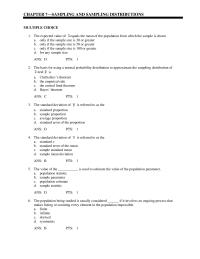
CHAPTER 7—SAMPLING AND SAMPLING DISTRIBUTIONS MULTIPLE CHOICE 1. The expected value of equals the mean of the population from which the sample is drawn a. only if the sample size is 30 or greater b. only if the sample size […]
Chapter 8 As the level of confidence increases, the confidence interval gets
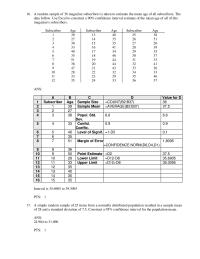
16. A random sample of 36 magazine subscribers is taken to estimate the mean age of all subscribers. The data follow. Use Excel to construct a 90% confidence interval estimate of the mean age of all of this magazine’s subscribers. […]
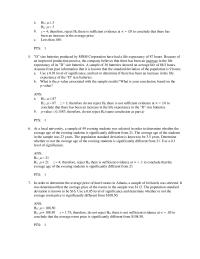
Chapter 9 therefore, reject h0, there is sufficient evidence at
5. “D” size batteries produced by MNM Corporation have had a life expectancy of 87 hours. Because of an improved production process, the company believes that there has been an increase in the life expectancy of its “D” size batteries. […]
MATH 123 Midterm 2
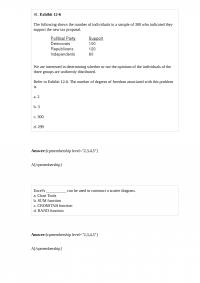
A numerical measure, such as a mean, computed from a population is known as a a. population parameter b. sample parameter c. sample statistic d. sample mean A company attempts to evaluate the potential for a new bonus plan by […]
MATH 147
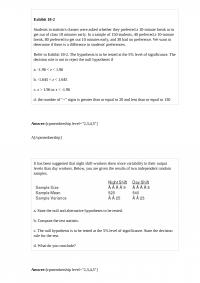
41. Exhibit 12-6 The following shows the number of individuals in a sample of 300 who indicated they support the new tax proposal. We are interested in determining whether or not the opinions of the individuals of the three groups […]
MATH 180
Exhibit 18-2 Students in statistics classes were asked whether they preferred a 10-minute break or to get out of class 10 minutes early. In a sample of 150 students, 40 preferred a 10-minute break, 80 preferred to get out 10 […]
MATH 181 Quiz 2
It is known that the variance of a population equals 1,936. A random sample of 121 has been taken from the population. There is a .95 probability that the sample mean will provide a margin of error of a. 7.84 […]
MATH 231 Test 1
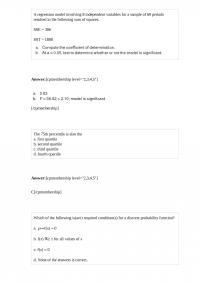
A regression model involving 8 independent variables for a sample of 69 periods resulted in the following sum of squares. SSE = 306 SST = 1800 The 75th percentile is also the a. first quartile b. second quartile c. third […]
MATH 265
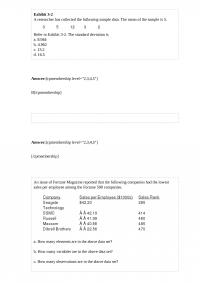
Exhibit 3-2 A researcher has collected the following sample data. The mean of the sample is 5. Refer to Exhibit 3-2. The standard deviation is a. 8.944 b. 4.062 c. 13.2 d. 16.5 An issue of Fortune Magazine reported that […]
MATH 277 Test 1
Prior probabilities are the probabilities of the states of nature a. after obtaining sample information b. prior to obtaining of perfect information c. prior to obtaining sample information d. after obtaining perfect information You are given the following results from […]
MATH 279 Quiz 3
If the assumption can be made that the populations all have the same shape, the Kruskal-Wallis test becomes a. a test of the skewness of the k populations b. a test of the variances of the k populations c. a […]
MATH 280 Quiz
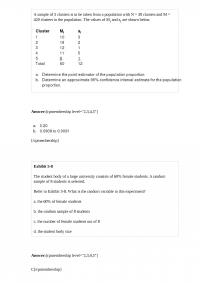
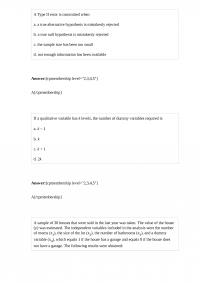
A sample of 5 clusters is to be taken from a population with N = 30 clusters and M = 420 clusters in the population. The values of Mi and ai are shown below. Exhibit 5-8 The student body of […]
MATH 311
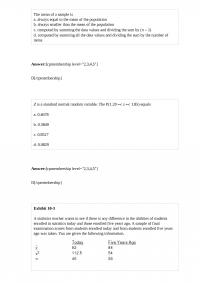
A Type II error is committed when a. a true alternative hypothesis is mistakenly rejected b. a true null hypothesis is mistakenly rejected c. the sample size has been too small d. not enough information has been available If a […]
MATH 314 Final
The mean of a sample is a. always equal to the mean of the population b. always smaller than the mean of the population c. computed by summing the data values and dividing the sum by (n 1) d. […]
MATH 321
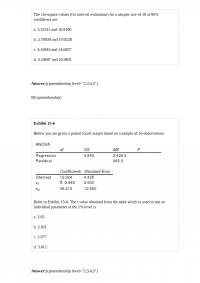
The chi-square values (for interval estimation) for a sample size of 10 at 95% confidence are a. 3.32511 and 16.9190 b. 2.70039 and 19.0228 c. 4.16816 and 14.6837 d. 3.24697 and 20.4831 Exhibit 15-6 Below you are given a partial […]
MATH 338
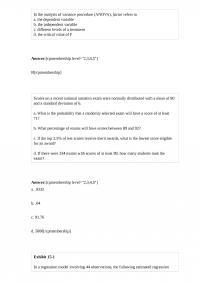
In the analysis of variance procedure (ANOVA), factor refers to a. the dependent variable b. the independent variable c. different levels of a treatment d. the critical value of F Scores on a recent national statistics exam were normally distributed […]
MATH 342 Homework
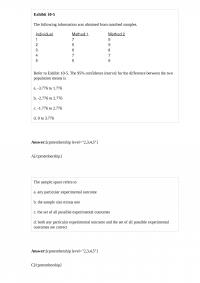
Exhibit 10-5 The following information was obtained from matched samples. Refer to Exhibit 10-5. The 95% confidence interval for the difference between the two population means is a. -3.776 to 1.776 b. -2.776 to 2.776 c. -1.776 to 2.776 d. […]
MATH 369 Test
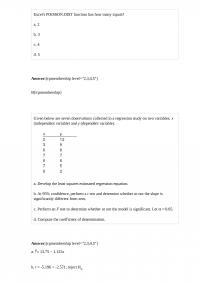
Excel’s POISSON.DIST function has how many inputs? a. 2 b. 3 c. 4 d. 5 Given below are seven observations collected in a regression study on two variables, x (independent variable) and y (dependent variable). a. Develop the least squares […]
MATH 387 Quiz 3
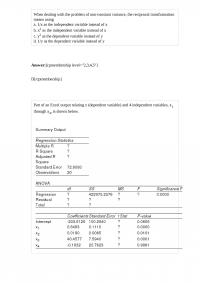
When dealing with the problem of non-constant variance, the reciprocal transformation means using a. 1/x as the independent variable instead of x b. x2 as the independent variable instead of x c. y2 as the dependent variable instead of y […]
MATH 423 Quiz 1
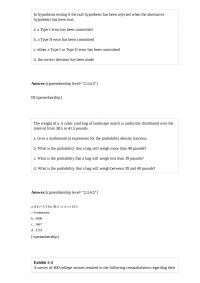
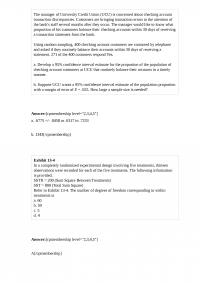
The manager of University Credit Union (UCU) is concerned about checking account transaction discrepancies. Customers are bringing transaction errors to the attention of the bank’s staff several months after they occur. The manager would like to know what proportion of […]
MATH 426
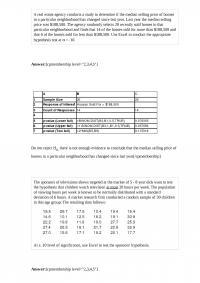
A real estate agency conducts a study to determine if the median selling price of homes in a particular neighborhood has changed since last year. Last year the median selling price was $188,500. The agency randomly selects 20 recently sold […]
MATH 429 Quiz
A multiple regression model has a. only one independent variable b. more than one dependent variable c. more than one independent variable d. at least 2 dependent variables When the conclusions based upon the aggregated crosstabulation can be completely reversed […]
MATH 457 Quiz
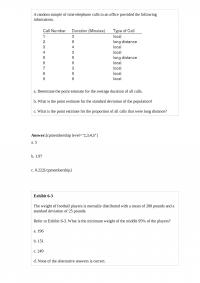
A random sample of nine telephone calls in an office provided the following information. a. Determine the point estimate for the average duration of all calls. b. What is the point estimate for the standard deviation of the population? c. […]
MATH 461
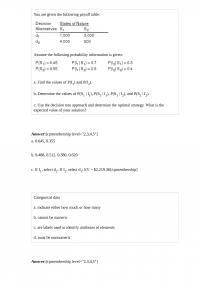
You are given the following payoff table: Assume the following probability information is given: a. Find the values of P(I1) and P(I2). b. Determine the values of P(S1 | I1), P(S2 | I1), P(S1 | I2), and P(S2 | I2). […]
MATH 464
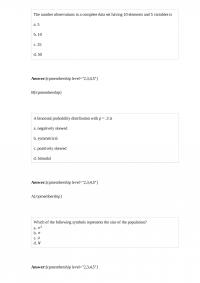
The number observations in a complete data set having 10 elements and 5 variables is a. 5 b. 10 c. 25 d. 50 A binomial probability distribution with p = .3 is a. negatively skewed b. symmetrical c. positively skewed […]
MATH 478 Midterm 1
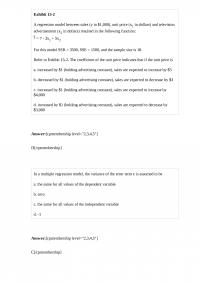
Exhibit 15-2 A regression model between sales (y in $1,000), unit price (x1 in dollars) and television advertisement (x2 in dollars) resulted in the following function: = 7 – 3×1 + 5×2 For this model SSR = 3500, SSE = […]
MATH 492
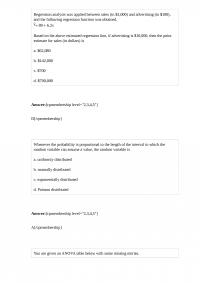
Regression analysis was applied between sales (in $1,000) and advertising (in $100), and the following regression function was obtained. 80 6.2x Based on the above estimated regression line, if advertising is $10,000, then the point estimate for sales […]
MATH 518
A sample of 21 elements is selected to estimate a 90% confidence interval for the variance of the population. The chi-square value(s) to be used for this interval estimation is (are) a. -1.96 and 1.96 b. 12.443 c. 10.851 and […]
MATH 518 Midterm 1
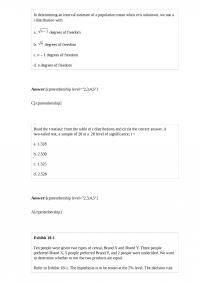
In determining an interval estimate of a population mean when is unknown, we use a t distribution with a. degrees of freedom b. degrees of freedom c. n 1 degrees of freedom d. n degrees of freedom Read […]
MATH 525
Exhibit 20-1 Below you are given a payoff table involving two states of nature and three decision alternatives. The probability of occurrence of S1 = 0.2. Refer to Exhibit 20-1. The expected value of perfect information is a. 6.2 b. […]
MATH 528
Consider the following results for two samples randomly taken from two populations. a. What are the degrees of freedom for the t distribution? b. At 95% confidence, compute the margin of error. c. Develop a 95% confidence interval for the […]
MATH 531 Quiz 2
A simple random sample of size n from a finite population of size N is a sample selected such that each possible sample of size a. N has the same probability of being selected b. n has a probability of […]
MATH 534 Midterm 2
Exhibit 10-1 Salary information regarding male and female employees of a large company is shown below. Refer to Exhibit 10-1. If you are interested in testing whether or not the average salary of males is significantly greater than that of […]
MATH 537
DFSS stands for a. Defects Found Sifting and Sorting b. Design For Six Sigma c. Deviation From Specifications and Standards d. Defer For Statistical Study χ.9752 = 8.9066 indicates that a. 97.5% of the chi-square values are greater than 8.9066. […]
MATH 547 Test 2
In statistical experiments, each time the experiment is repeated a. the same outcome must occur b. the same outcome cannot occur again c. a different outcome may occur d. None of the other answers is correct. The value of F0.01 […]
MATH 561 Quiz 3
The critical F value with 6 numerator and 60 denominator degrees of freedom at = . 05 is a. 3.74 b. 2.25 c. 2.37 d. 1.96 The population being studied is usually considered ______ if it involves an ongoing […]
MATH 564 Homework
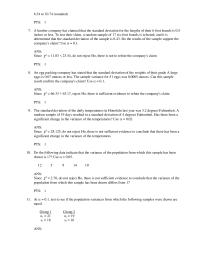
A meteorologist stated that the average temperature during July in Chattanooga was 80 degrees. A sample of 32 Julys was taken. The correct set of hypotheses is a. H0: 80 Ha: 80 b. H0: 80 Ha: > […]
MATH 578 Quiz 2
The probability distribution of all possible values of the sample proportion is the a. probability density function of b. sampling distribution of c. same as , since it considers all possible values of the sample proportion d. sampling distribution of […]
MATH 602
The salespeople at Gold Key Realty sell up to 9 houses per month. The probability distribution of a salesperson selling x houses in a month is as follows: a. What are the mean and standard deviation for the number of […]
MATH 604 Quiz
If two events are mutually exclusive, then the probability of their intersection a. will be equal to zero b. can have any value larger than zero c. must be larger than zero, but less than one d. will be one […]
MATH 667 Test
A control chart that is used to monitor the range of the measurements in a sample is a. a p chart b. an x-bar chart c. an R chart d. an np chart The sample result plotted on an np […]
MATH 680 Test 2
A population has a mean of 53 and a standard deviation of 21. A sample of 49 observations will be taken. The probability that the sample mean will be greater than 57.95 is a. 0 b. .0495 c. .4505 d. […]
MATH 691
A random sample of 25 statistics examinations was taken. The average score in the sample was 76 with a variance of 144. Assuming the scores are normally distributed, the 99% confidence interval for the population average examination score is a. […]
MATH 692
An intersection or junction point of a decision tree is called a (n) a. junction b. intersection c. intersection point d. node A movie based on a best-selling novel was recently released. Six hundred viewers of the movie, 235 of […]
MATH 699 Midterm 2
When should measures of location and dispersion be computed from grouped data rather than from individual data values? a. as much as possible since computations are easier b. only when individual data values are unavailable c. whenever computer packages for […]
MATH 739 Midterm 1
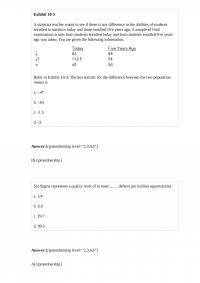
Exhibit 10-3 A statistics teacher wants to see if there is any difference in the abilities of students enrolled in statistics today and those enrolled five years ago. A sample of final examination scores from students enrolled today and from […]
MATH 760 Final
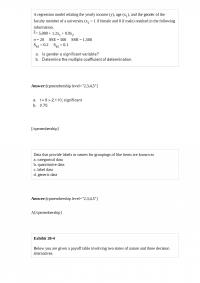
A regression model relating the yearly income (y), age (x1), and the gender of the faculty member of a university (x2 = 1 if female and 0 if male) resulted in the following information. = 5,000 + 1.2×1 + 0.9×2 […]
MATH 776 Quiz 3
If a penny is tossed four times and comes up heads all four times, the probability of heads on the fifth trial is a. zero b. 1/32 c. 0.5 d. larger than the probability of tails Sixty percent of the […]
MATH 778 Midterm
For the standard normal distribution, determine the probability of obtaining a z value a. greater than zero. b. between -2.34 to -2.55 c. less than 1.86. d. between -1.95 to 2.7. e. between 1.5 to 2.75. 46. Exhibit 17-3 Consider […]
MATH 780 Midterm 1
The number of haircuts performed each day at KwikKuts in the last four weeks is listed below. a. Plot the sales data. Do you see both trend and seasonality components in the data? b. Forecast the number of haircuts to […]
MATH 792 Quiz
The manager of University Credit Union (UCU) is concerned about checking account transaction discrepancies. Customers are bringing transaction errors to the attention of the bank’s staff several months after they occur. The manager would like to know what proportion of […]
MATH 798 Homework
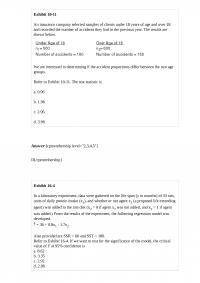
Exhibit 10-11 An insurance company selected samples of clients under 18 years of age and over 18 and recorded the number of accidents they had in the previous year. The results are shown below. We are interested in determining if […]
MATH 817
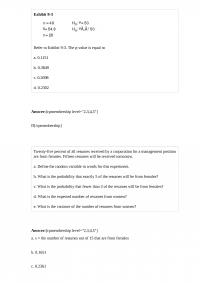
Exhibit 9-3 Refer to Exhibit 9-3. The p-value is equal to a. 0.1151 b. 0.3849 c. 0.2698 d. 0.2302 Twenty-five percent of all resumes received by a corporation for a management position are from females. Fifteen resumes will be received […]
MATH 820 Midterm
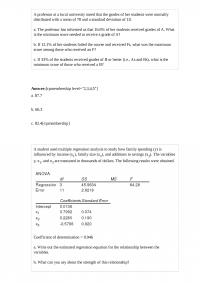
A professor at a local university noted that the grades of her students were normally distributed with a mean of 78 and a standard deviation of 10. a. The professor has informed us that 16.6% of her students received grades […]
MATH 854
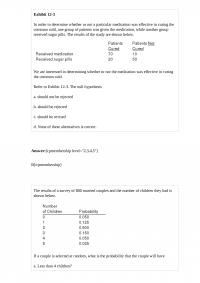
Exhibit 12-3 In order to determine whether or not a particular medication was effective in curing the common cold, one group of patients was given the medication, while another group received sugar pills. The results of the study are shown […]
MATH 895 Test 1
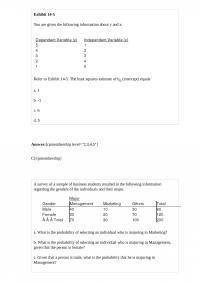
Exhibit 14-5 You are given the following information about y and x. Refer to Exhibit 14-5. The least squares estimate of b0 (intercept) equals a. 1 b. -1 c. 6 d. 5 A survey of a sample of business students […]
MATH Excel’s Can Be Used To Construct A Crosstabulation
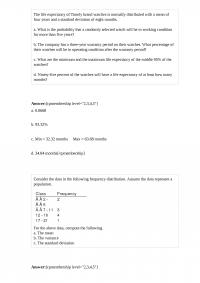
The life expectancy of Timely brand watches is normally distributed with a mean of four years and a standard deviation of eight months. a. What is the probability that a randomly selected watch will be in working condition for more […]