A uniform probability distribution is a continuous probability distribution where the
probability that the random variable assumes a value in any interval of equal length is
a. different for each interval
b. the same for each interval
c. Either a or b could be correct depending on the magnitude of the standard deviation.
d. None of the alternative answers is correct.
Exhibit 11-9
Refer to Exhibit 11-9. The null hypothesis
a. should be rejected
b. should not be rejected
c. should be revised
d. None of these alternatives is correct.
The labeling of parts as “defective” or “non-defective” is an example of

a. ordinal data
b. ratio data
c. interval data
d. nominal data
Exhibit 8-1
In order to estimate the average time spent on the computer terminals per student at a
local university, data were collected from a sample of 81 business students over a
one-week period. Assume the population standard deviation is 1.2 hours.
Refer to Exhibit 8-1. The standard error of the mean is
a. 7.5
b. 0.014
c. 0.160
d. 0.133
Starting annual salaries for business school graduates majoring in finance and
management information systems (MIS) were collected in two independent random
samples summarized below. Based on previous studies, the population standard
deviations for Finance and MIS salaries are estimated to be $2,100 and $2,600,
respectively.
Finance MIS

n1 = 60 n2 = 50
= $43,200 = $46,500
a. Develop a 95% confidence interval estimate of the difference between the starting
salaries for the two majors.
b. Using
= .10, test to determine if the average starting salary for an MIS graduate is
$4,000 more than the starting salary for a finance graduate. Use both the critical value
and p-value approaches to hypothesis testing. (Hint: the null hypothesis is H0:
1 ‘“
2 =
$4,000, where
1 is the average starting salary of MIS graduates.)
The degrees of freedom for a contingency table with 6 rows and 3 columns is
a. 18
b. 15
c. 6
d. 10
If the coefficient of correlation is 0.4, the percentage of variation in the dependent
variable explained by the estimated regression equation
a. is 40%

b. is 16%
c. is 4%
d. can be any positive value
Exhibit 12-4
In the past, 35% of the students at ABC University were in the Business College, 35%
of the students were in the Liberal Arts College, and 30% of the students were in the
Education College. To see whether or not the proportions have changed, a sample of
300 students was taken. Ninety of the sample students are in the Business College, 120
are in the Liberal Arts College, and 90 are in the Education College.
Refer to Exhibit 12-4. The conclusion of the test is that the
a. proportions have changed significantly
b. proportions have not changed significantly
c. test is inconclusive
d. None of these alternatives is correct.
A procedure used for finding the equation of a straight line that provides the best
approximation for the relationship between the independent and dependent variables is
the
a. correlation analysis

b. mean squares method
c. least squares method
d. most squares method
The weight of a ball bearing, measured in milligrams, is an example of
a. categorical data
b. either categorical or quantitative data
c. neither categorical nor quantitative data
d. quantitative data
The hourly wages of a sample of eight individuals is given below.
For the above sample, determine the following measures:
a. The mean.

b. The standard deviation.
c. The 25th percentile.
The time series pattern that reflects repeating variability within a single year is called
the
a. trend pattern
b. seasonal pattern
c. trend and seasonal pattern
d. cyclical pattern
Exhibit 15-6
Below you are given a partial Excel output based on a sample of 16 observations.

Refer to Exhibit 15-6. The degrees of freedom for the sum of squares explained by the
regression (SSR) are
a. 2
b. 3
c. 13
d. 15
A sample of 25 observations is taken from a process (an infinite population). The
sampling distribution of is
a. not normal since n 30
b. approximately normal because is always normally distributed
c. approximately normal if np 5 and n(1-p) 5
d. approximately normal if np 30 and n(1-p) 30
From production line A, a sample of 500 items is selected at random, and it is
determined that 30 items are defective. In a sample of 300 items from production
process B (which produces identical items to line A), there are 12 defective items.
Determine a 95% confidence interval estimate for the difference between the
proportions of defectives in the two lines.
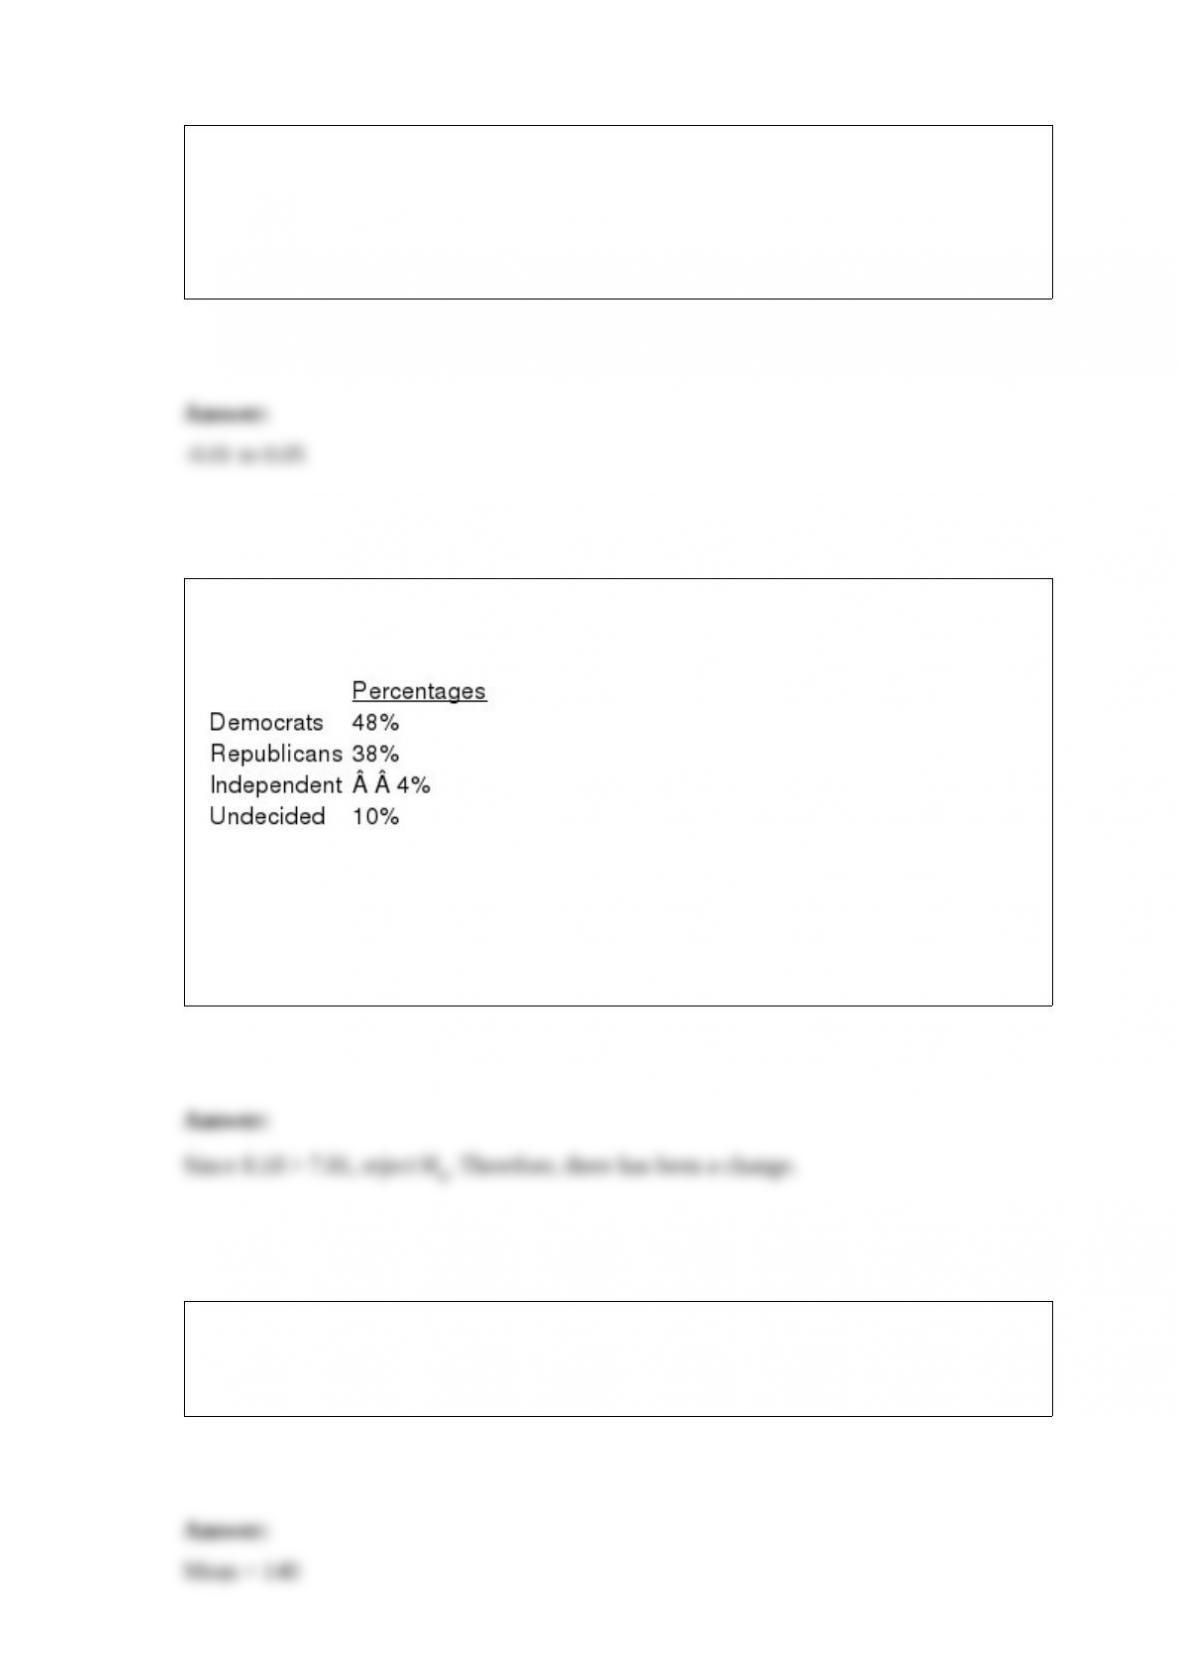
Before the presidential debates, it was expected that the percentages of registered voters
in favor of various candidates to be as follows.
After the presidential debates, a random sample of 1200 voters showed that 540 favored
the Democratic candidate; 480 were in favor of the Republican candidate; 40 were in
favor of the Independent candidate, and 140 were undecided. At a 5% level of
significance, test to see if the proportion of voters has changed.
In a sample of 300 shoppers, 160 indicated they prefer fluoride toothpaste, 120 favored
nonfluoride, and 20 were indifferent. At a 0.05 level of significance, test for a difference
in the preference for the two kinds of toothpaste.
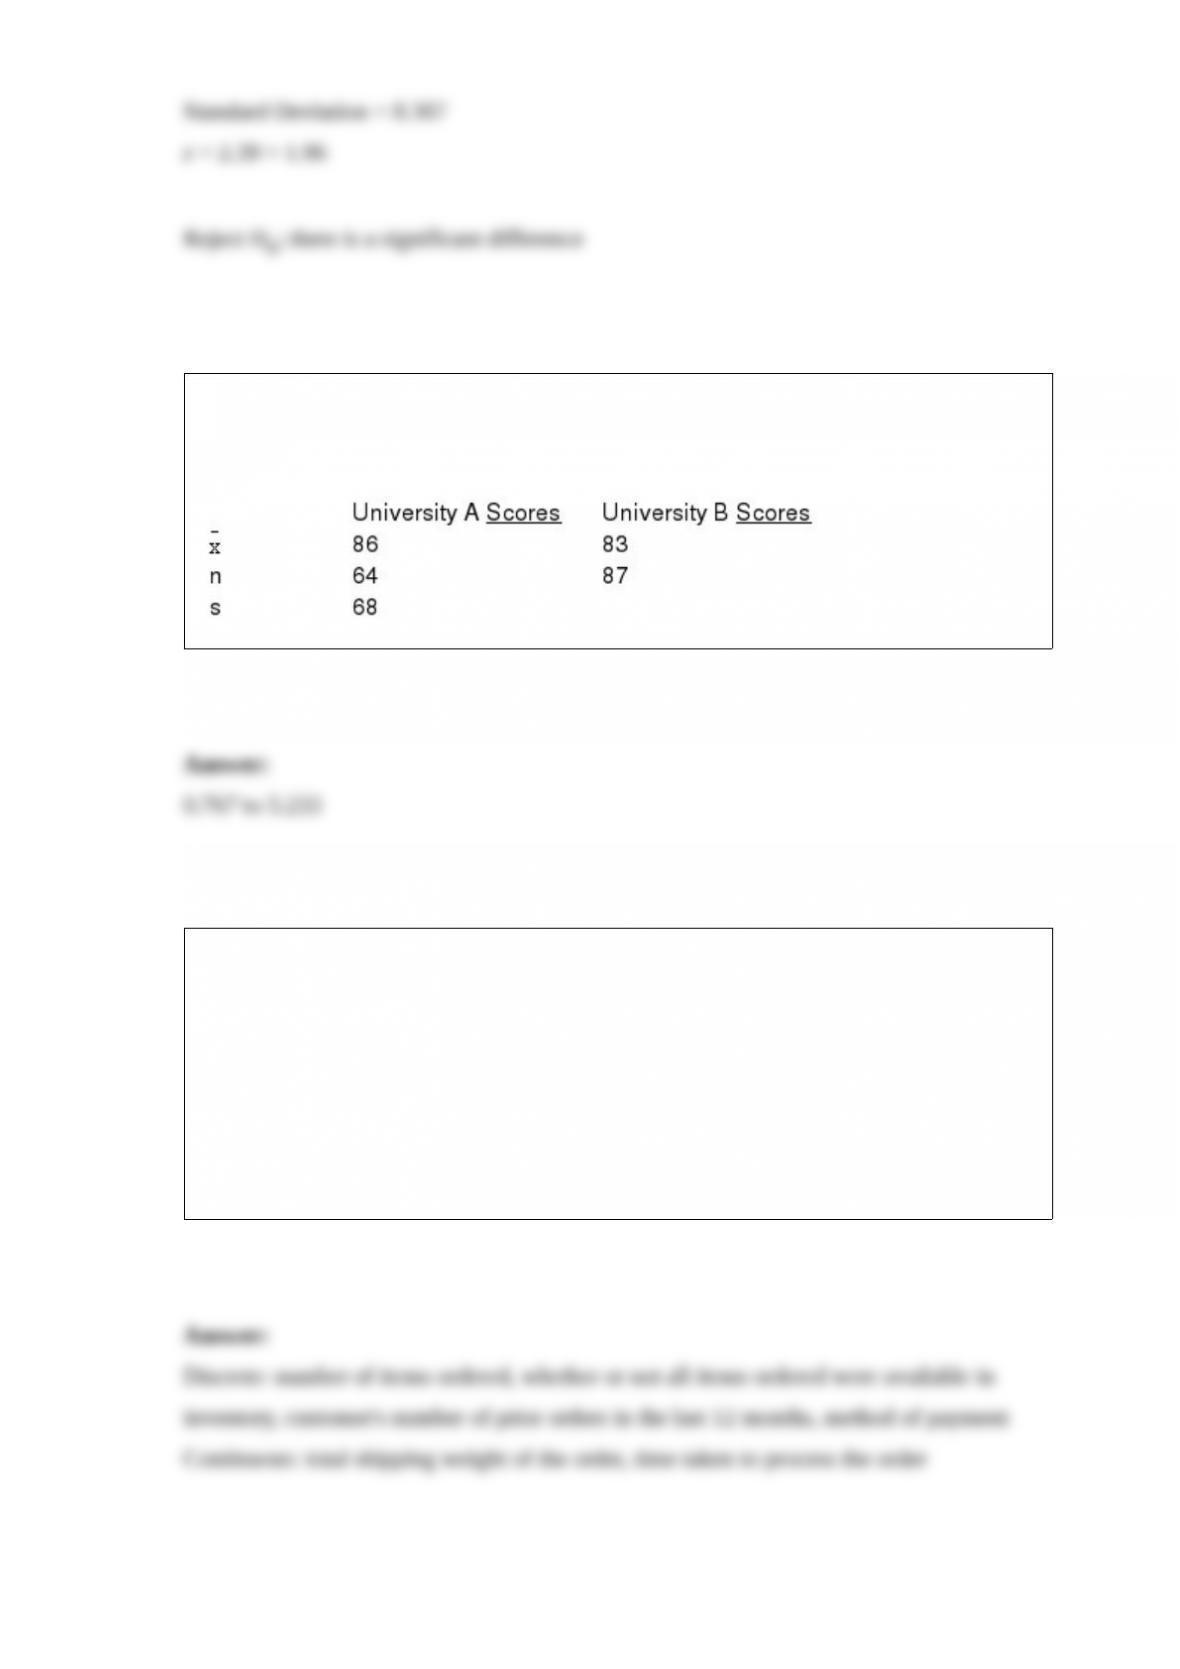
The following are the test scores of two samples of students from University A and
University B on a national statistics examination. Develop a 95% confidence interval
estimate for the difference between the mean scores of the two populations.
Waters’ Edge is a clothing retailer that promotes its products via catalog and accepts
customer orders by all of the conventional ways including the Internet. The company
has gained a competitive advantage by collecting data about its operations and the
customer each time an order is processed.
Among the data collected with each order are: number of items ordered, total shipping
weight of the order, whether or not all items ordered were available in inventory, time
taken to process the order, customer’s number of prior orders in the last 12 months, and
method of payment. For each of the six aforementioned variables, identify which of the
variables are discrete and which are continuous.
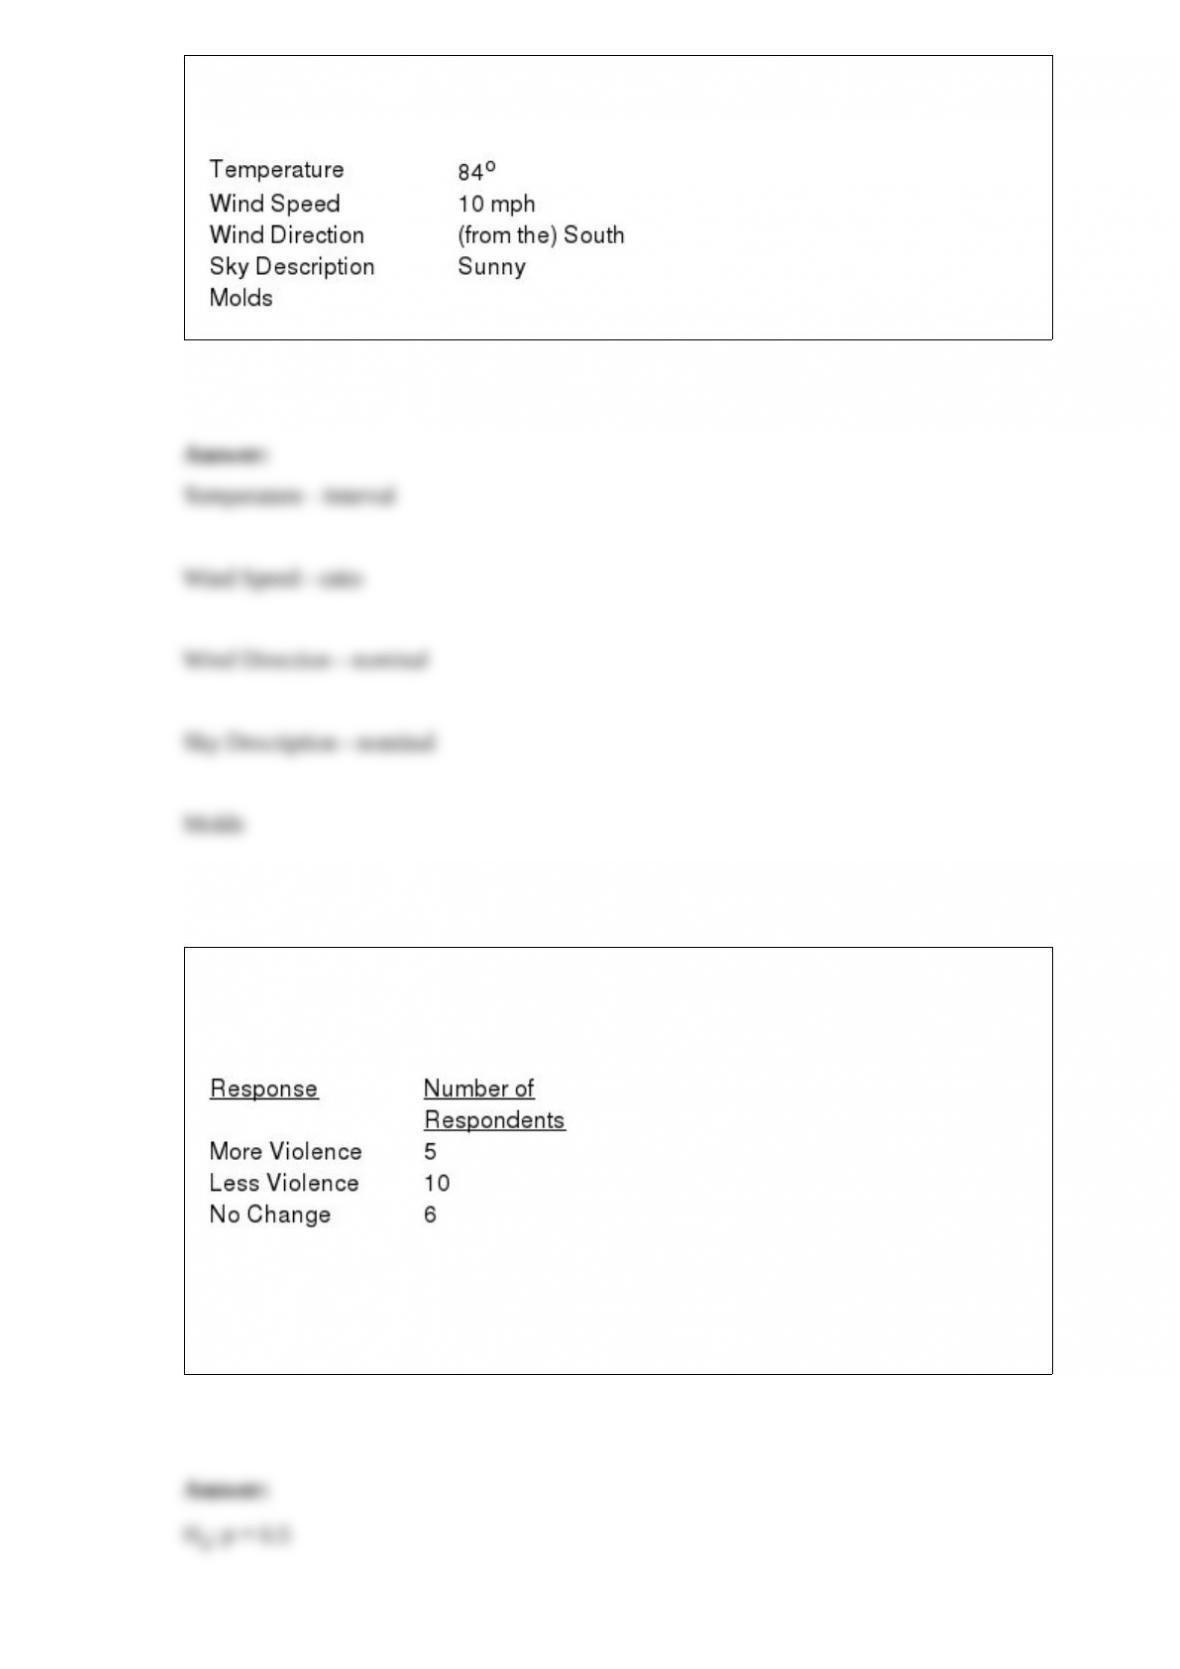
Suppose the current weather report for your area contains the following information.
Specify the measurement scale for each of the variables.
A PTA group wishes to determine whether a barrage of letters sent to the local station
has reduced the amount of violence broadcast between the hours of 4 and 9 P.M. The
results of a survey of viewers are given here.
Carry out a sign test to determine whether or not the letters were effective in reducing
the amount of violence during the 4 to 9 p.m. period. Use a .05 level of significance. Be
sure to state the null and alternative hypotheses.

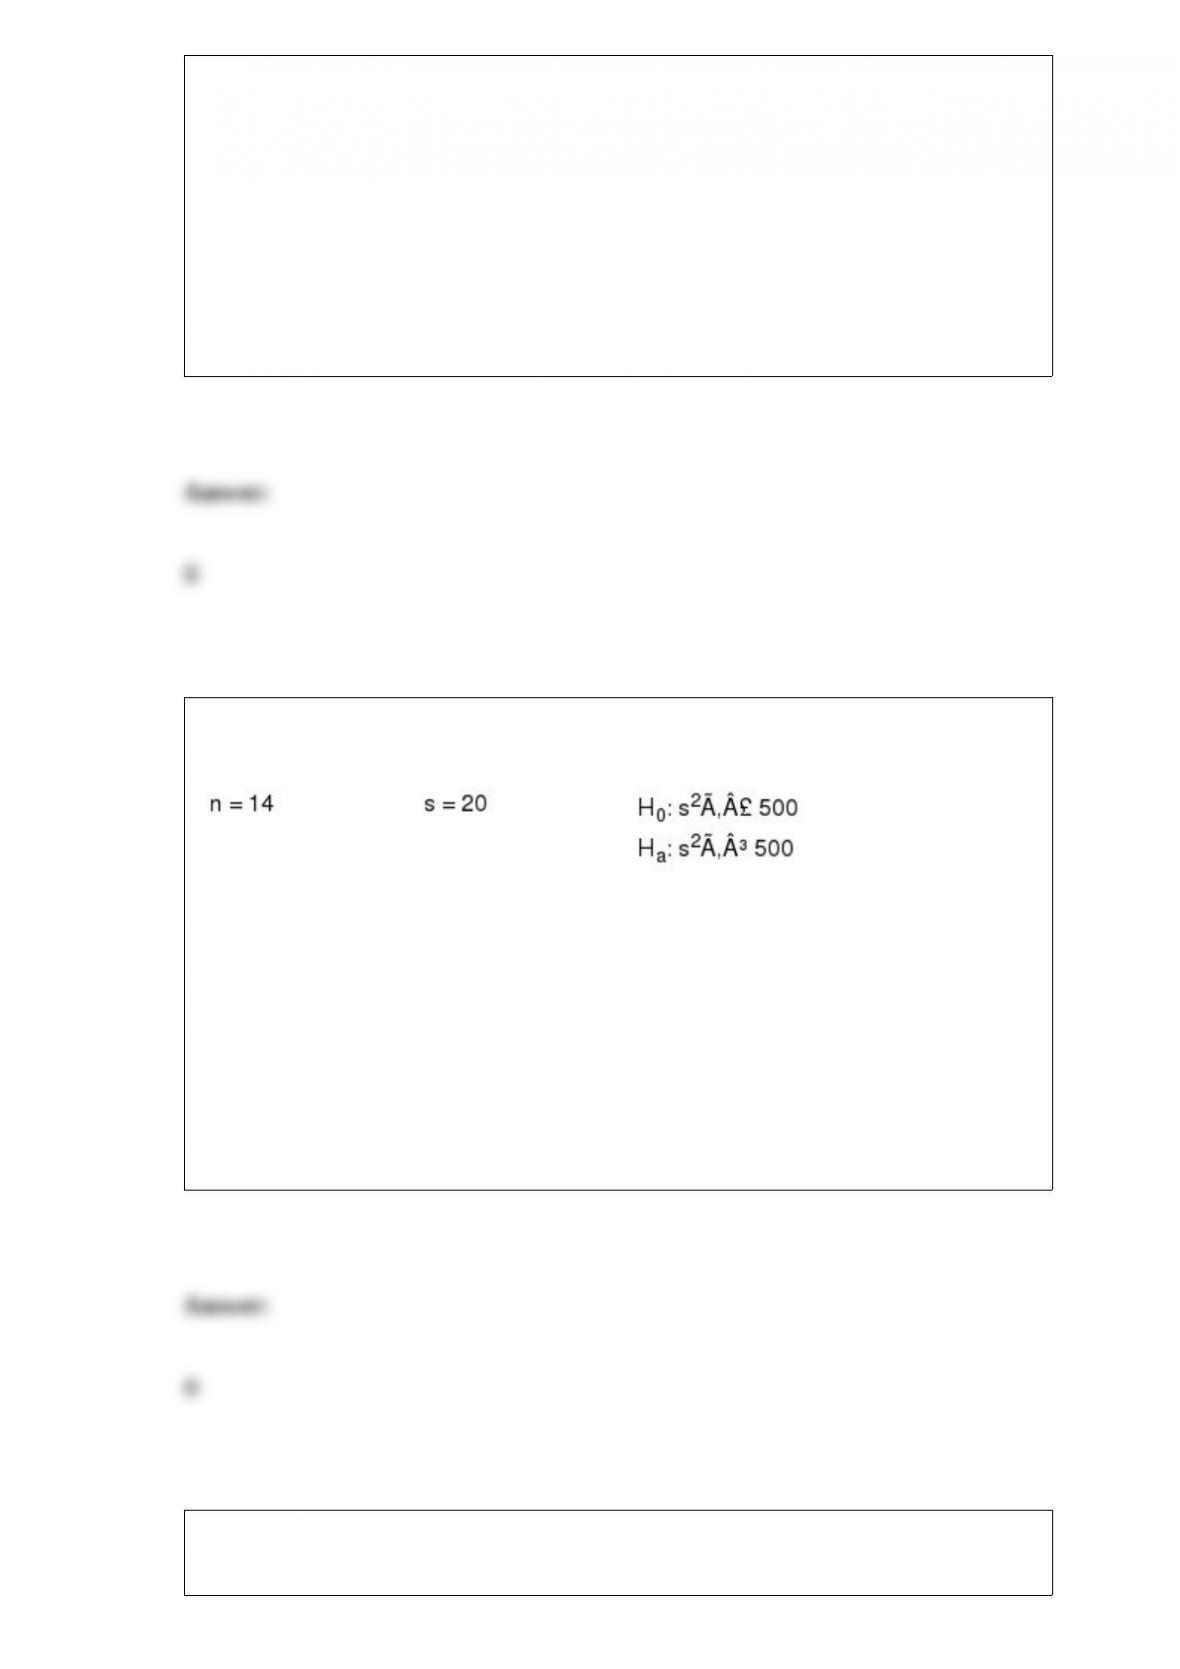
A lathe is set to cut bars of steel into lengths of 6 centimeters. The lathe is considered to
be in perfect adjustment if the average length of the bars it cuts is 6 centimeters. A
sample of 121 bars is selected randomly and measured. It is determined that the average
length of the bars in the sample is 6.08 centimeters. The population standard deviation
is 0.44 centimeters. Determine whether or not the lathe is in perfect adjustment. Use a .
05 level of significance.
The manager of Young Corporation wants to determine whether or not the type of work
schedule for her employees has any effect on their productivity. She has selected 15
production employees at random and then randomly assigned 5 employees to each of
the 3 proposed work schedules. The following table shows the units of production (per
week) under each of the work schedules.
At a 5% level of significance determine if there is a significant difference in the mean
weekly units of production for the three types of work schedules.