
The sample size that guarantees all estimates of proportions will meet the margin of
error requirements is computed using a planning value of p equal to
a. .01
b. .50
c. .51
d. .99
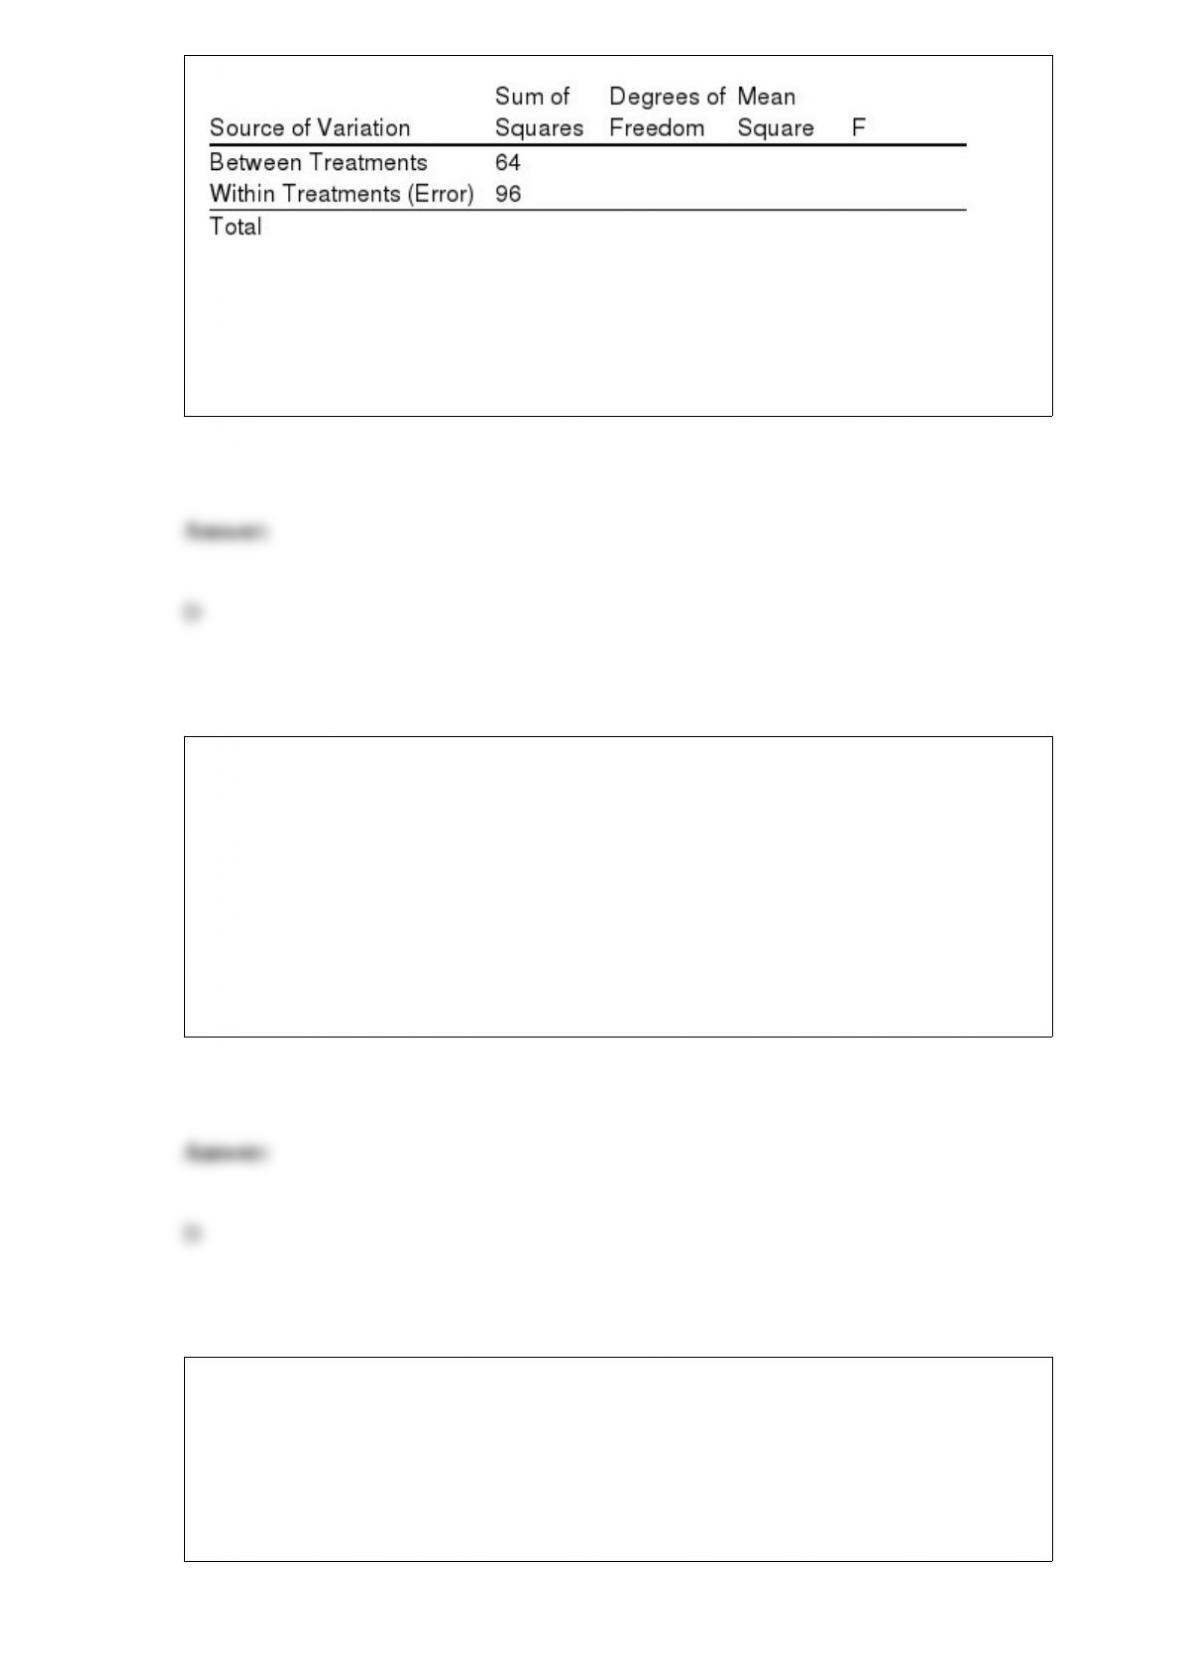
In an analysis of variance where the total sample size for the experiment is nT and the
number of populations is k, the mean square within treatments is
a. SSE/(nT – k)
b. SSTR/(nT – k)
c. SSE/(k – 1)
d. SSE/k
In order to estimate the average electric usage per month, a sample of 196 houses was
selected and the electric usage determined.
a. Assume a population standard deviation of 350 kilowatt hours. Determine the
standard error of the mean.
b. With a 0.95 probability, determine the margin of error.
c. If the sample mean is 2,000 KWH, what is the 95% confidence interval estimate of
the population mean?
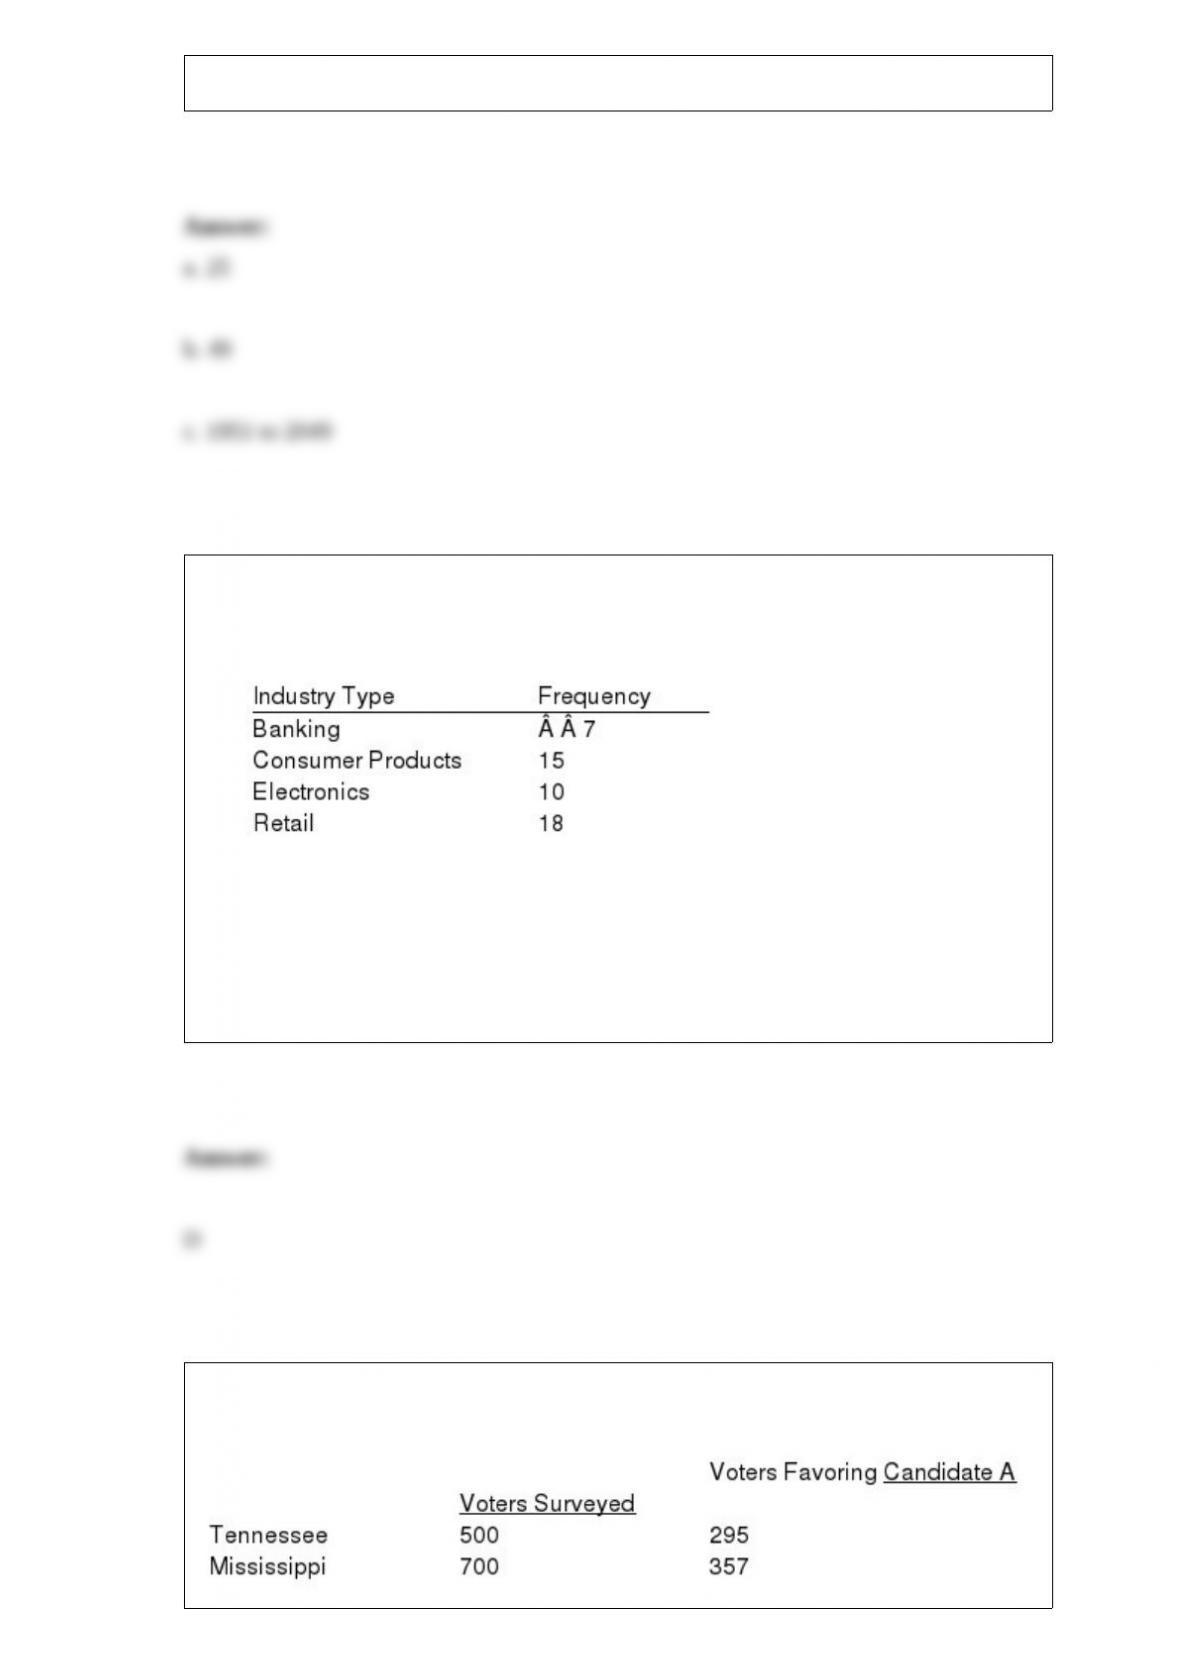
Exhibit 2-2
Information on the type of industry is provided for a sample of 50 Fortune 500
companies.
Refer to Exhibit 2-2. The relative frequency of industries that are classified as banking
is
a. 7
b. 0.07
c. 0.70
d. 0.14
During the primary elections of 2004, candidate A showed the following pre-election
voter support in Tennessee and Mississippi.
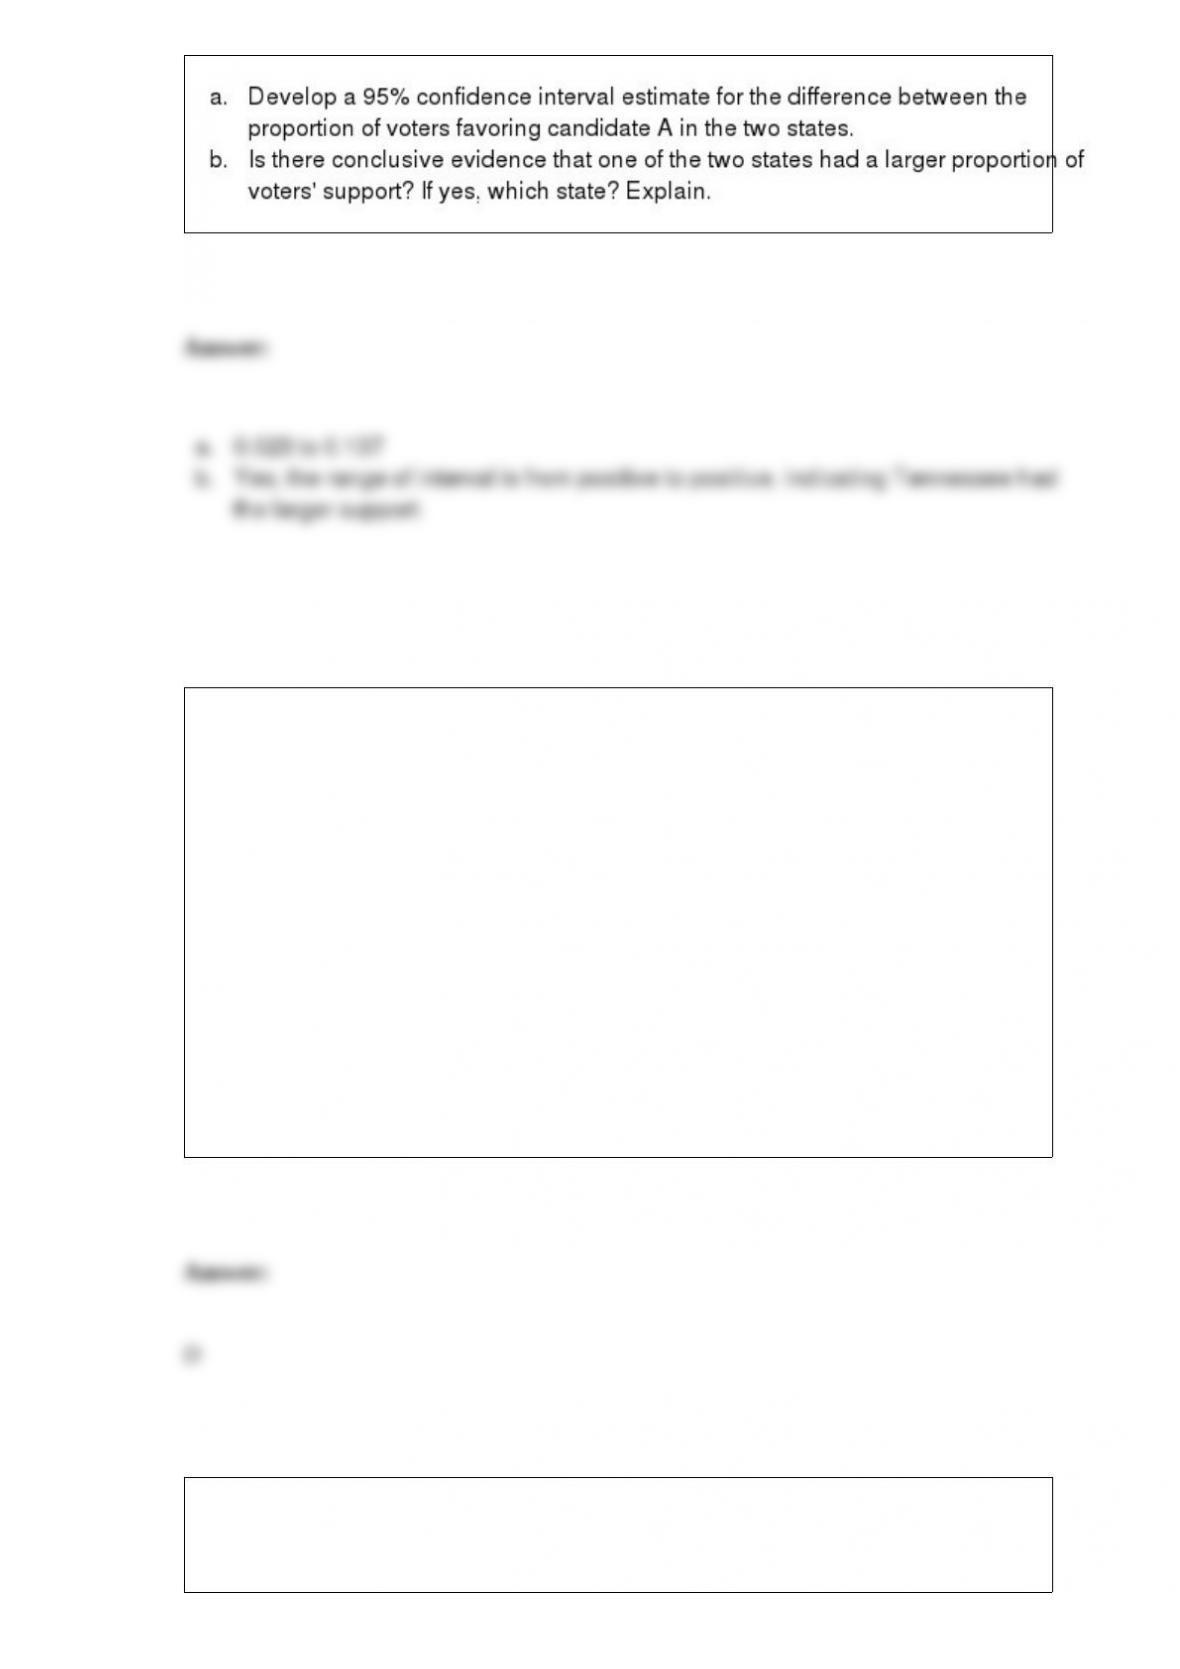
Exhibit 6-6
The life expectancy of a particular brand of tire is normally distributed with a mean of
40,000 and a standard deviation of 5,000 miles.
Refer to Exhibit 6-6. What is the probability that a randomly selected tire will have a
life of exactly 47,500 miles?
a. 0.4332
b. 0.9332
c. 0.0668
d. zero
Convenience sampling is an example of
a. probabilistic sampling

b. stratified sampling
c. a nonprobability sampling technique
d. cluster sampling
A normal probability distribution
a. is a continuous probability distribution
b. is a discrete probability distribution
c. can be either continuous or discrete
d. always has a standard deviation of 1
Excel’s Chart Tools does not have a chart type for constructing a
a. bar chart
b. pie chart
c. histogram
d. stem-and-leaf display
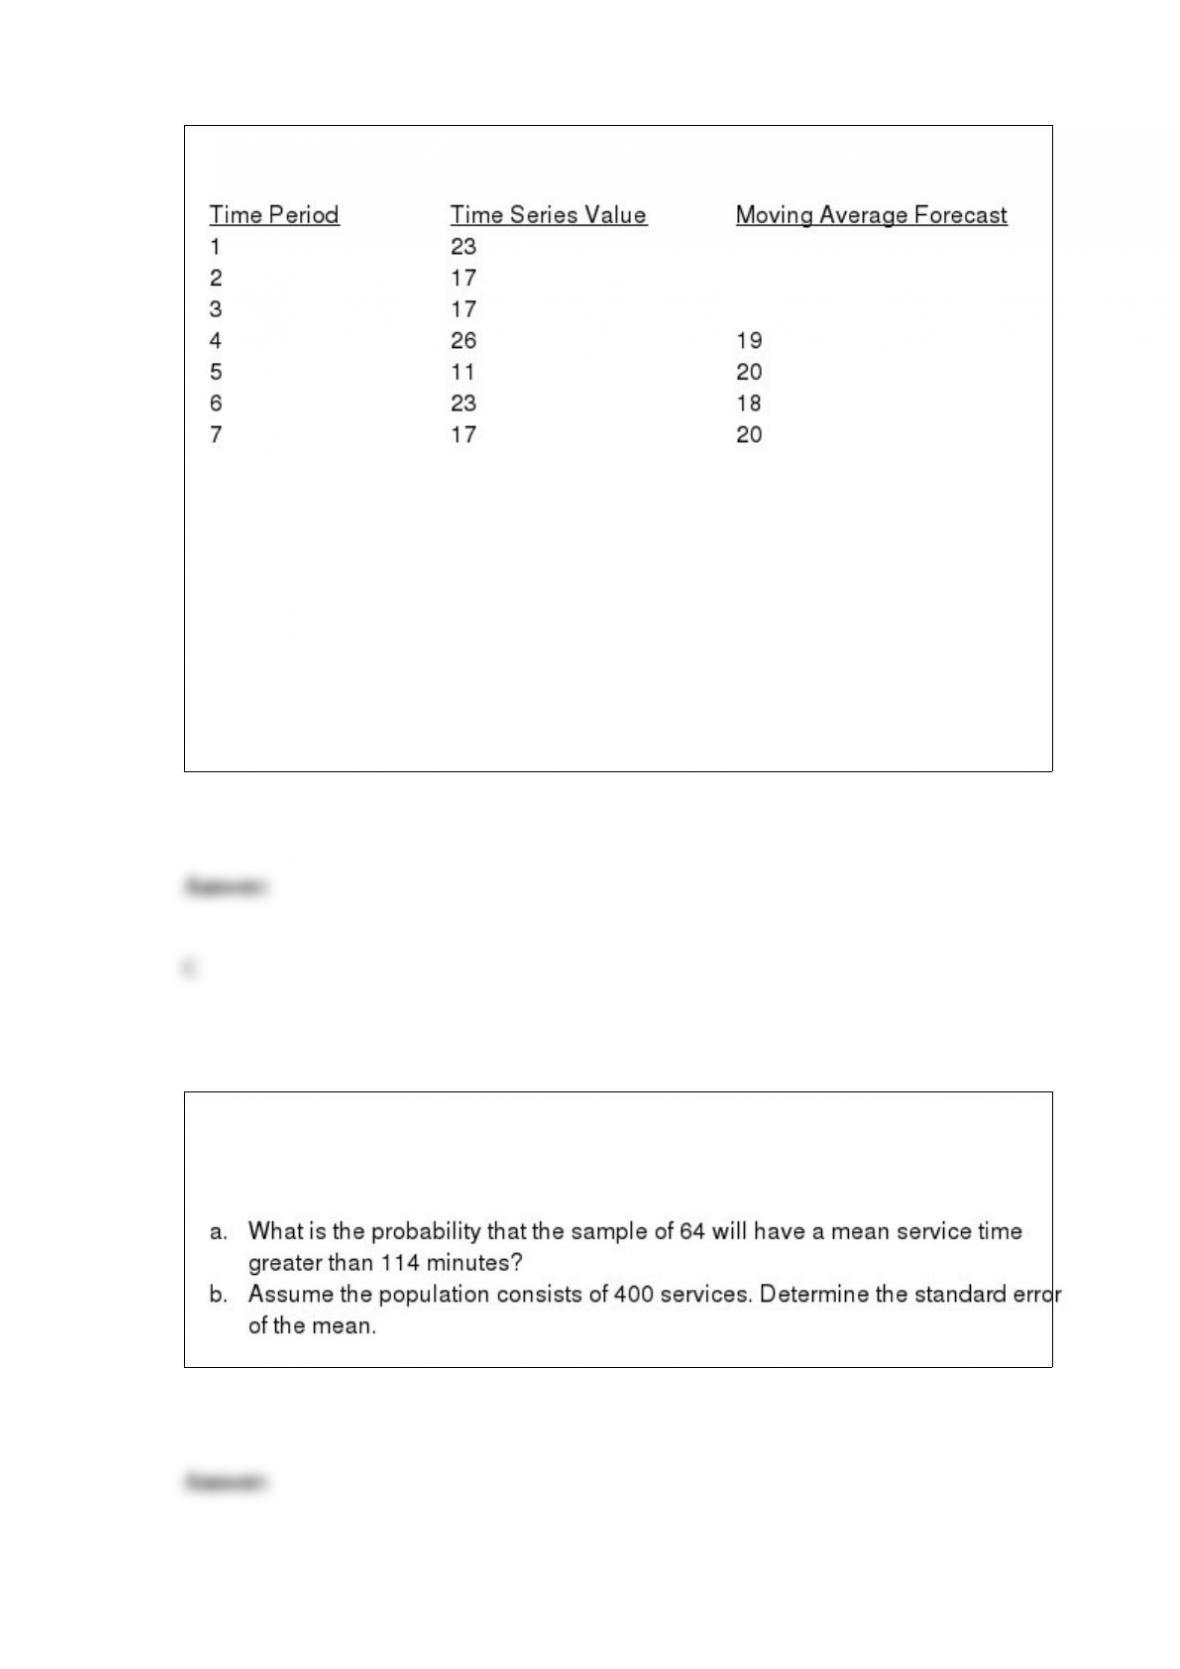
For the following time series, you are given the moving average forecast.
The mean squared error equals
a. 0
b. 6
c. 41
d. 164
An automotive repair shop has determined that the average service time on an
automobile is 2 hours with a standard deviation of 32 minutes. A random sample of 64
services is selected.
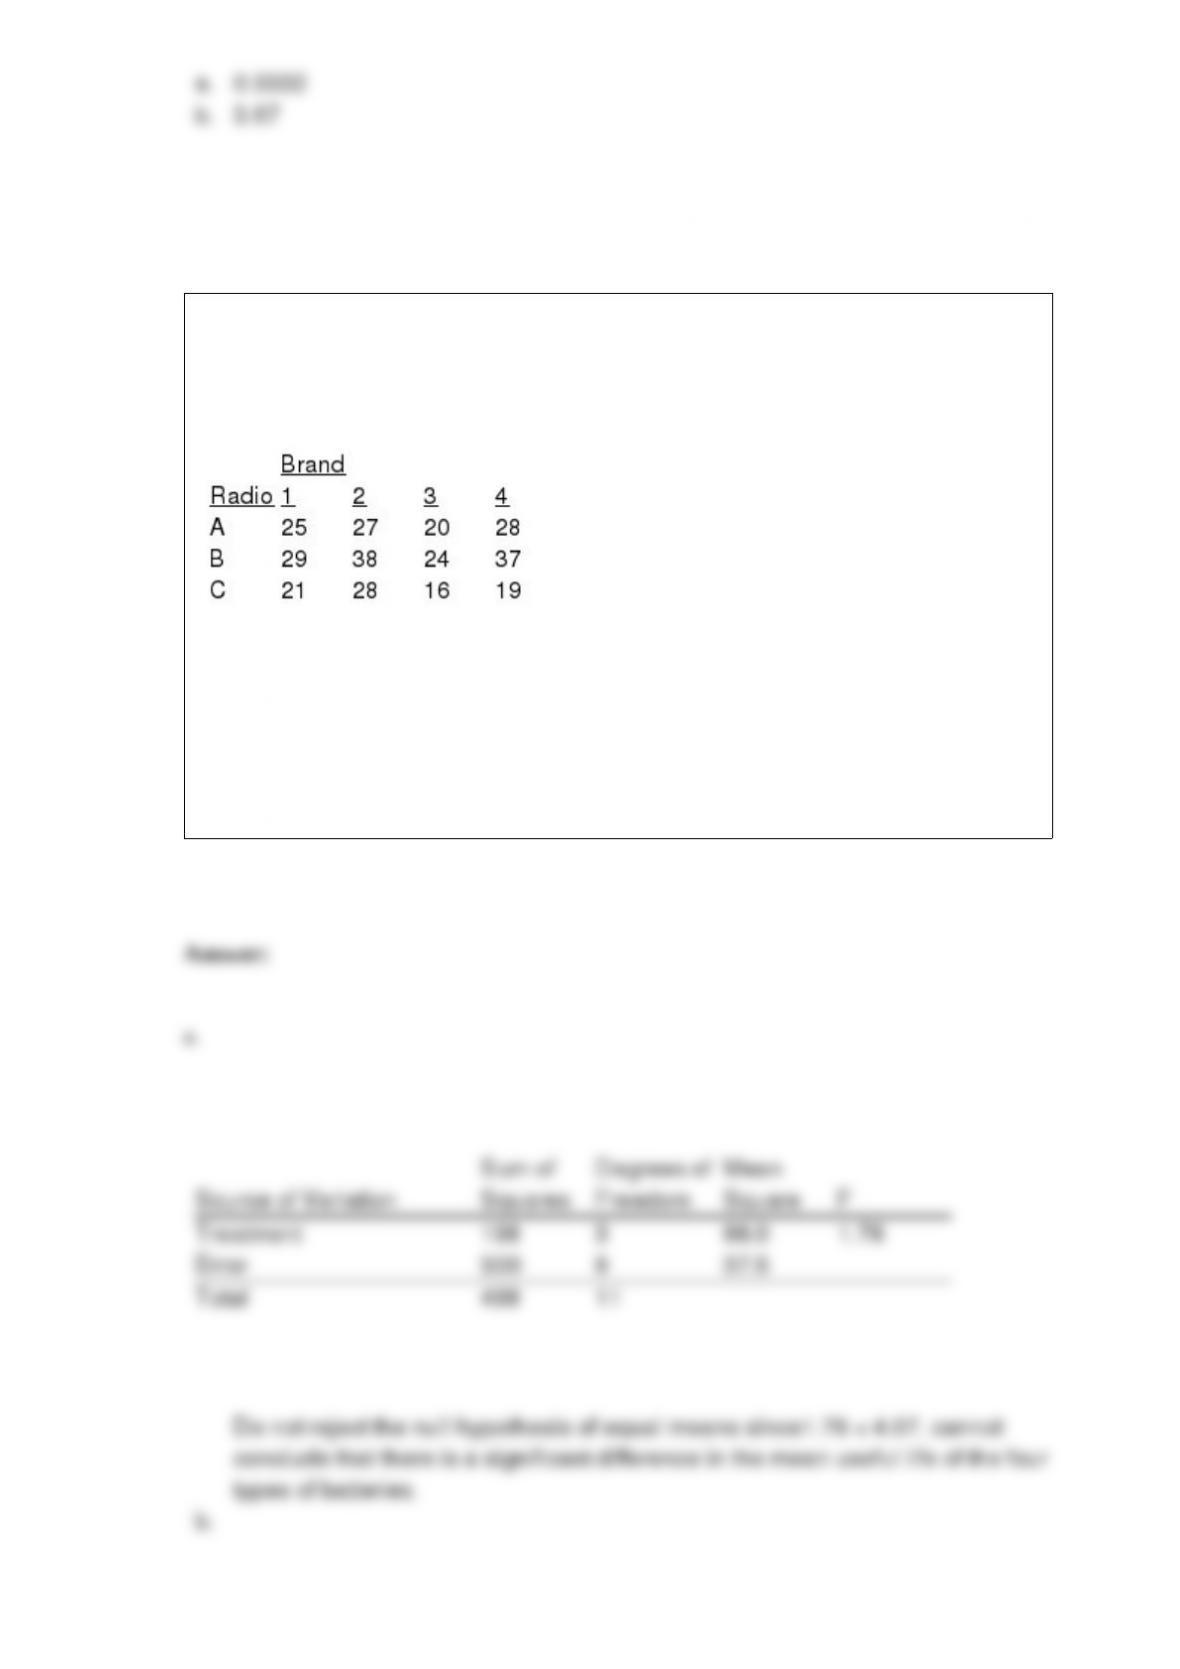
A research organization wishes to determine whether four brands of batteries for
transistor radios perform equally well. Three batteries of each type were randomly
selected and installed in the three test radios. The number of hours of use for each
battery is given below.
a. Use the analysis of variance procedure for completely randomized designs to
determine whether there is a significant difference in the mean useful life of the four
types of batteries. (Ignore the fact that there are different test radios.) Use the .05 level
of significance and be sure to construct the ANOVA table.
b. Now consider the three different test radios and carry out the analysis of variance
procedure for a randomized block design. Include the ANOVA table.
c. Compare the results in Parts a and b.
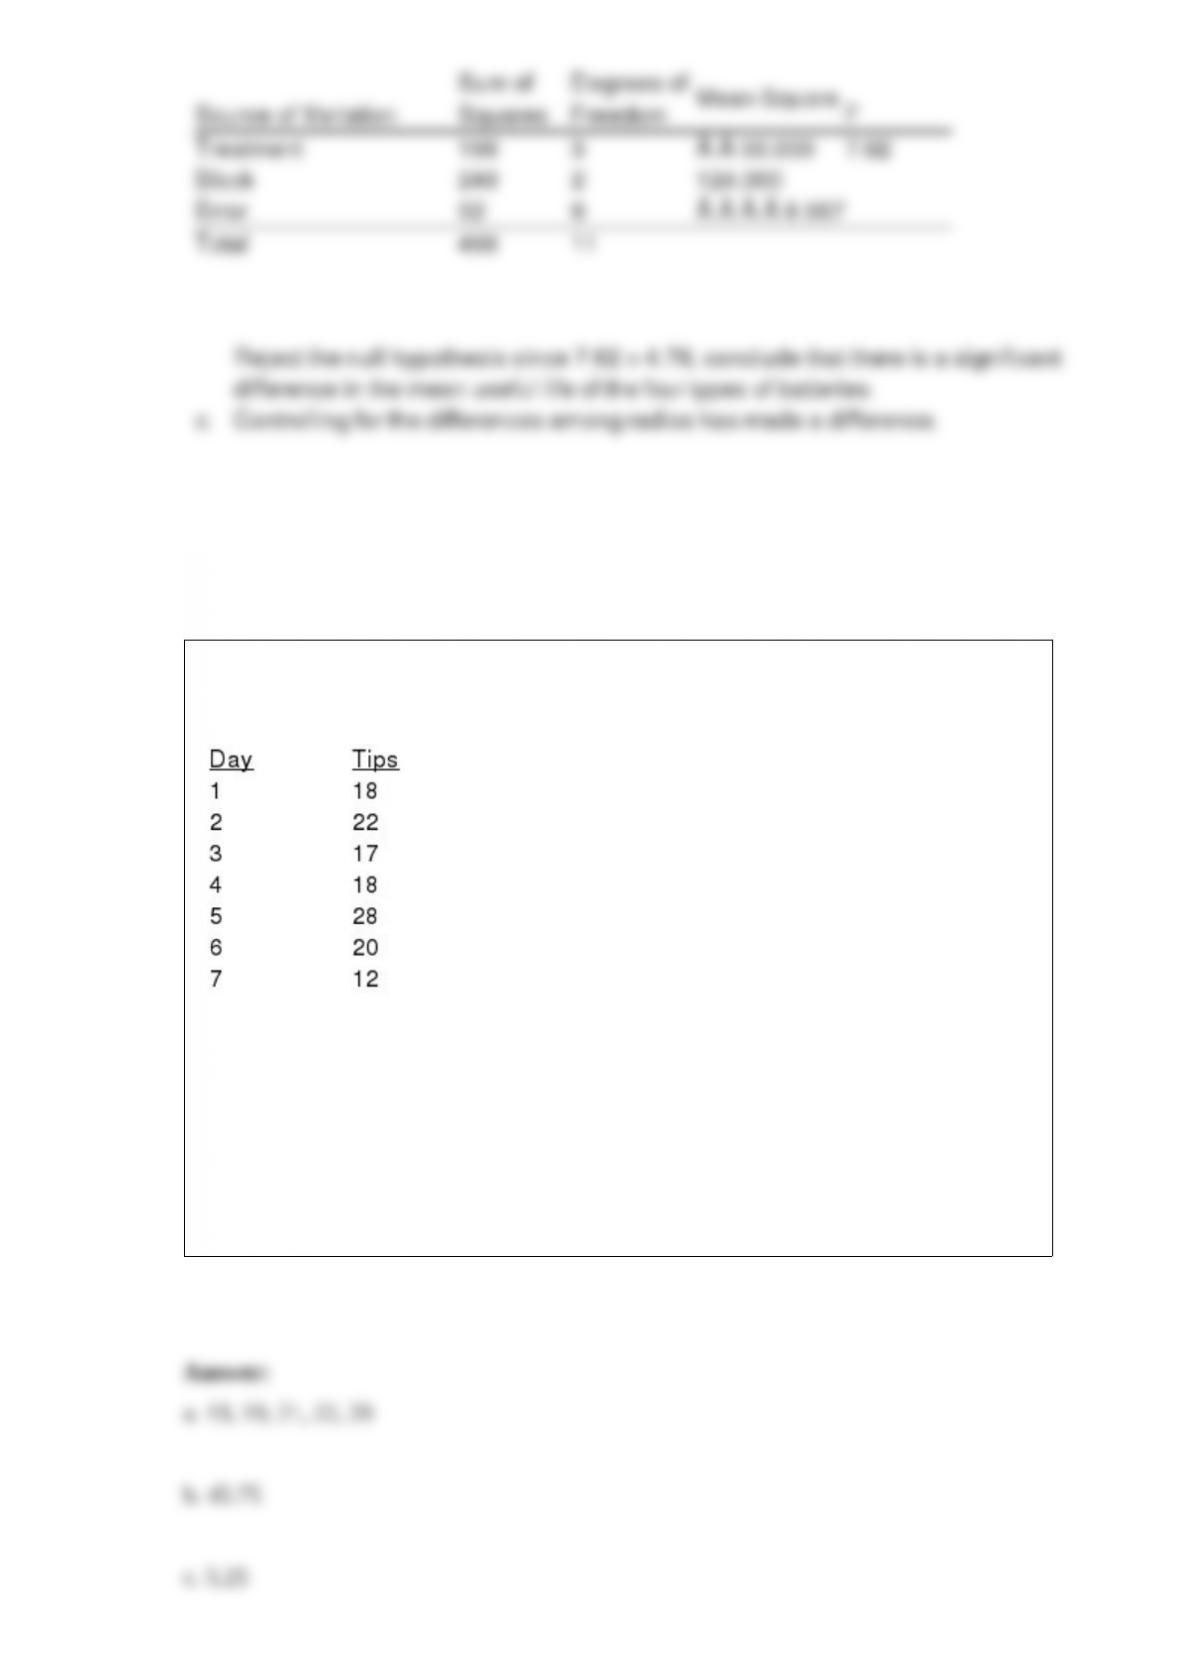
John has collected the following information on the amount of tips he has collected
from parking cars the last seven nights.
a. Compute the 3-day moving averages for the time series.
b. Compute the mean square error for the forecasts.
c. Compute the mean absolute deviation for the forecasts.
d. Forecast John’s tips for day 7.

Selecting a subset of clusters and then collecting data on all elements in those clusters is
referred to as
a. stratified cluster sampling
b. convenient cluster sampling
c. single-stage cluster sampling
d. two-stage cluster sampling
Exhibit 13-4
In a completely randomized experimental design involving five treatments, thirteen
observations were recorded for each of the five treatments. The following information
is provided.
SSTR = 200 (Sum Square Between Treatments)
SST = 800 (Total Sum Square)
Refer to Exhibit 13-4. The sum of squares within treatments (SSE) is
a. 1,000
b. 600
c. 200
d. 1,600
Four percent of the customers of a mortgage company default on their payments. A
sample of five customers is selected. What is the probability that exactly two customers
in the sample will default on their payments?
a. 0.2592
b. 0.0142
c. 0.9588
d. 0.7408
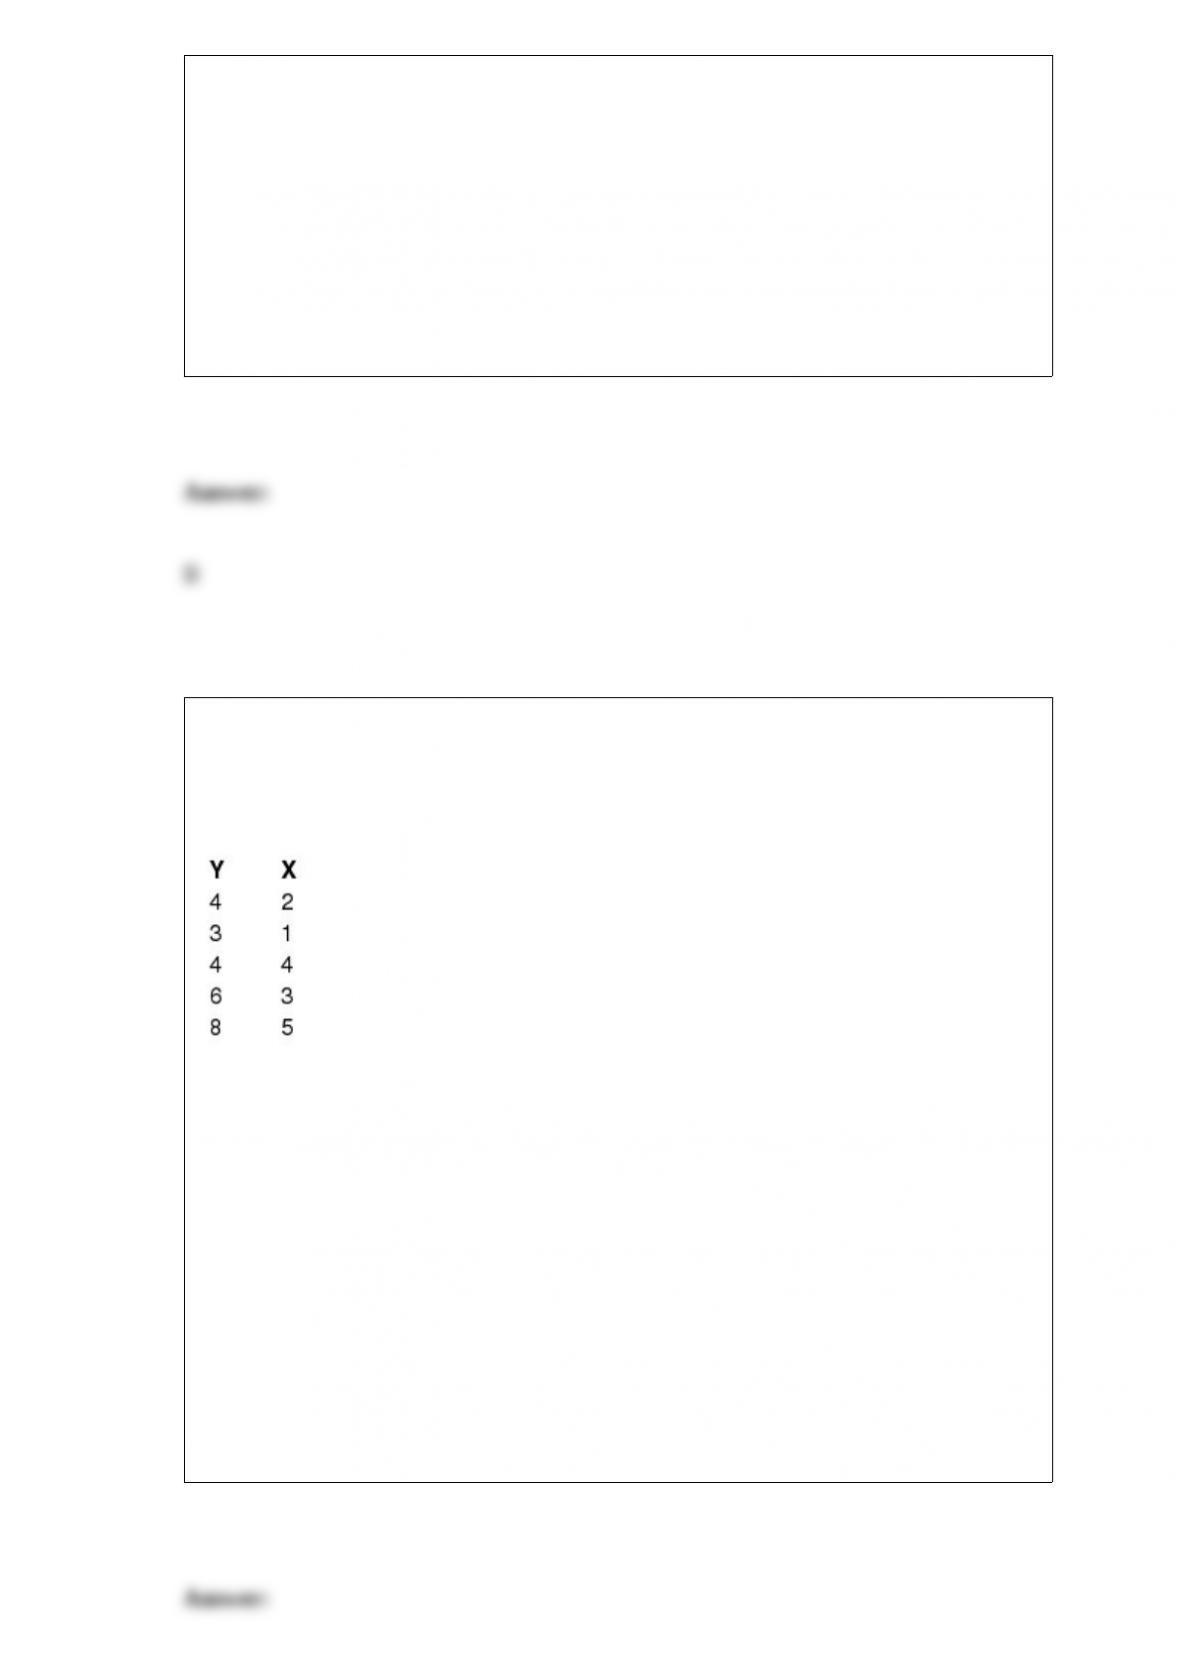
Exhibit 14-4
The following information regarding a dependent variable (Y) and an independent
variable (X) is provided.
SSE = 6
SST = 16
Refer to Exhibit 14-4. The coefficient of correlation is
a. 0.7906
b. – 0.7906
c. 0.625
d. 0.375
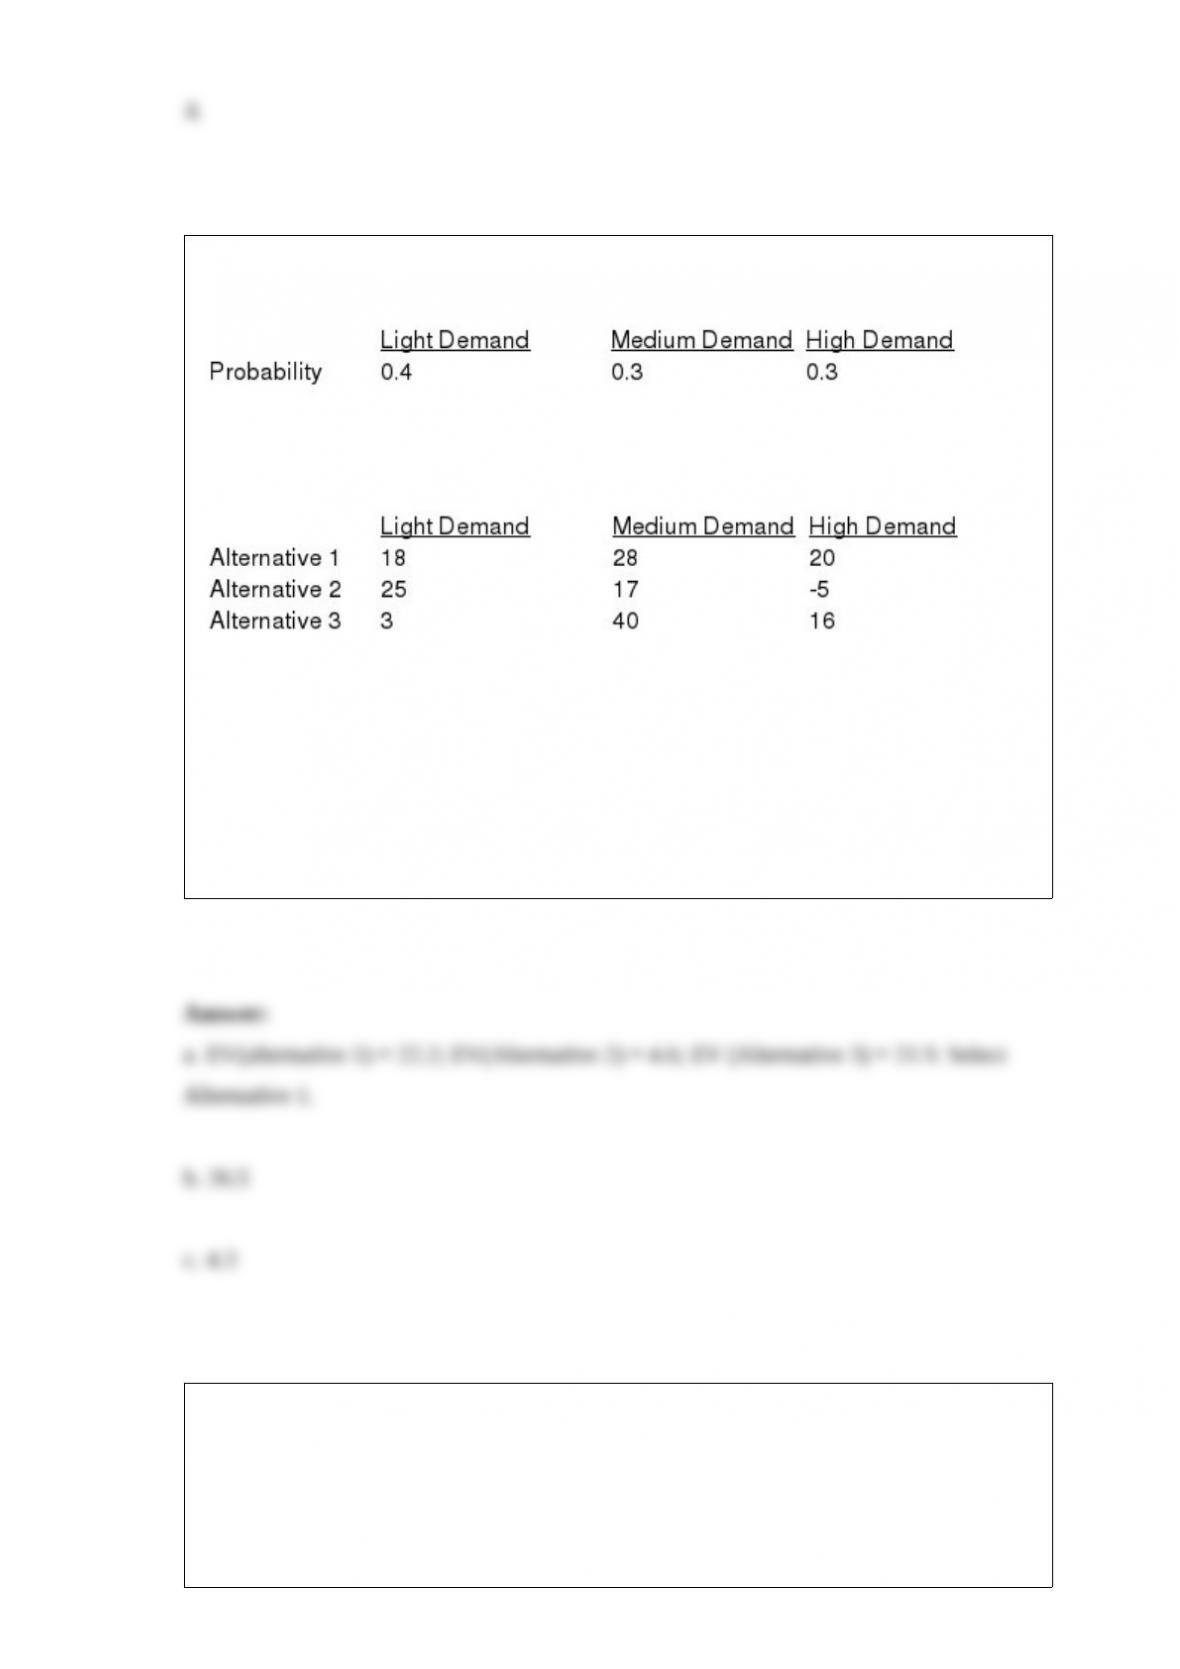
Michael, Nancy, & Associates (MNA) produce color printers. The demand for their
printers could be light, medium, or high with the following probabilities.
The company has three production alternatives for the coming period. The payoffs (in
millions of dollars) associated with the three alternatives are shown below.
a. Compute the expected value of the three alternatives. Which alternative would you
select, based on the expected values?
b. Compute the expected value with perfect information (i.e., expected value under
certainty).
c. Compute the expected value of perfect information (EVPI).
A continuous random variable may assume
a. all values in an interval or collection of intervals
b. only integer values in an interval or collection of intervals
c. only fractional values in an interval or collection of intervals
d. all the positive integer values in an interval
Fifty-five percent of the applications received for a particular credit card are accepted.
Among the next twelve applications,
a. what is the probability that all will be rejected?
b. what is the probability that all will be accepted?
c. what is the probability that exactly 4 will be accepted?
d. what is the probability that fewer than 3 will be accepted?
e. Determine the expected number and the variance of the accepted applications.
Exhibit 13-7
The following is part of an ANOVA table, which was the results of three treatments and
a total of 15 observations.
Refer to Exhibit 13-7. The mean square between treatments (MSTR) is
a. 36
b. 16
c. 8
d. 32
A measure of the strength of the relationship between two variables is the
a. coefficient of determination
b. slope b1 of the estimated regression line
c. standard error of the estimate
d. correlation coefficient
Methods that use simple arithmetic and easy-to-draw graphs to summarize data quickly
are called
a. exploratory data analysis
b. relative frequency distributions
c. bar charts
d. pie charts

The t value with a 95% confidence and 24 degrees of freedom is
a. 1.711
b. 2.064
c. 2.492
d. 2.069
Exhibit 6-4
The starting salaries of individuals with an MBA degree are normally distributed with a
mean of $40,000 and a standard deviation of $5,000.
Refer to Exhibit 6-4. What is the random variable in this experiment?
a. the starting salaries
b. the normal distribution
c. $40,000
d. $5,000