The chi-square values (for interval estimation) for a sample size of 10 at 95%
confidence are
a. 3.32511 and 16.9190
b. 2.70039 and 19.0228
c. 4.16816 and 14.6837
d. 3.24697 and 20.4831
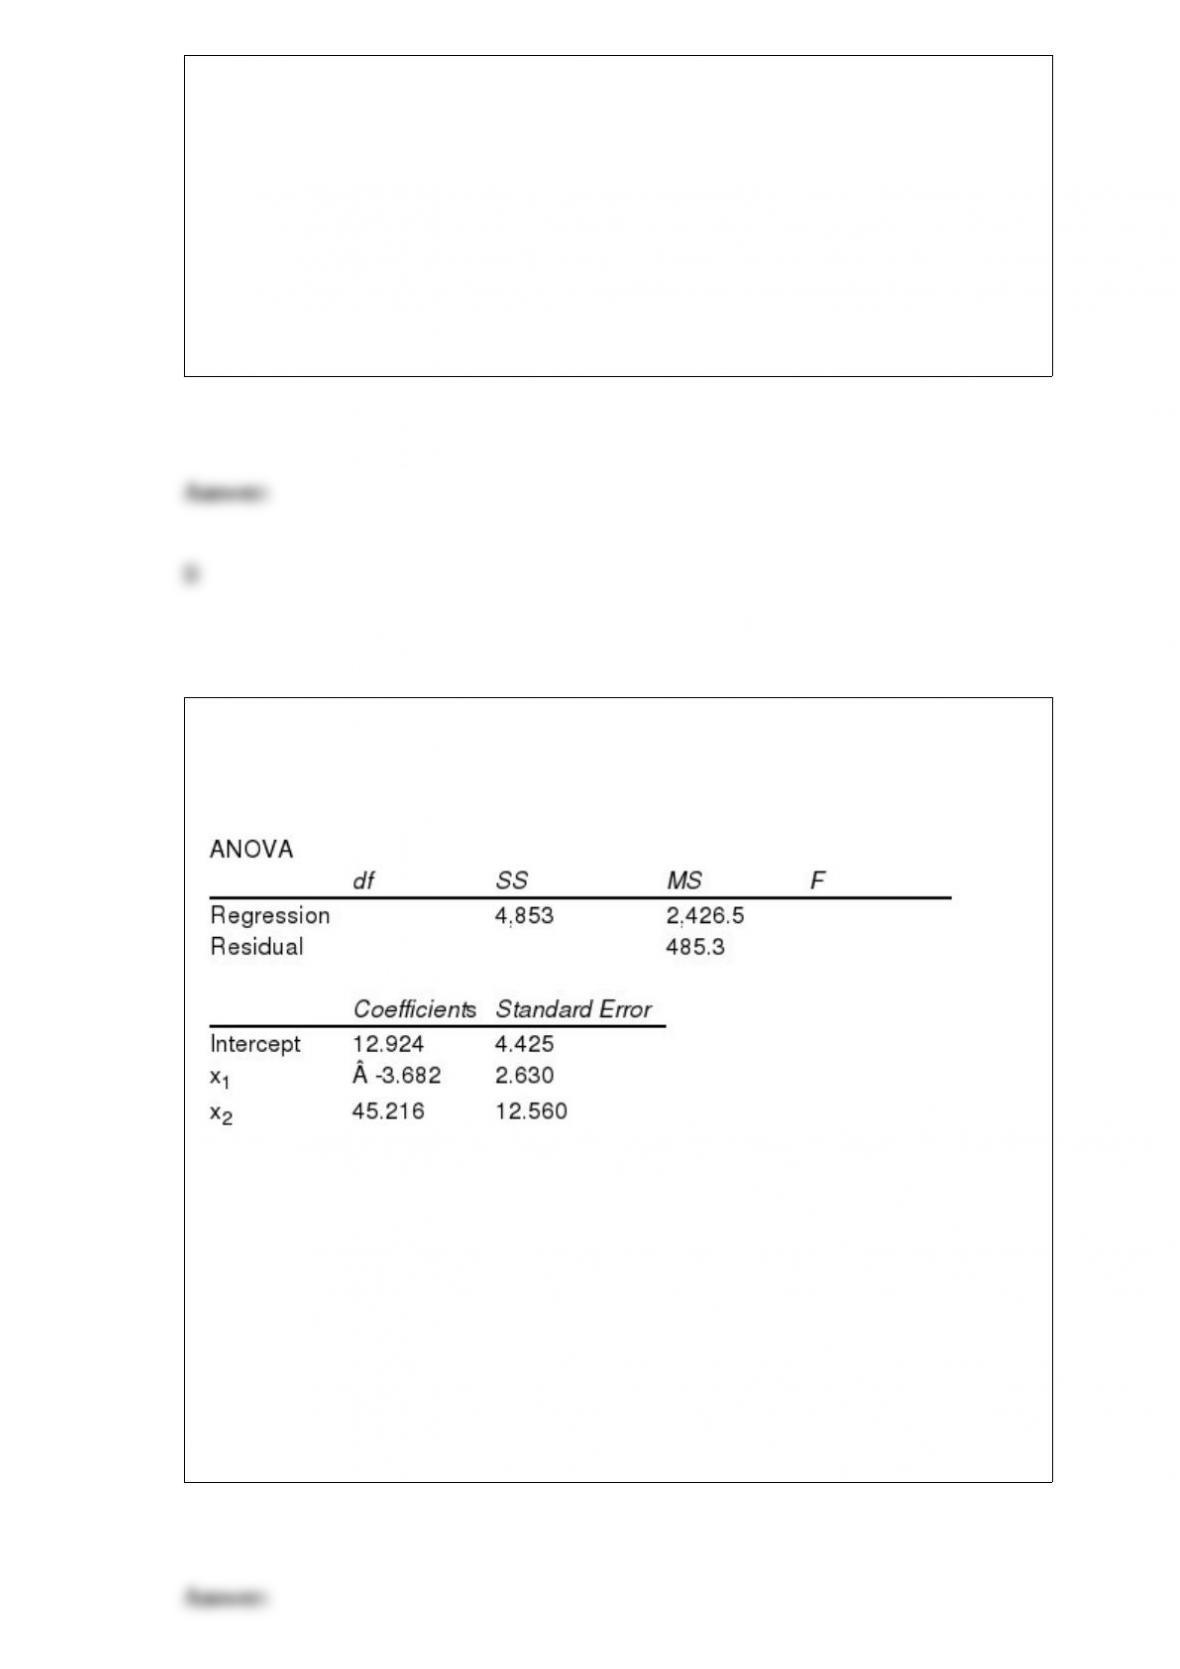
Exhibit 15-6
Below you are given a partial Excel output based on a sample of 16 observations.
Refer to Exhibit 15-6. The t value obtained from the table which is used to test an
individual parameter at the 1% level is
a. 2.65
b. 2.921
c. 2.977
d. 3.012
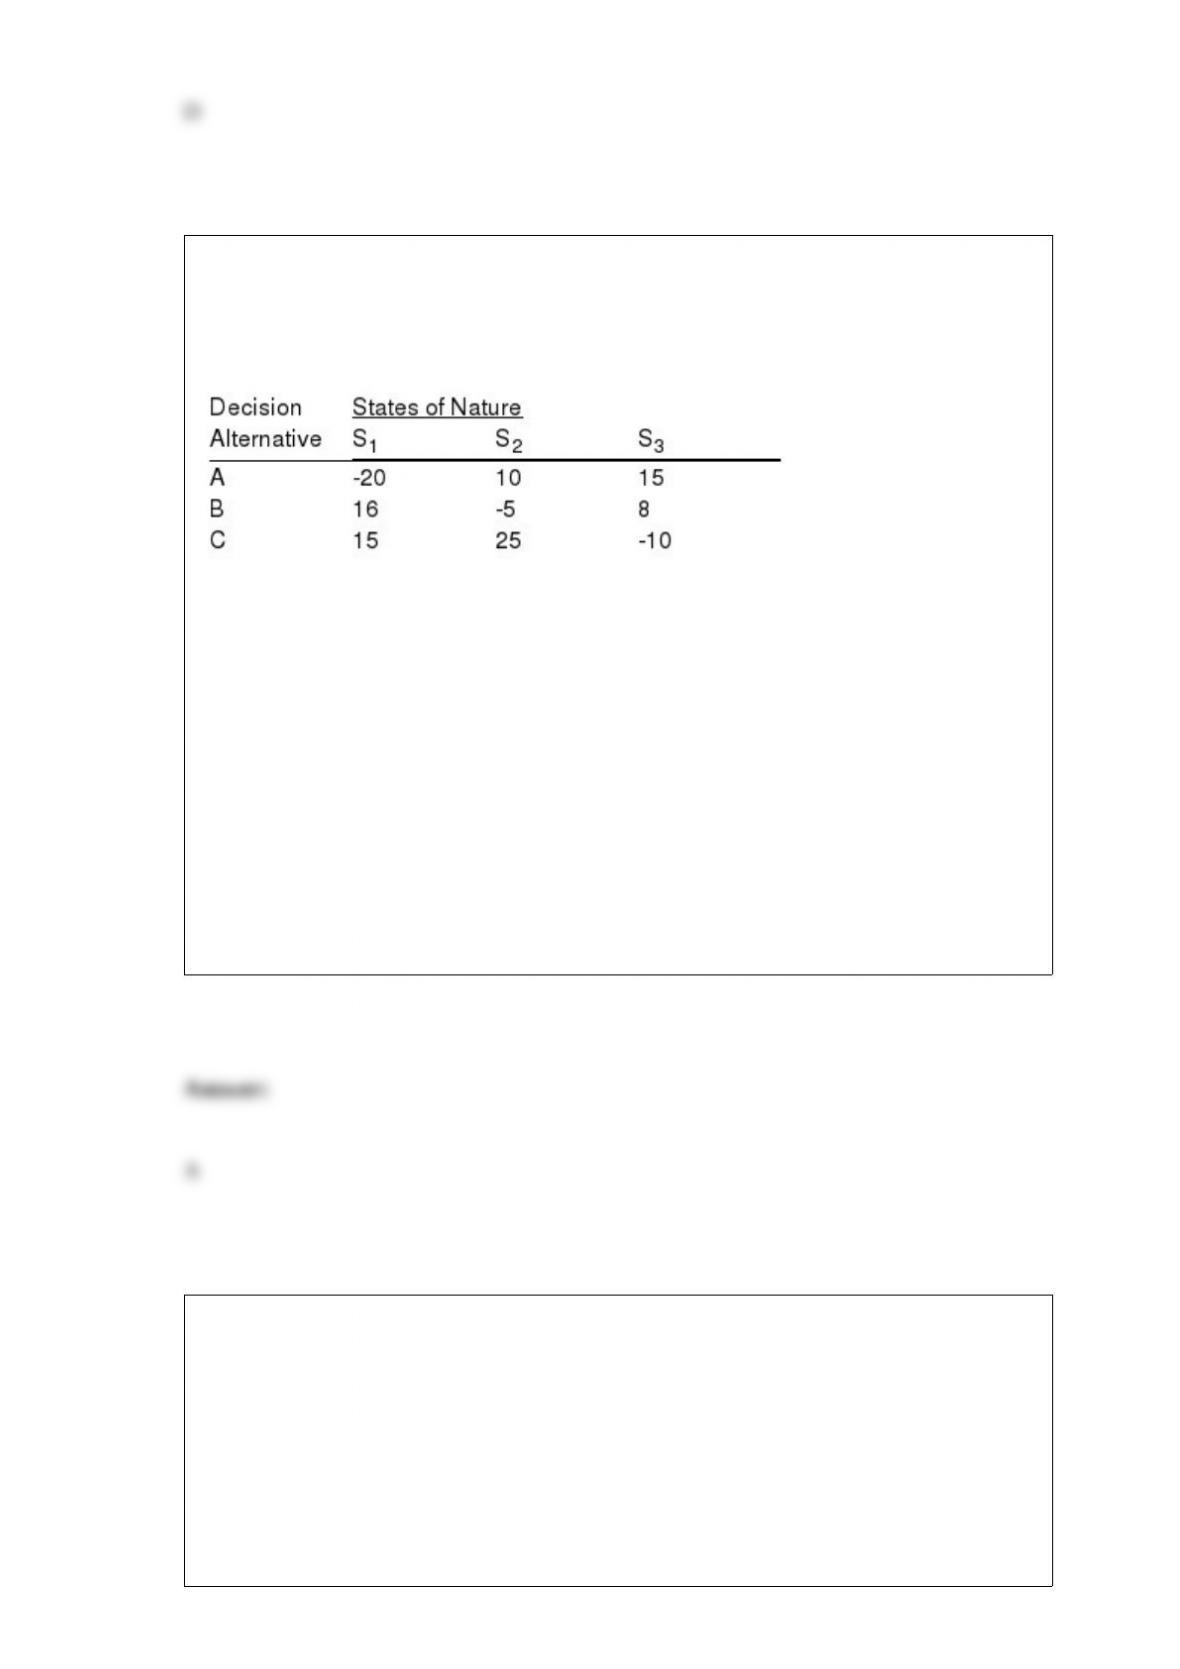
Exhibit 20-5
Below you are given a payoff table involving three states of nature and three decision
alternatives.
The probability of occurrence of S1 is 0.2 and the probability of occurrence of S2 is 0.3.
Refer to Exhibit 20-5. The recommended decision alternative based on the expected
value is
a. A
b. B
c. C
d. All of the answers are correct.
To avoid the problem of not having access to tables of the F distribution with values
given for the lower tail when a two-tailed test is required, let the smaller sample
variance be
a. the denominator of the test statistic
b. the numerator of the test statistic
c. at least one

d. None of these alternatives is correct.
Exhibit 15-3
In a regression model involving 30 observations, the following estimated regression
equation was obtained:
= 17 + 4x1 – 3x2 + 8x3 + 8x4
For this model SSR = 700 and SSE = 100.
Refer to Exhibit 15-3. The coefficient of determination for the above model is
approximately
a. -0.875
b. 0.875
c. 0.125
d. 0.144
Excel’s ____ function can be used to conduct the Kruskal-Wallis test.
a. POISSON.DIST
b. BINOM.DIST
c. CHISQ.DIST.RT
d. NORM.S.DIST
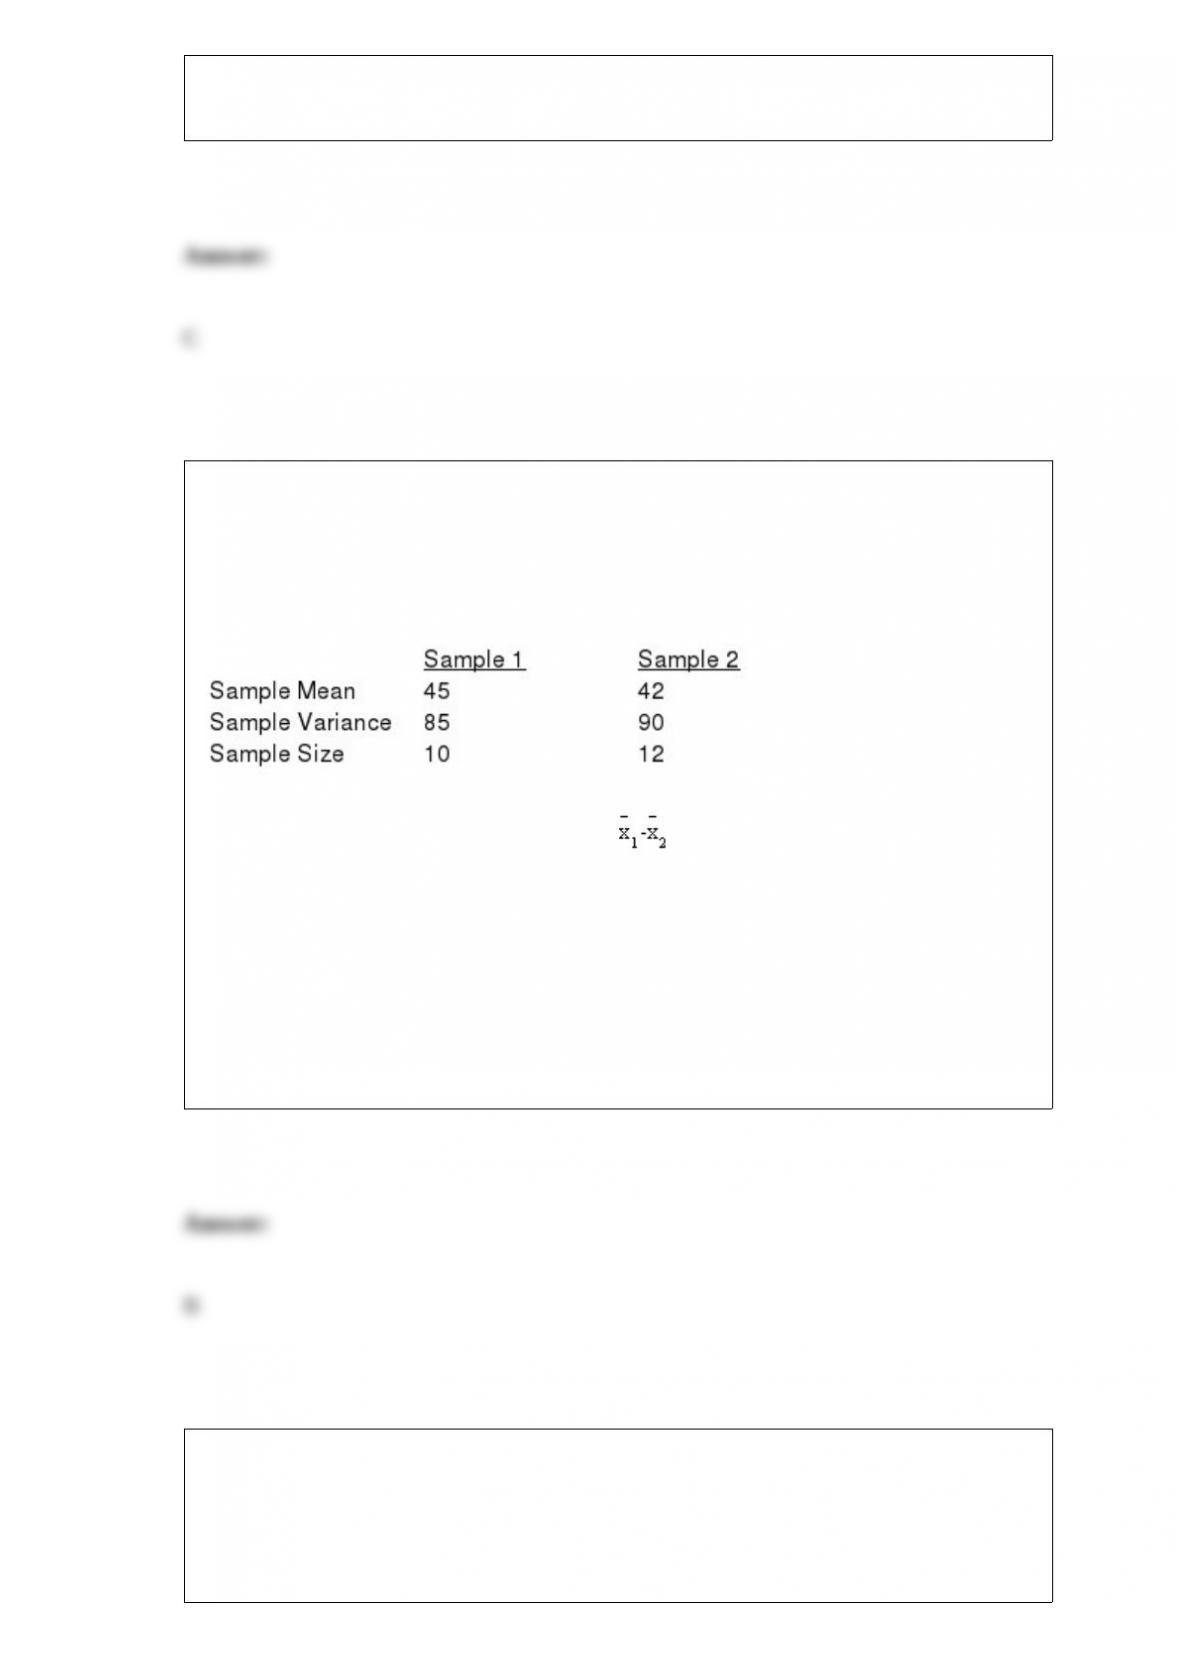
Exhibit 10-4
The following information was obtained from independent random samples.
Assume normally distributed populations with equal variances.
Refer to Exhibit 10-4. The standard error of is
a. 3.0
b. 4.0
c. 8.372
d. 19.48
A finite population correction factor is needed in computing the standard deviation of
the sampling distribution of sample means
a. whenever the population is infinite

b. whenever the sample size is more than 5% of the population size
c. whenever the sample size is less than 5% of the population size
d. The correction factor is not necessary if the population has a normal distribution
Given that z is a standard normal random variable, what is the value of z if the area to
the left of z is 0.9382?
a. 1.8
b. 1.54
c. 2.1
d. 1.77
An experimental design that permits statistical conclusions about two or more factors is
a
a. randomized block design
b. factorial design
c. completely randomized design
d. randomized design

Consider the following data.
Use Excel’s Regression Tool to estimate a second-order model of the form

A sample of n observations is taken from a population. When performing statistical
inference about a population variance, the appropriate chi-square distribution has
a. n degrees of freedom
b. n – 1 degrees of freedom
c. n – 2 degrees of freedom
d. n – 3 degrees of freedom
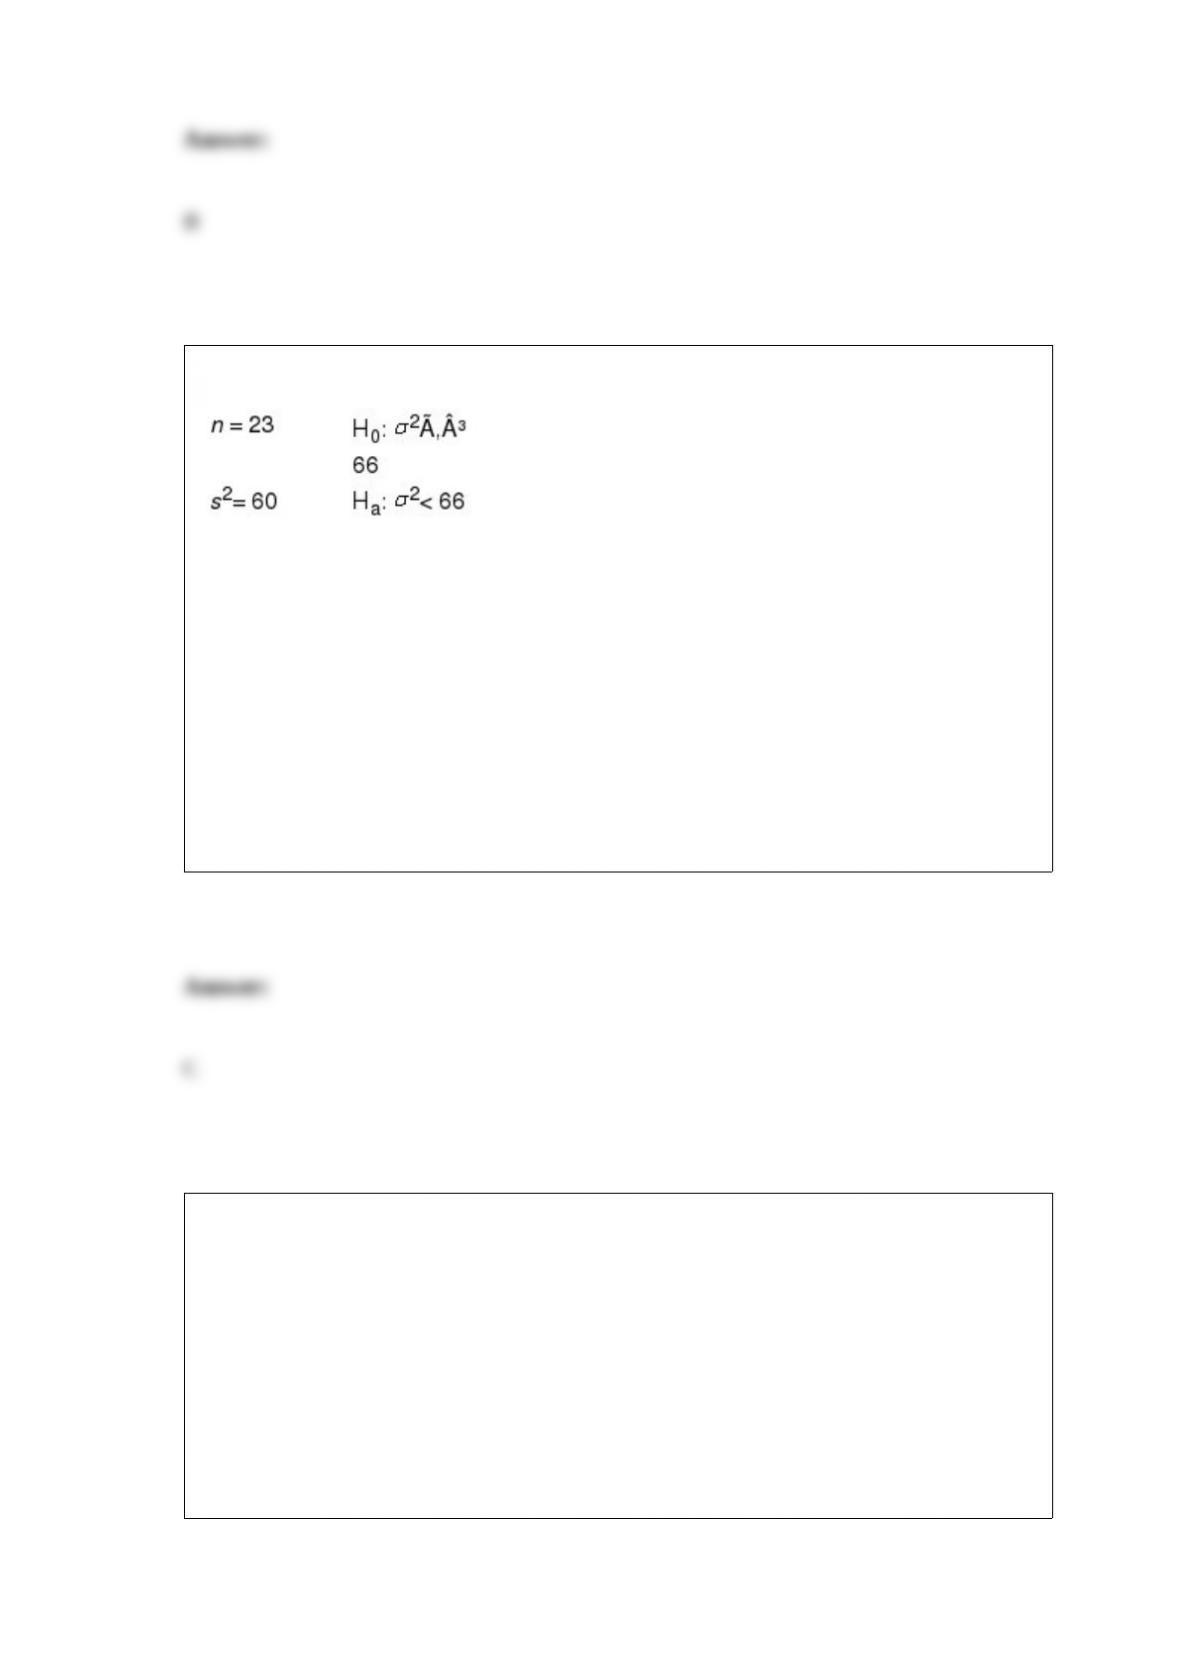
Exhibit 11-8
Refer to Exhibit 11-8. If the test is to be performed at 95% confidence, the critical
value(s) from the table is(are)
a. 10.9823 and 36.7897
b. 33.9244
c. 12.3380
d. 43.7729
A 95% confidence interval for a population mean is determined to be 100 to 120. If the
confidence coefficient is reduced to 0.90, the interval for
a. becomes narrower
b. becomes wider
c. does not change
d. becomes 0.1

The joint effect of two variables acting together is called
a. autocorrelation
b. interaction
c. serial correlation
d. joint regression
Exhibit 6-6
The life expectancy of a particular brand of tire is normally distributed with a mean of
40,000 and a standard deviation of 5,000 miles.
Refer to Exhibit 6-6. What is the random variable in this experiment?
a. the life expectancy of this brand of tire
b. the normal distribution
c. 40,000 miles
d. None of the alternative answers is correct.
Flight time from Cincinnati to Atlanta is an example of a _______ variable and

_______ measurement.
a. discrete, interval
b. discrete, ratio
c. continuous, interval
d. continuous, ratio
Two events are mutually exclusive if
a. the probability of their intersection is 1
b. they have no sample points in common
c. the probability of their intersection is 0.5
d. the probability of their intersection is 1 and they have no sample points in common
Exhibit 2-3
The number of sick days taken (per month) by 200 factory workers is summarized
below.

Refer to Exhibit 2-3. The cumulative frequency for the class of 11 15
a. is 200
b. is 14
c. is 199
d. is 1
Consider a population of five families with the following data representing the number
of pets in each family.
a. There are ten possible samples of size 2 (sampling without replacement). List the 10
possible samples of size 2, and determine the mean of each sample.
b. Determine the mean and the variance of the population.
c. Using the ten sample mean values, compute the mean and the standard error of the
mean.

The time series pattern showing an alternating sequence of points below and above the
trend line lasting more than one year is the
a. trend pattern
b. seasonal pattern
c. trend and seasonal pattern
d. cyclical pattern
Statistical methods that generally require very few, if any, assumptions about the
population distribution are known as
a. parametric

b. nonparametric
c. free methods
d. None of these alternatives is correct.