
A control chart that is used to monitor the range of the measurements in a sample is
a. a p chart
b. an x-bar chart
c. an R chart
d. an np chart
The sample result plotted on an np control chart is
a. np
b. np
c. the number of perfect units in the sample
d. the number of defective units in the sample
A sample of 20 cans of tomato juice showed a standard deviation of 0.4 ounces. A 95%
confidence interval estimate of the variance for the population is
a. 0.2313 to 0.8533
b. 0.2224 to 0.7924
c. 0.0889 to 0.3169
d. 0.0925 to 0.3413

An example of a bivariate experiment is
a. tossing a coin once
b. rolling a pair of dice
c. winning or losing a football game
d. passing or failing a course
The finite correction factor should be used in the computation of when n/N
is greater than
a. .01
b. .025
c. .05
d. .10

Any method of sampling for which the probability of selecting a sample cannot be
computed is termed
a. probability sampling
b. nonprobabilistic sampling
c. unknown population sampling
d. None of these alternatives is correct.
The level of significance can be any
a. negative value
b. value
c. value larger than 0.1
d. None of the answers is correct.
Exhibit 14-2
You are given the following information about y and x.

Refer to Exhibit 14-2. The sample correlation coefficient equals
a. -86.667
b. -0.99705
c. 0.9941
d. 0.99705
Which of the following properties of a binomial experiment is called the stationarity
property?
a. The experiment consists of n identical trials
b. Two outcomes are possible on each trial
c. The probability of success is the same for each trial
d. The trials are independent
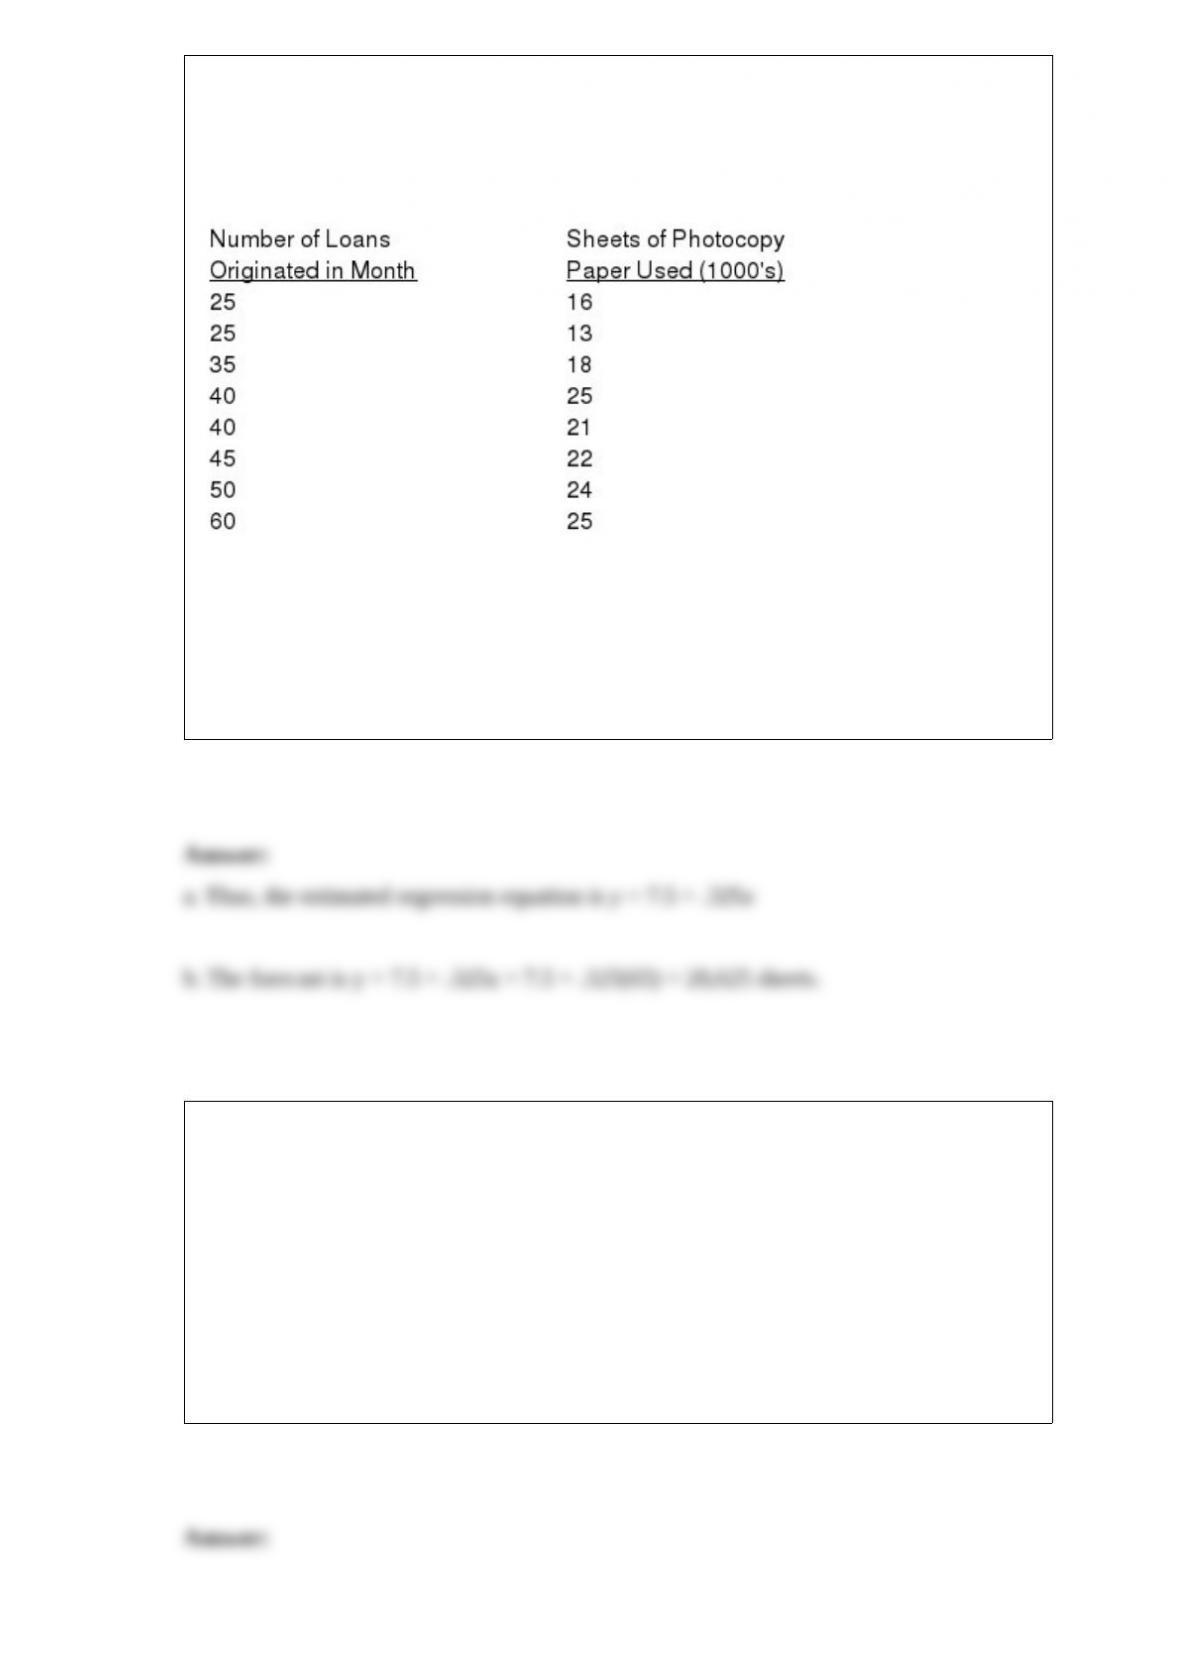
Connie Harris, in charge of office supplies at First Capital Mortgage Corp., would like
to predict the quantity of paper used in the office photocopying machines per month.
She believes that the number of loans originated in a month influence the volume of
photocopying performed. She has compiled the following recent monthly data:
a. Develop the least-squares estimated regression equation that relates sheets of
photocopy paper used to loans originated.
b). Use the regression equation developed in part (a) to forecast the amount of paper
used in a month when 65 loan originations are expected.
The equation that describes how the dependent variable (y) is related to the independent
variable (x) is called
a. the correlation model
b. the regression model
c. correlation analysis
d. None of these answers is correct.

If two variables, x and y, have a strong linear relationship, then
a. there may or may not be any causal relationship between x and y
b. x causes y to happen
c. y causes x to happen
d. None of these answers is correct.
A tabular method that can be used to summarize the data on two variables
simultaneously is called
a. simultaneous equations
b. a crosstabulation
c. a histogram
d. a dot plot
Exhibit 11-3
The contents of a sample of 26 cans of apple juice showed a standard deviation of 0.06
ounces. We are interested in testing to determine whether the variance of the population
is significantly more than 0.003.
Refer to Exhibit 11-3. The null hypothesis

a. should be rejected
b. should not be rejected
c. should be revised
d. None of these alternatives is correct.
A sample of 60 items from population 1 has a sample variance of 8 while a sample of
40 items from population 2 has a sample variance of 10. If we test whether the
variances of the two populations are equal, the test statistic will have a value of
a. 0.8
b. 1.56
c. 1.5
d. 1.25
The function that defines the probability distribution of any continuous random variable
is a
a. normal function
b. uniform function
c. Both the normal function and the uniform function are correct.
d. probability density function

Exhibit 21-4
Simple random sampling has been used to obtain a sample of size 50 from a population
of size 500. The sample proportion was 0.7.
Refer to Exhibit 21-4. An approximate 95% confidence interval for the population
proportion is
a. 0.500 to 0.700
b. 0.750 to 0.810
c. 0.576 to 0.824
d. 0.638 to 0.762
A variable that cannot be measured in terms of how much or how many but instead is
assigned values to represent categories is called
a. an interaction
b. a constant variable
c. a category variable
d. a qualitative variable

Exhibit 11-3
The contents of a sample of 26 cans of apple juice showed a standard deviation of 0.06
ounces. We are interested in testing to determine whether the variance of the population
is significantly more than 0.003.
Refer to Exhibit 11-3. The null hypothesis is
a. s2 > 0.003
b. s2 0.003
c. 2 > 0.003
d. 2 0.003
The probability of the union of two events with nonzero probabilities
a. cannot be less than one
b. cannot be one
c. cannot be less than one and cannot be one
d. None of the other answers is correct.

Exhibit 18-6
It is believed that the median yearly income in a suburb of Atlanta is $70,000. A sample
of 67 residents was taken. Thirty-eight had yearly incomes above $70,000, 26 had
yearly incomes below $70,000, and 3 had yearly incomes equal to $70,000. The null
hypothesis to be tested is H0: median = $70,000.
Refer to Exhibit 18-6. The test statistic has a value of
a. 1.00
b. 1.50
c. 2.00
d. 2.50
The mathematical equation that explains how the dependent variable y is related to
several independent variables x1, x2, …, xp and the error term is
a. a simple nonlinear regression model
b. a multiple regression model
c. an estimated multiple regression equation
d. a multiple regression equation

Exhibit 15-8
The following estimated regression model was developed relating yearly income (y in
$1,000s) of 30 individuals with their age (x1) and their gender (x2) (0 if male and 1 if
female).
= 30 + 0.7x1 + 3x2
Also provided are SST = 1,200 and SSE = 384.
Refer to Exhibit 15-8. If we want to test for the significance of the model, the critical
value of F at a 5% significance level is
a. 3.33
b. 3.35
c. 3.34
d. 2.96