Political Science, Inc. (PSI) specializes in voter polls and surveys designed to keep
political office seekers informed of their position in a race. Using telephone surveys,
interviewers ask registered voters who they would vote for if the election were held that
day.
In a recent election campaign, PSI found that 220 registered voters, out of 500
contacted, favored a particular candidate.
a. PSI wants to develop a 95% confidence interval estimate for the proportion of the
population of registered voters that favors the candidate.
b. Suppose that PSI would like 99% confidence that the sample proportion is within
+/- .03 of the population proportion. How large a sample size is needed to provide the
desired margin of error?
The sampling distribution of the sample mean
a. is the probability distribution showing all possible values of the sample mean
b. is used as a point estimator of the population mean
c. is an unbiased estimator
d. shows the distribution of all possible values of
The binomial probability distribution is most symmetric when

a. n is 30 or greater
b. n equals p
c. p approaches 1
d. p equals 0.5
Data collected at the same, or approximately the same, point in time are
a. time series data
b. static data
c. cross-sectional data
d. one-dimensional data
As the sample size increases, the
a. standard deviation of the population decreases
b. population mean increases
c. standard error of the mean decreases
d. standard error of the mean increases

A university has 5,000 students. The manager of food services at the university is
interested in determining the total lunch expenditure. A simple random sample of 121
lunch receipts was selected. The sample showed an average of $3 with a standard
deviation of $0.40.
a. Estimate the standard error of the sample mean.
b. Develop an approximate 95% confidence interval for the population mean.
c. Estimate the population’s total expenditure for lunch.
d. Develop an approximate 95% confidence interval for the total expenditure for lunch.
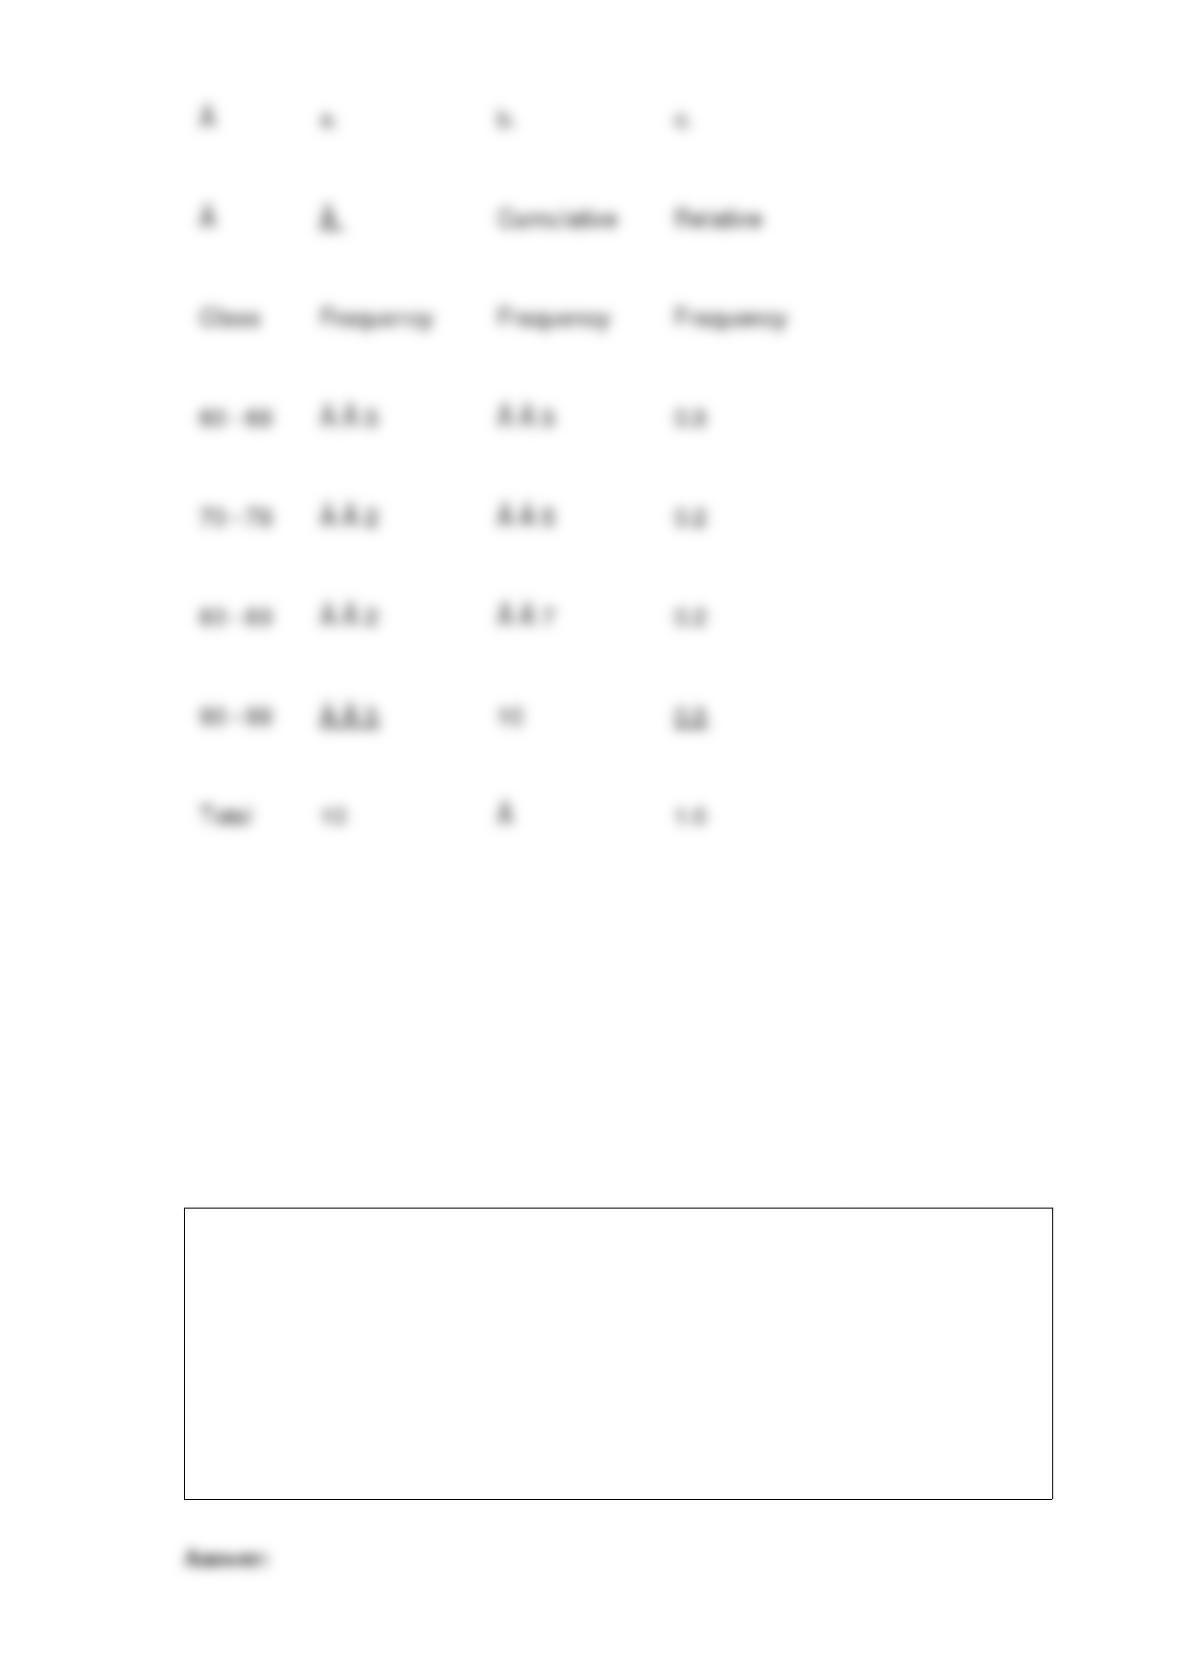
The grades of 10 students on their first management test are shown below.
a. Construct a frequency distribution. Let the first class be 60 69.
b. Construct a cumulative frequency distribution.
c. Construct a relative frequency distribution.
The two general classifications of attributes in quality control are
a. random and predictable
b. controllable and uncontrollable
c. variable and constant
d. defective and nondefective

When dealing with the number of occurrences of an event over a specified interval of
time or space and when the occurrence or nonoccurrence in any interval is independent
of the occurrence or nonoccurrence in any other interval, the appropriate probability
distribution is a
a. binomial distribution
b. Poisson distribution
c. normal distribution
d. hypergeometric probability distribution
Exhibit 8-1
In order to estimate the average time spent on the computer terminals per student at a
local university, data were collected from a sample of 81 business students over a
one-week period. Assume the population standard deviation is 1.2 hours.
Refer to Exhibit 8-1. If the sample mean is 9 hours, then the 95% confidence interval is
approximately
a. 7.04 to 110.96 hours
b. 7.36 to 10.64 hours
c. 7.80 to 10.20 hours
d. 8.74 to 9.26 hours
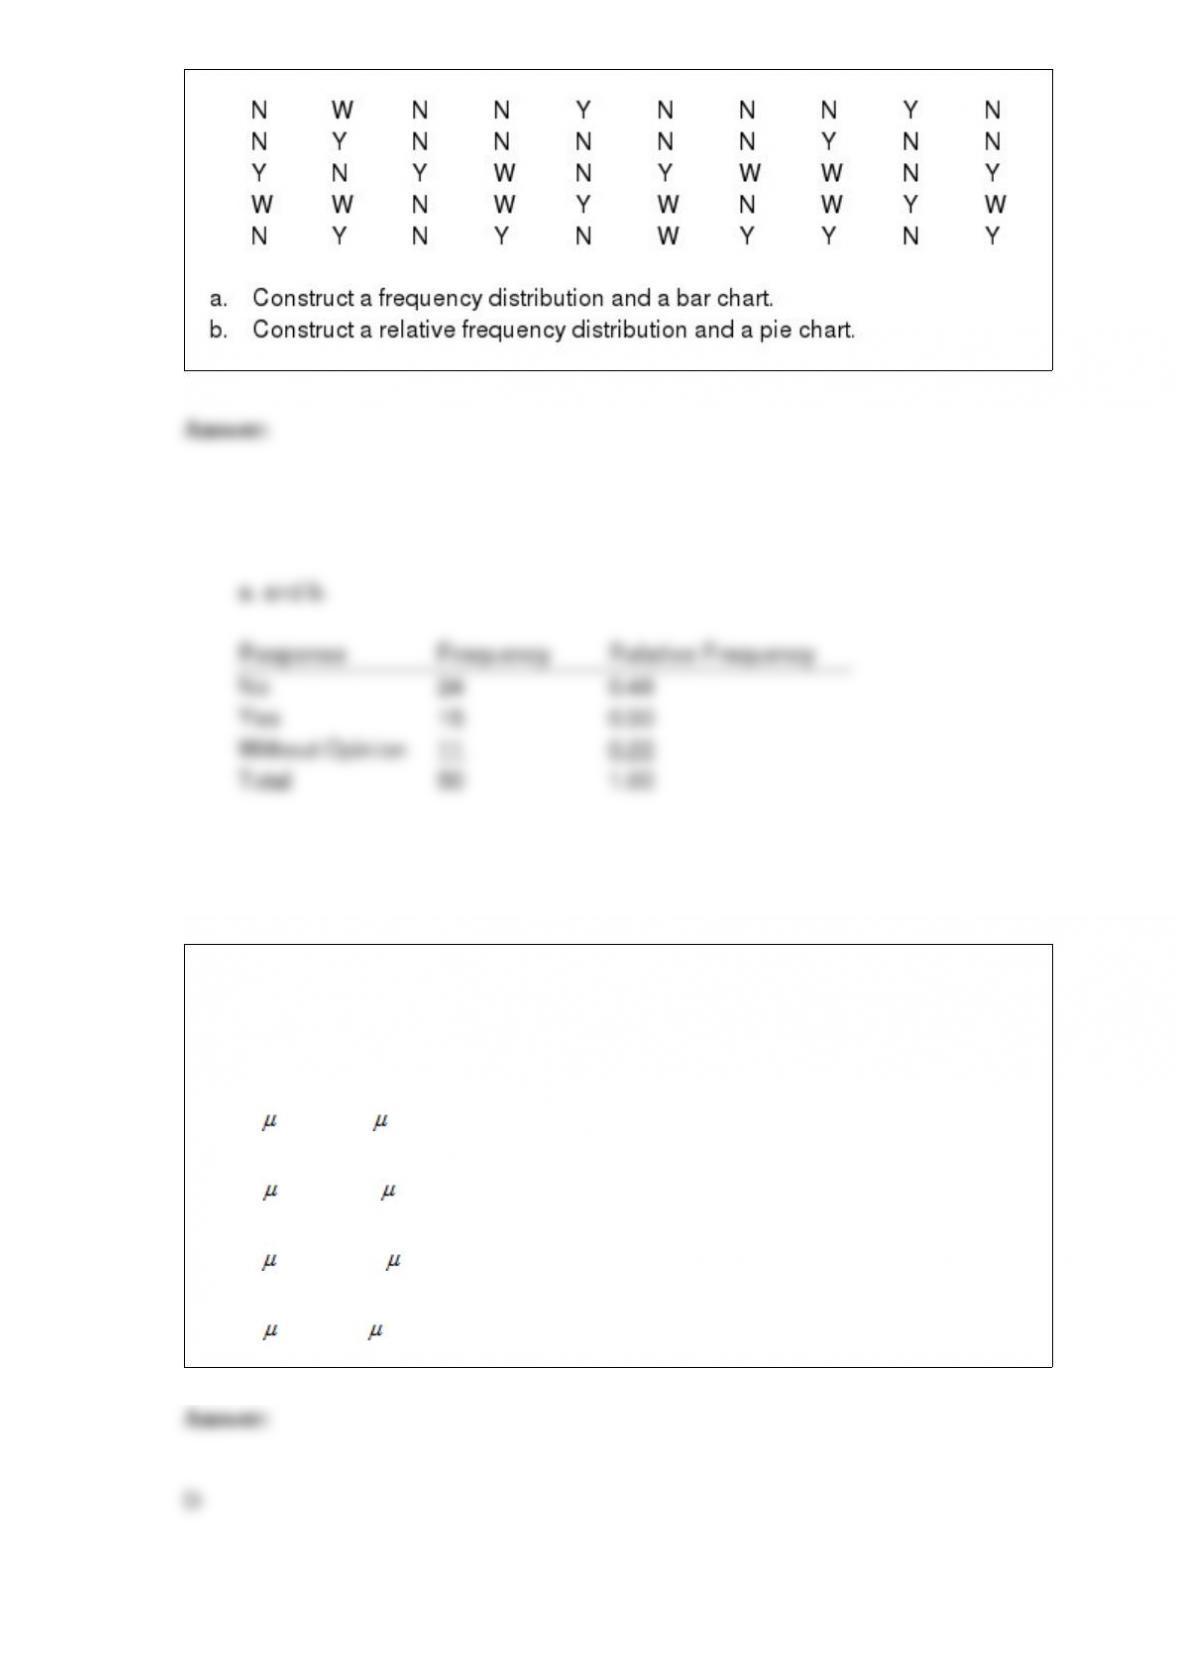
A sample of 50 TV viewers were asked, “Should TV sponsors pull their sponsorship
from programs that draw numerous viewer complaints?” Below are the results of the
survey. (Y Yes; N No; W Without Opinion)
A soft drink filling machine, when in perfect adjustment, fills the bottles with 12 ounces
of soft drink. Any overfilling or underfilling results in the shutdown and readjustment
of the machine. To determine whether or not the machine is properly adjusted, the
correct set of hypotheses is
a. H0: < 12 Ha: 12
b. H0: 12 Ha: 12
c. H0: 12 Ha: 12
d. H0: 12 Ha: 12
An experimental design where the experimental units are randomly assigned to the
treatments is known as
a. factor block design
b. random factor design
c. completely randomized design
d. None of these alternatives is correct.
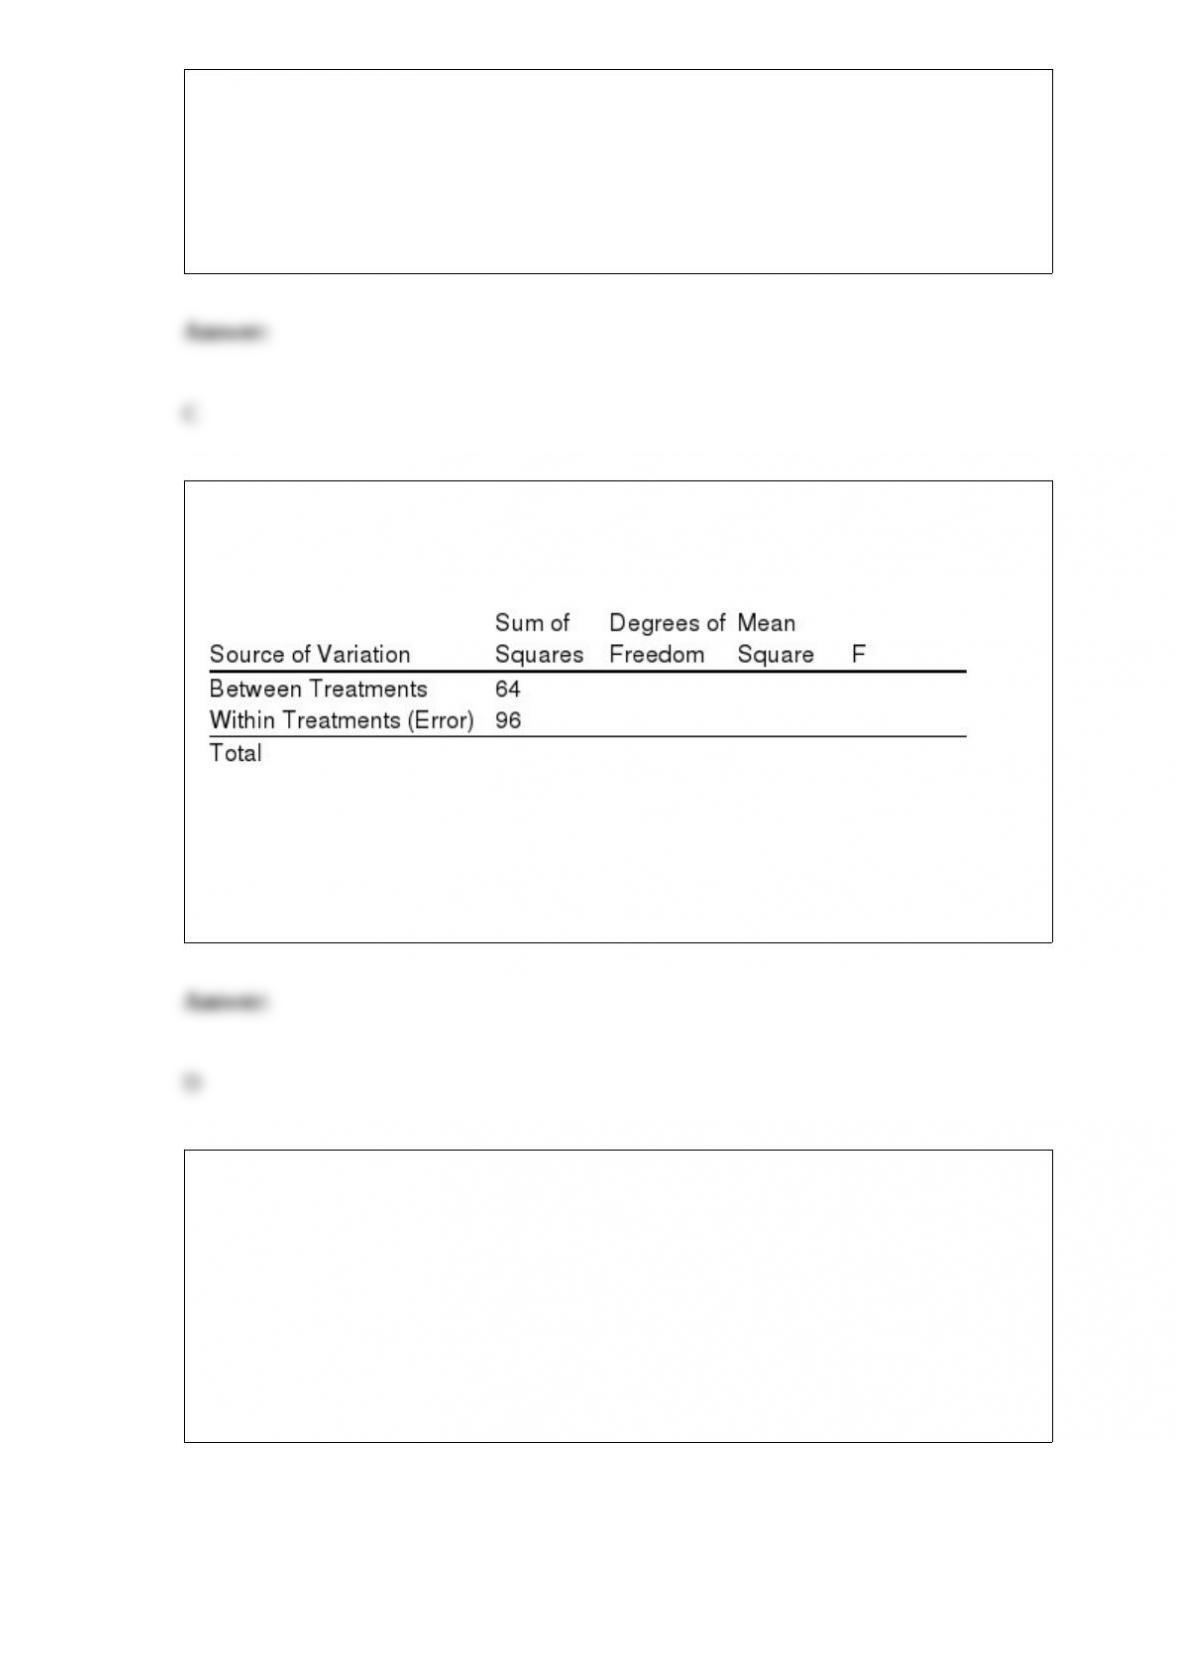
Exhibit 13-7
The following is part of an ANOVA table, which was the results of three treatments and
a total of 15 observations.
Refer to Exhibit 13-7. The computed test statistics is
a. 32
b. 8
c. 0.667
d. 4
It is time for Roger Hall, manager of new car sales at the Maxwell Ford dealership, to
submit his order for new Mustang coupes. These cars will be parked in the lot, available
for immediate sale to buyers who are not special-ordering a car. Roger must decide how
many Mustangs of each color he should order. The new color options are very similar to
the past year’s options.
Roger believes the colors chosen by customers who special-order their cars best reflect
most customers’ true color preferences. He has taken a random sample of 40 special
orders for Mustang coupes placed in the past year. The color preferences found in the
sample are listed below.
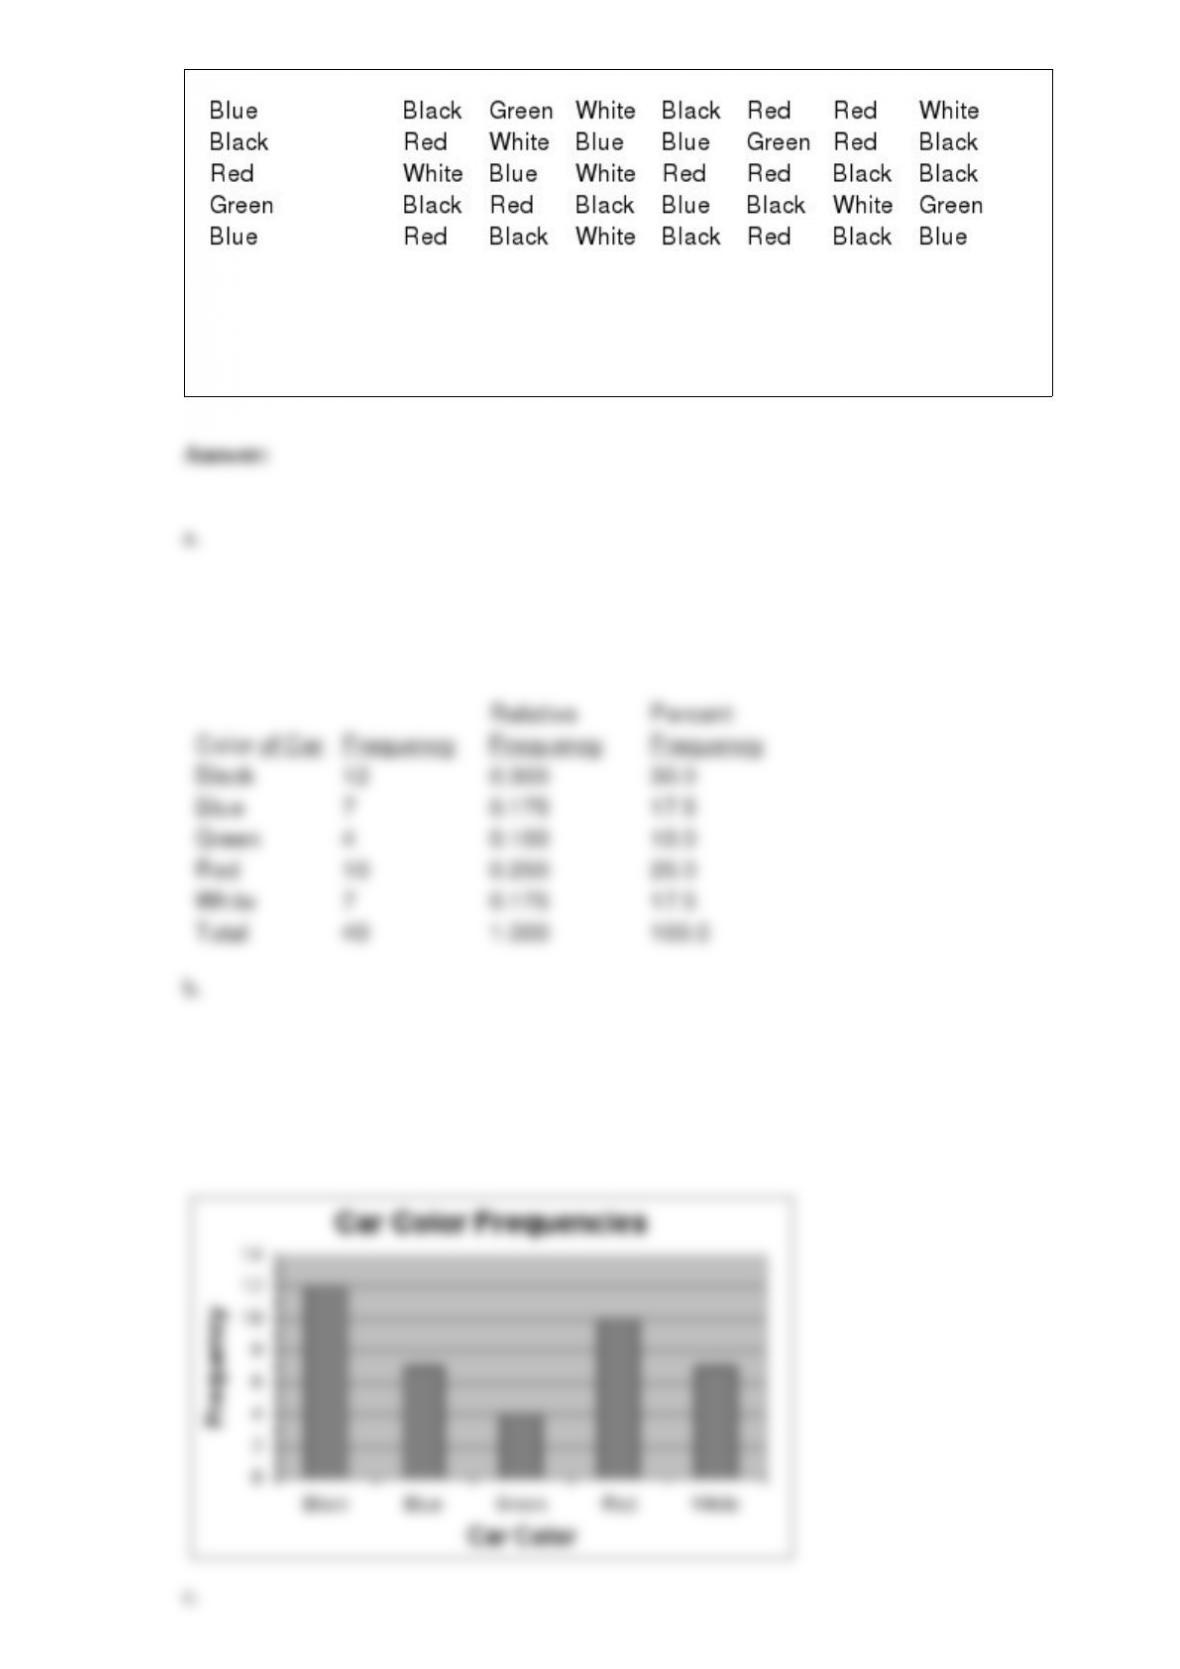
a. Prepare a frequency distribution, relative frequency distribution, and percent
frequency distribution for the data set.
b. Construct a bar chart showing the frequency distribution of the car colors.
c. Construct a pie chart showing the percent frequency distribution of the car colors.
The descriptive measure that is not measured in the same units as the original data is the
a. median
b. standard deviation
c. mode
d. variance
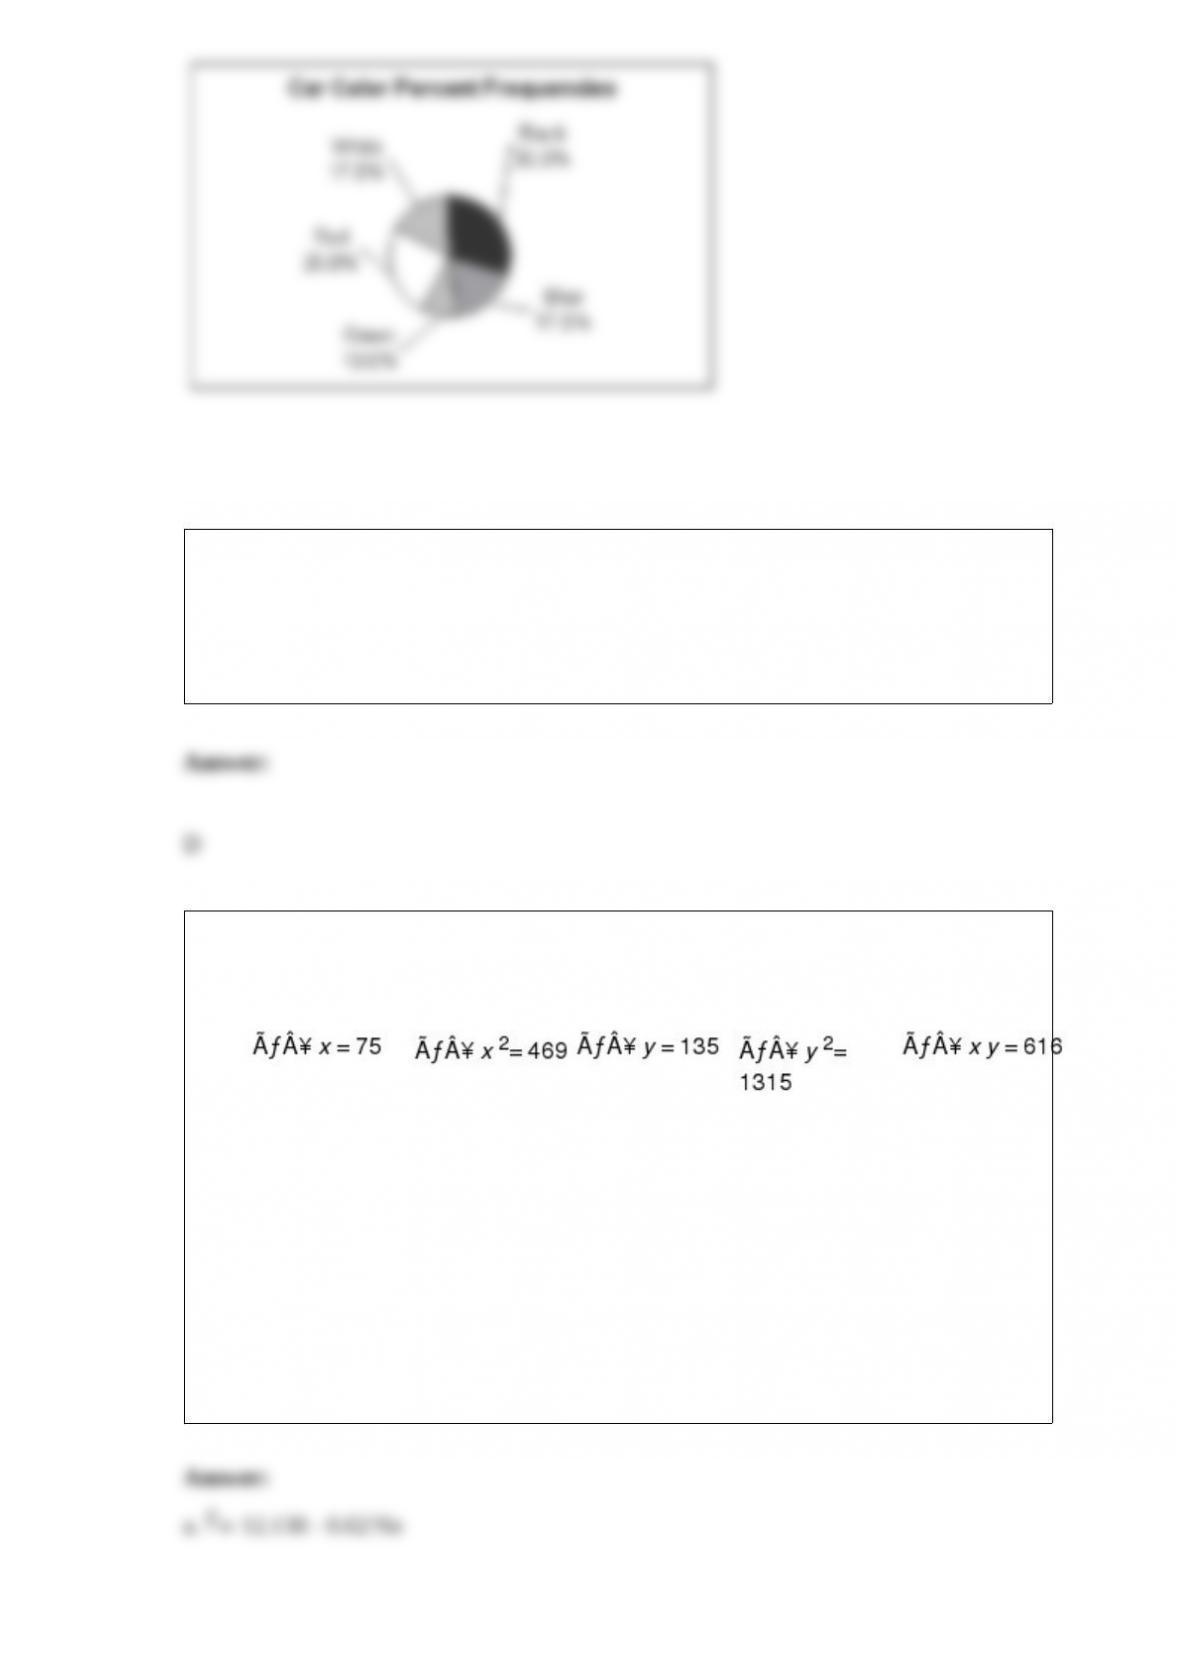
A company has recorded data on the daily demand for its product (y in thousands of
units) and the unit price (x in hundreds of dollars). A sample of 15 days demand and
associated prices resulted in the following data.
a. Using the above information, develop the least-squares estimated regression line and
write the equation.
b. Compute the coefficient of determination.
c. Perform an F test and determine whether or not there is a significant relationship
between demand and unit price. Let 0.05.
d. Would the demand ever reach zero? If yes, at what price would the demand be zero?

Assume you have applied to two different universities (let’s refer to them as
Universities A and B) for your graduate work. In the past, 25% of students (with similar
credentials as yours) who applied to University A were accepted, while University B
accepted 35% of the applicants. Assume events are independent of each other.
a. What is the probability that you will be accepted in both universities?
b. What is the probability that you will be accepted to at least one graduate program?
c. What is the probability that one and only one of the universities will accept you?
d. What is the probability that neither university will accept you?
From a population of 500 elements, a sample of 225 elements is selected. It is known
that the variance of the population is 900. The standard error of the mean is
approximately
a. 1.1022
b. 2
c. 30
d. 1.4847
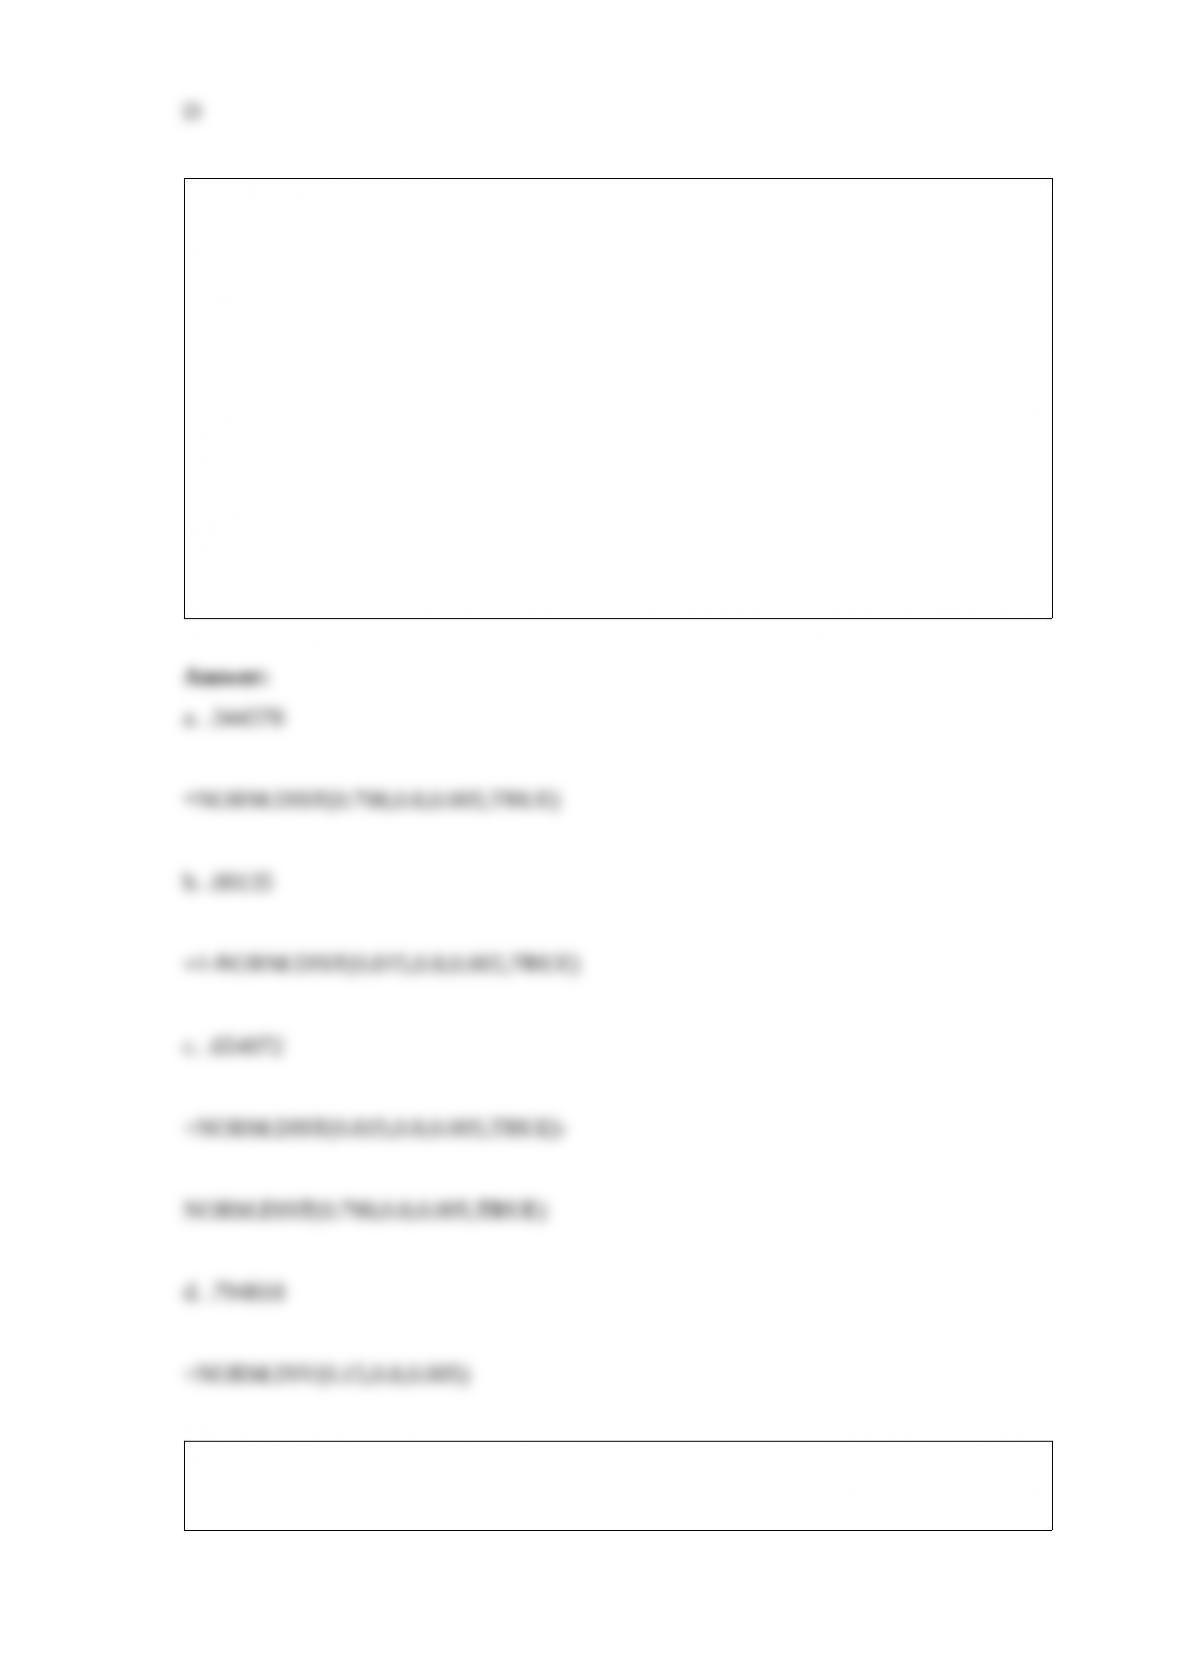
The mean diameter of a ball bearing produced by a certain manufacturer is 0.80 cm
with a standard deviation of 0.03 cm. A sample of 36 ball bearings is randomly selected
from a production run. Use Excel to answer the following questions.
a. What is the probability that the sample of ball bearings will have a mean less than
0.798 cm?
b. What is the probability that the sample of ball bearings will have a mean of at least
0.815 cm?
c. What is the probability that the sample of ball bearings will have a mean between
0.798 and 0.815 cm?
d. For samples of size 36, 15% of all sample means are at most what diameter?
At = 0.1, test to see if the population variances from which the following samples
were drawn are equal.
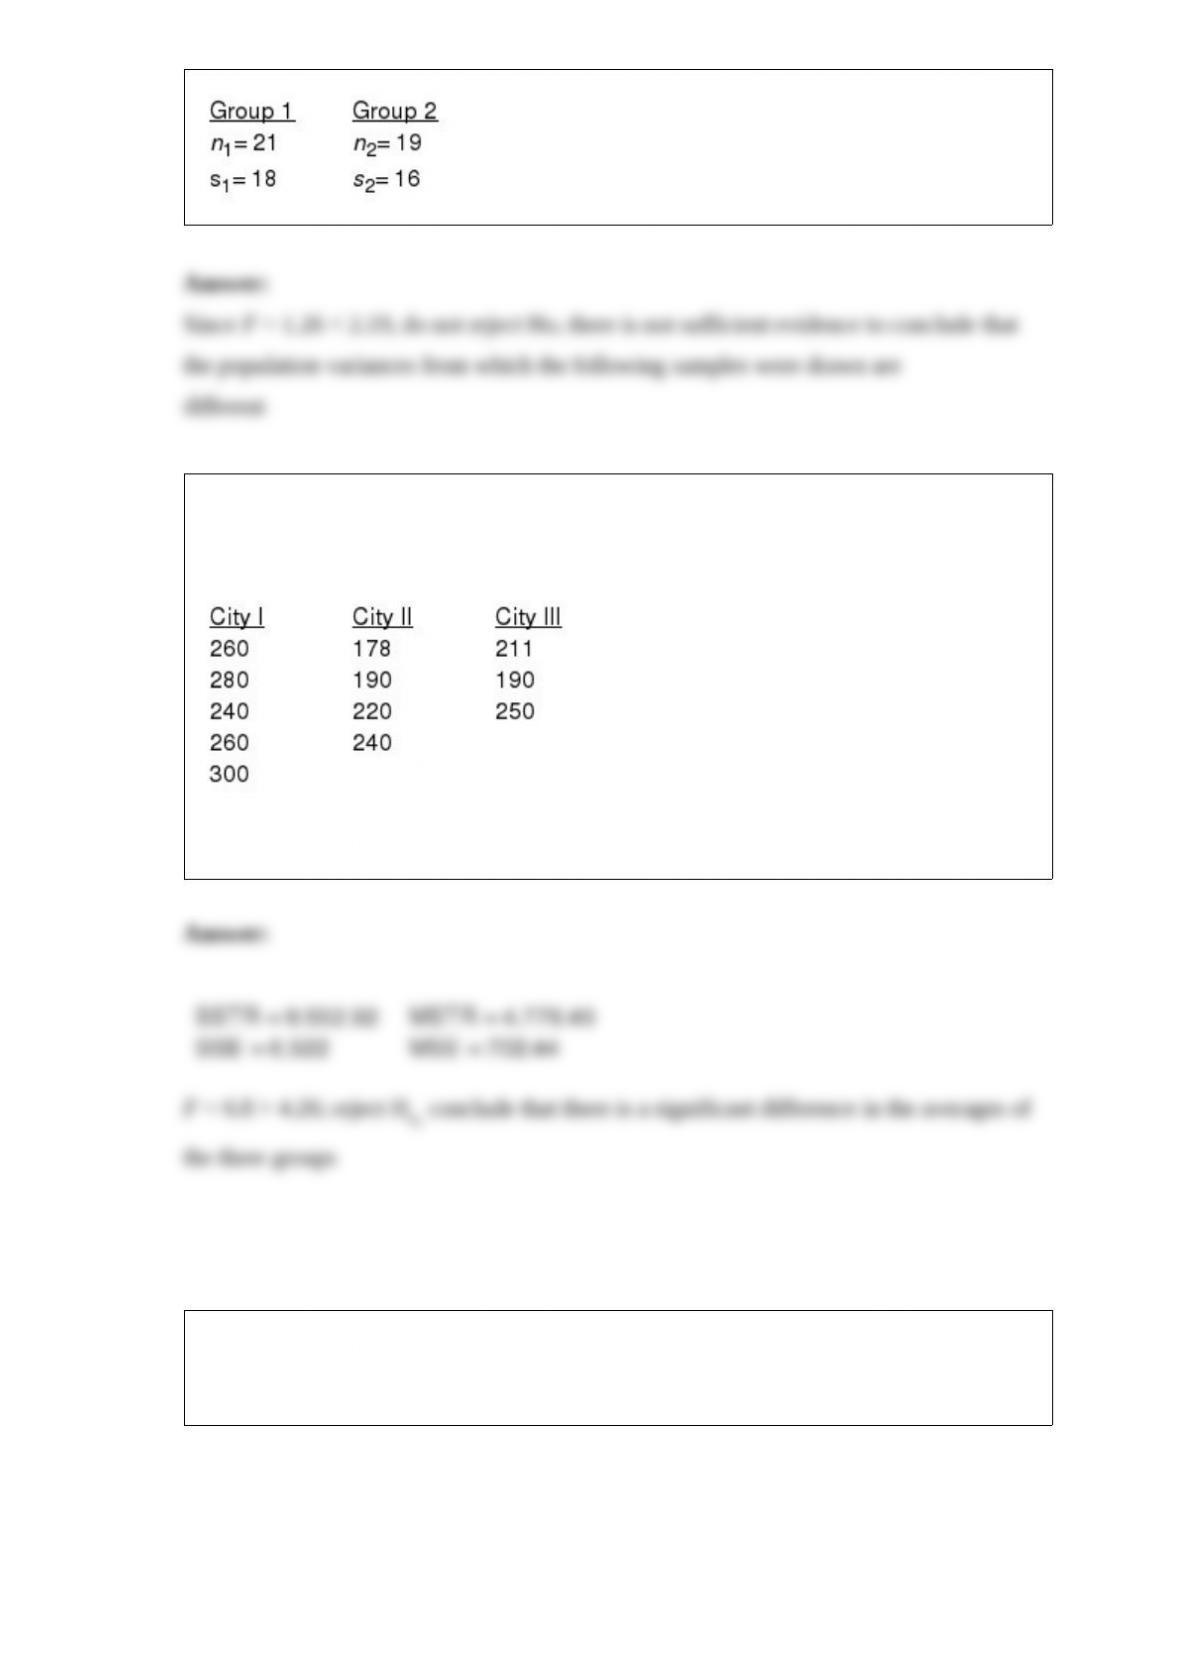
Random samples of individuals from three different cities were asked how much time
they spend per day watching television. The results (in minutes) for the three groups are
shown below.
At = 0.05, test to see if there is a significant difference in the averages of the three
groups.
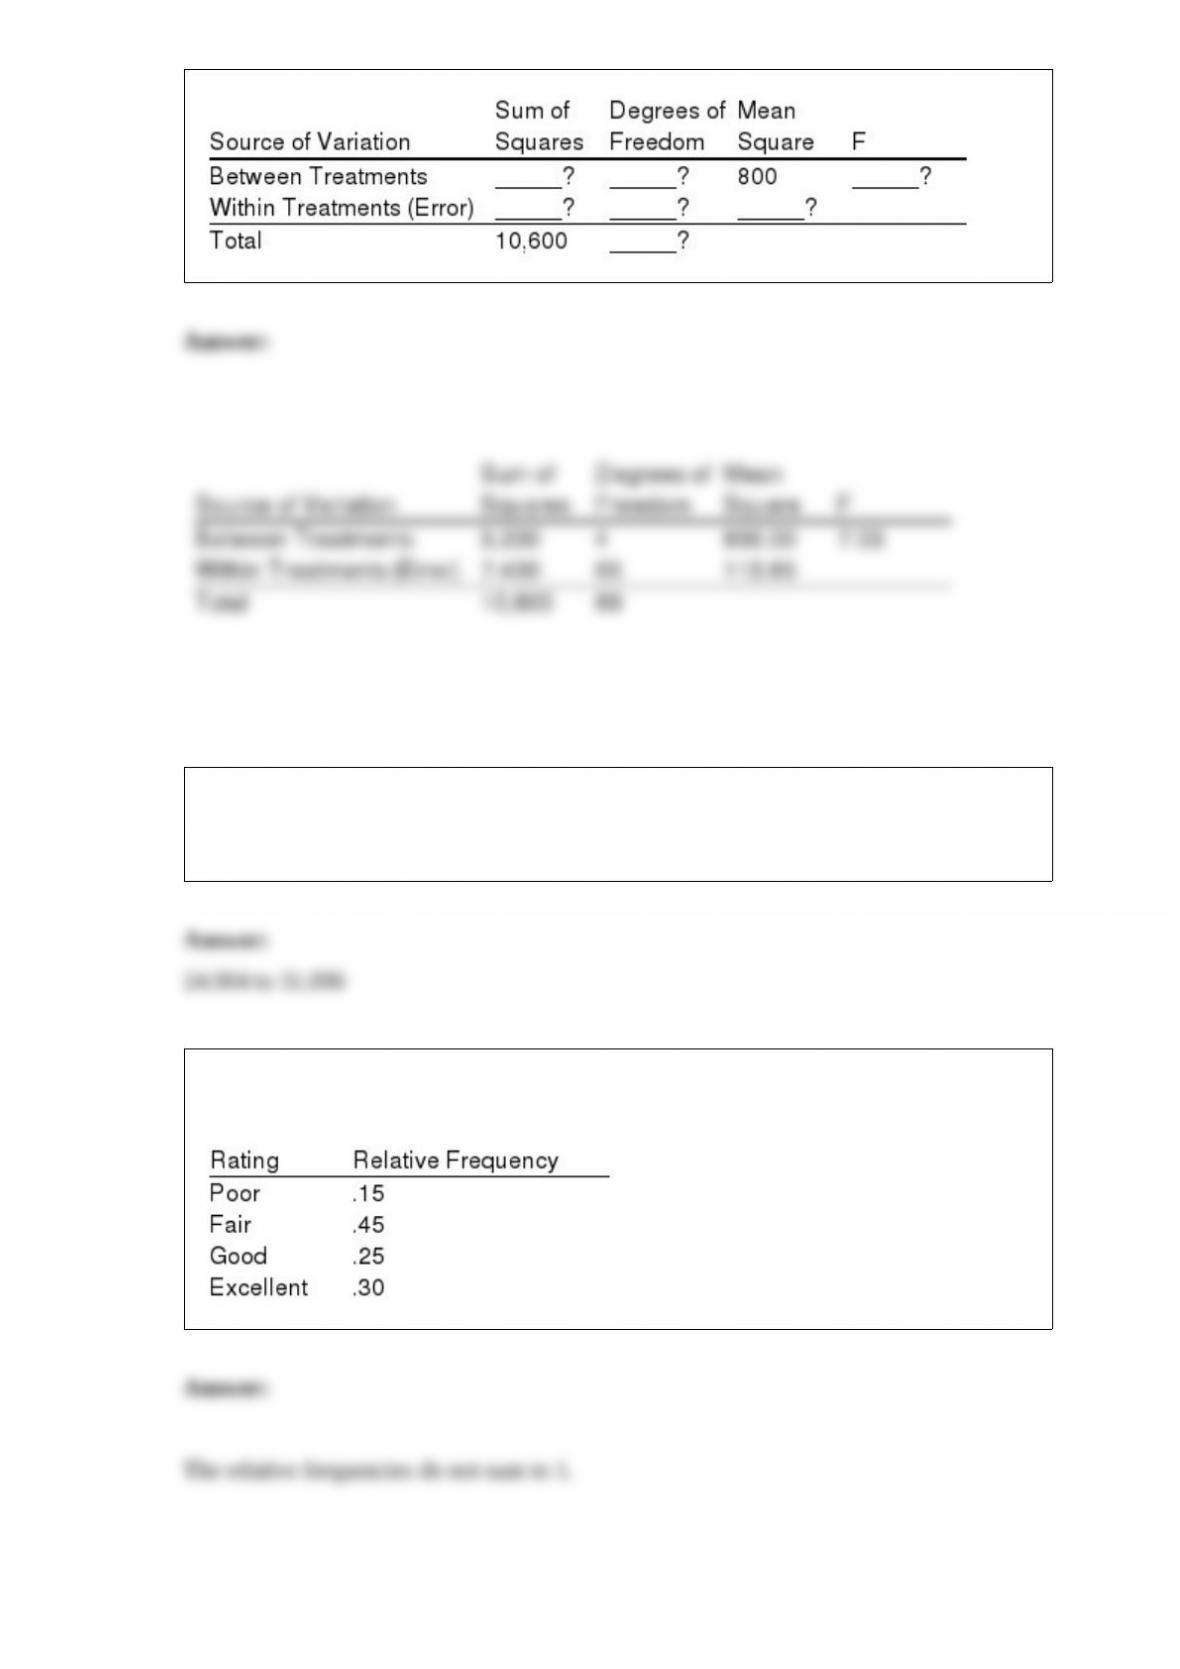
In a completely randomized experimental design, 14 experimental units were used for
each of the 5 levels of the factor (i.e., 5 treatments). Fill in the blanks in the following
ANOVA table.
A simple random sample of 25 items from a normally distributed population resulted in
a sample mean of 28 and a standard deviation of 7.5. Construct a 95% confidence
interval for the population mean.
A summary of the results of a job satisfaction survey follows. What is wrong with the
relative frequency distribution?
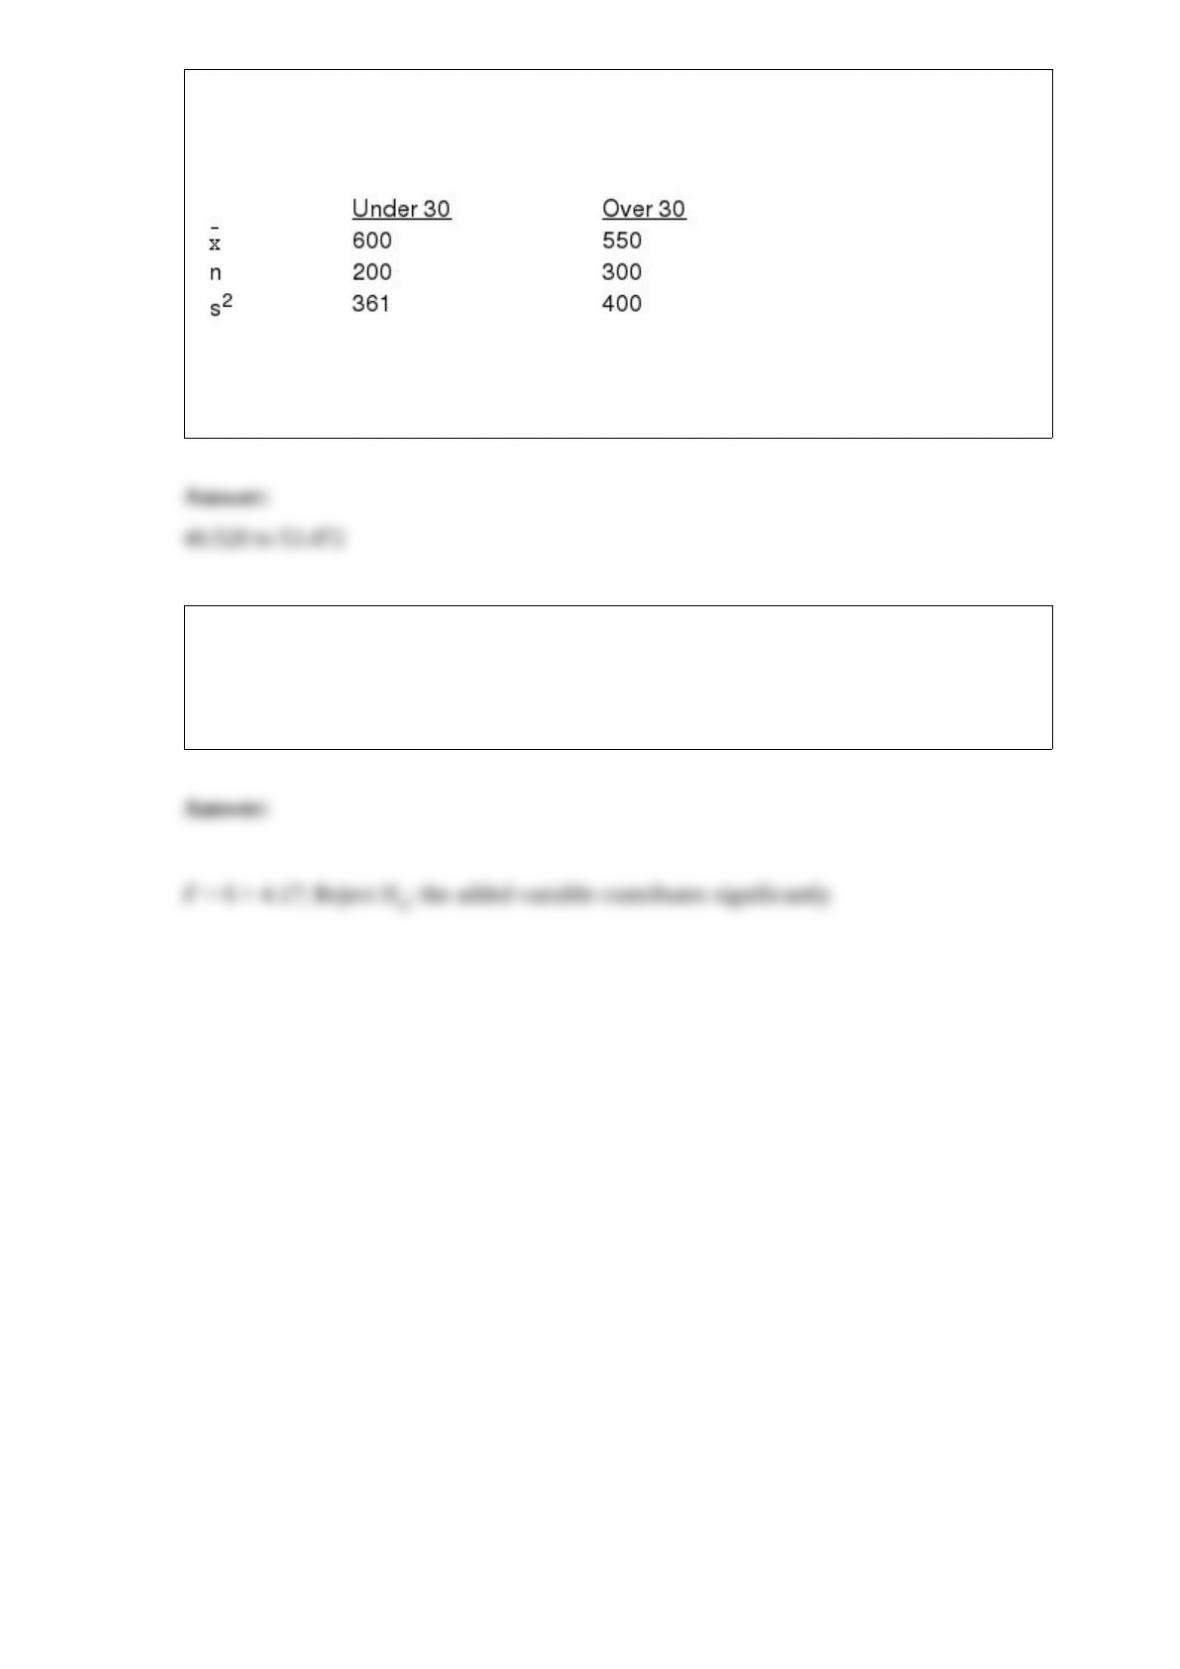
A credit company has gathered information regarding the average amount owed by
people under 30 years old and by people over 30 years. Independent random samples
were taken from both age groups. You are given the following information.
Construct a 95% confidence interval for the difference between the average amounts
owed by the two age groups.
Thirty four observations of a dependent variable (y), and two independent variables
resulted in an SSE of 300. When a third independent variable was added to the model,
the SSE was reduced to 250. At a 5% level of significance, determine if the third
independent variable contributes significantly to the model.