What value of Durbin-Watson statistic indicates no autocorrelation is present?
a. 1
b. 2
c. -2
d. 0
From a population consisting of 8,000 elements, a sample of size 121 is selected. The
sample has a mean of 4,000 and a standard deviation of 600.
a. Estimate the standard error of the mean.
b. Develop an approximate 95% confidence interval for the population mean.
c. Estimate the population total.
d. Develop an approximate 95% confidence interval for the population total.
Exhibit 13-2
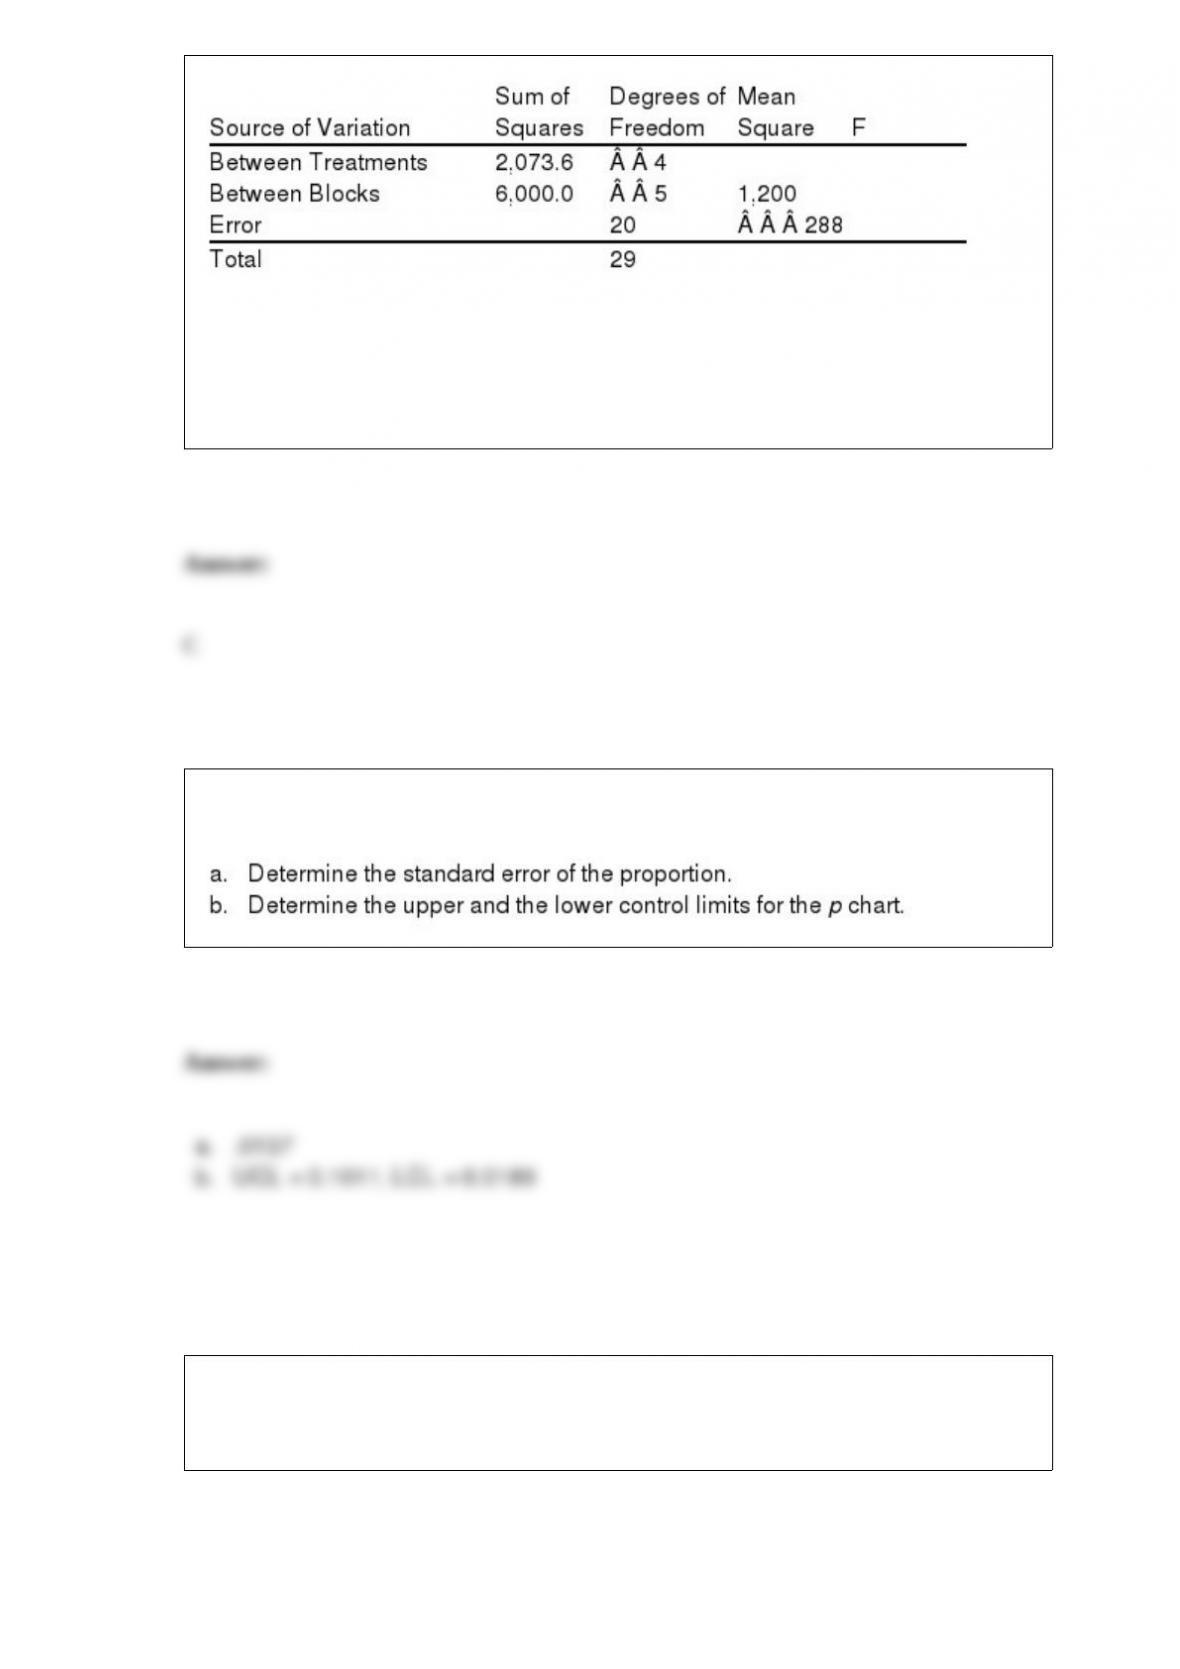
Refer to Exhibit 13-2. The sum of squares due to error equals
a. 14.4
b. 2,073.6
c. 5,760
d. 6,000
A production process is considered in control if 6% of the items produced are defective.
Samples of size 300 are used for the inspection process.
Exhibit 10-5
The following information was obtained from matched samples.

Refer to Exhibit 10-5. The point estimate for the difference between the means of the
two populations is
a. -1
b. 0
c. 1
d. 2
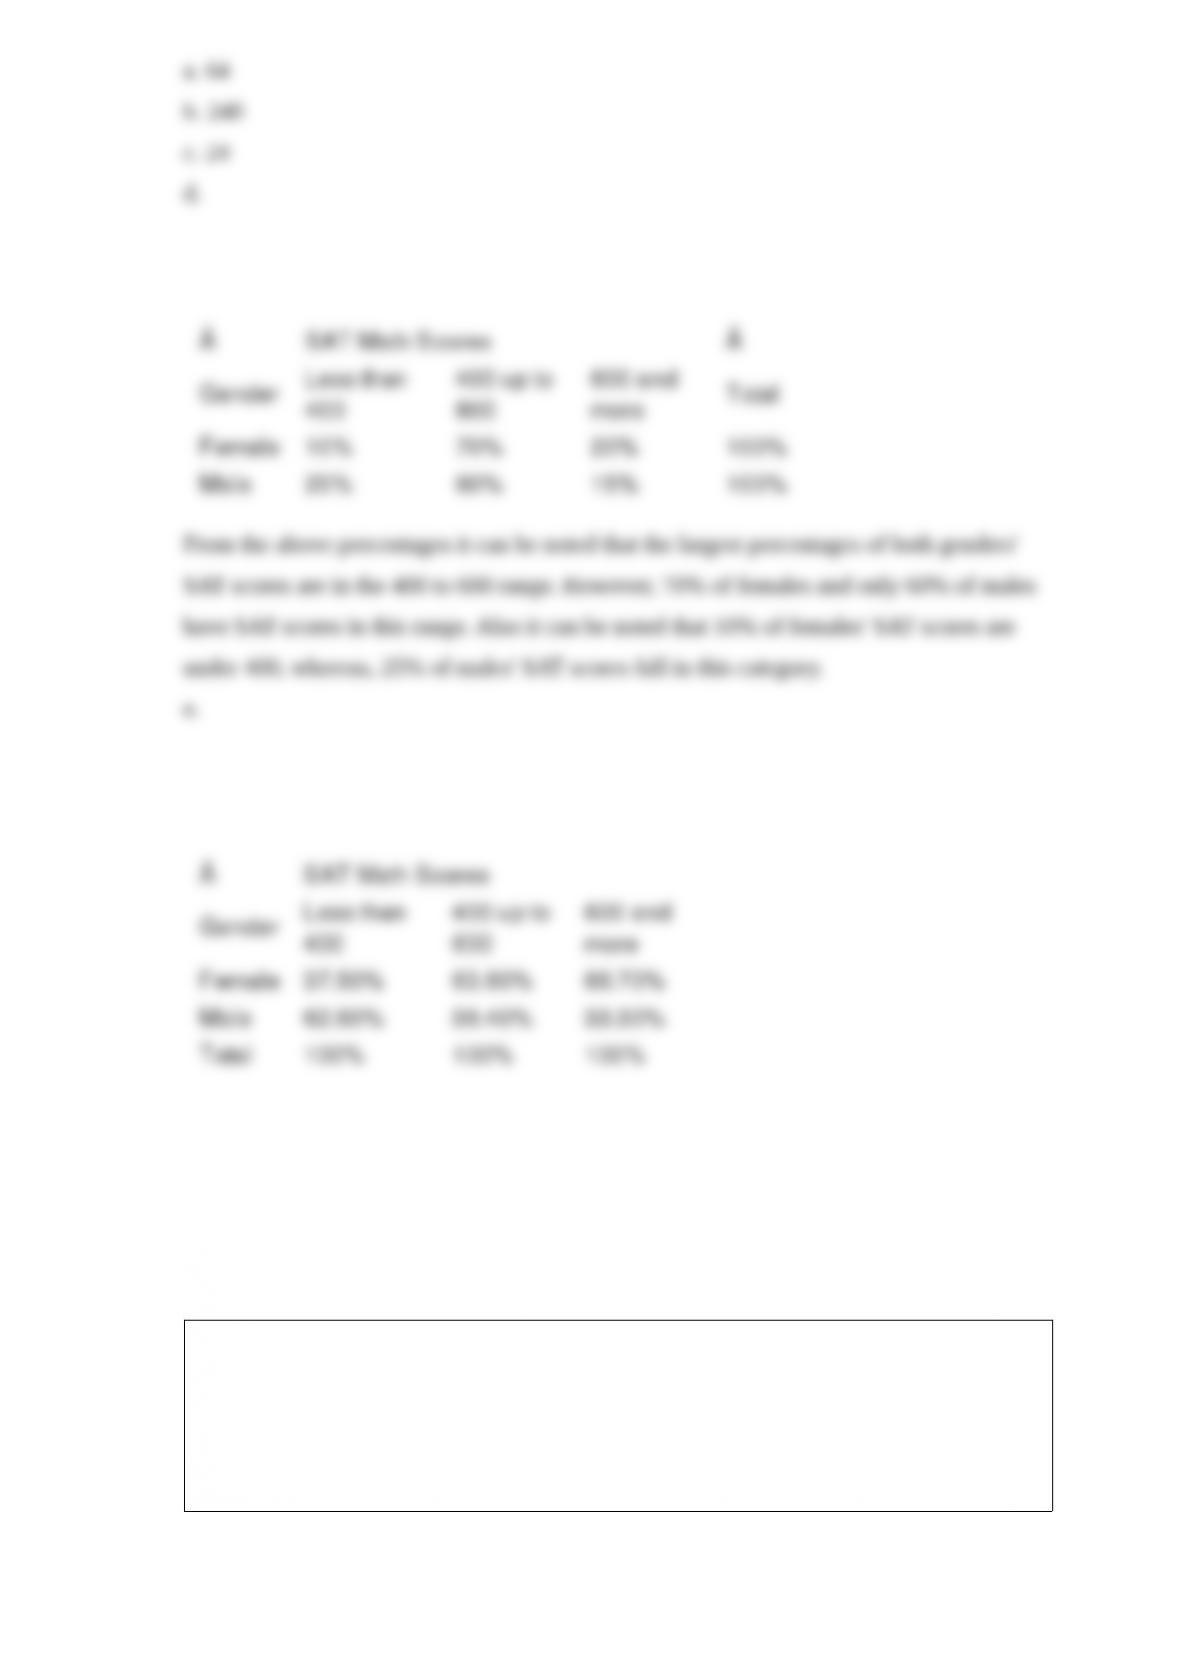
The SAT math scores of a sample of business school students and their
genders are shown below.
a. How many students scored less than 400?
b. How many students were female?
c. Of the male students, how many scored 600 or more?
d. Compute row percentages and comment on any relationship that may
exist between SAT math scores and gender of the individuals.
e. Compute column percentages.
A soft drink manufacturer has developed a regression model relating sales (y in
$10,000) with four independent variables. The four independent variables are price per
unit (x1, in dollars), competitor’s price (x2, in dollars), advertising (x3, in $1000) and
type of container used (x4; 1 = Cans and 0 = Bottles). Part of the regression results are
shown below. (Assume n = 25)
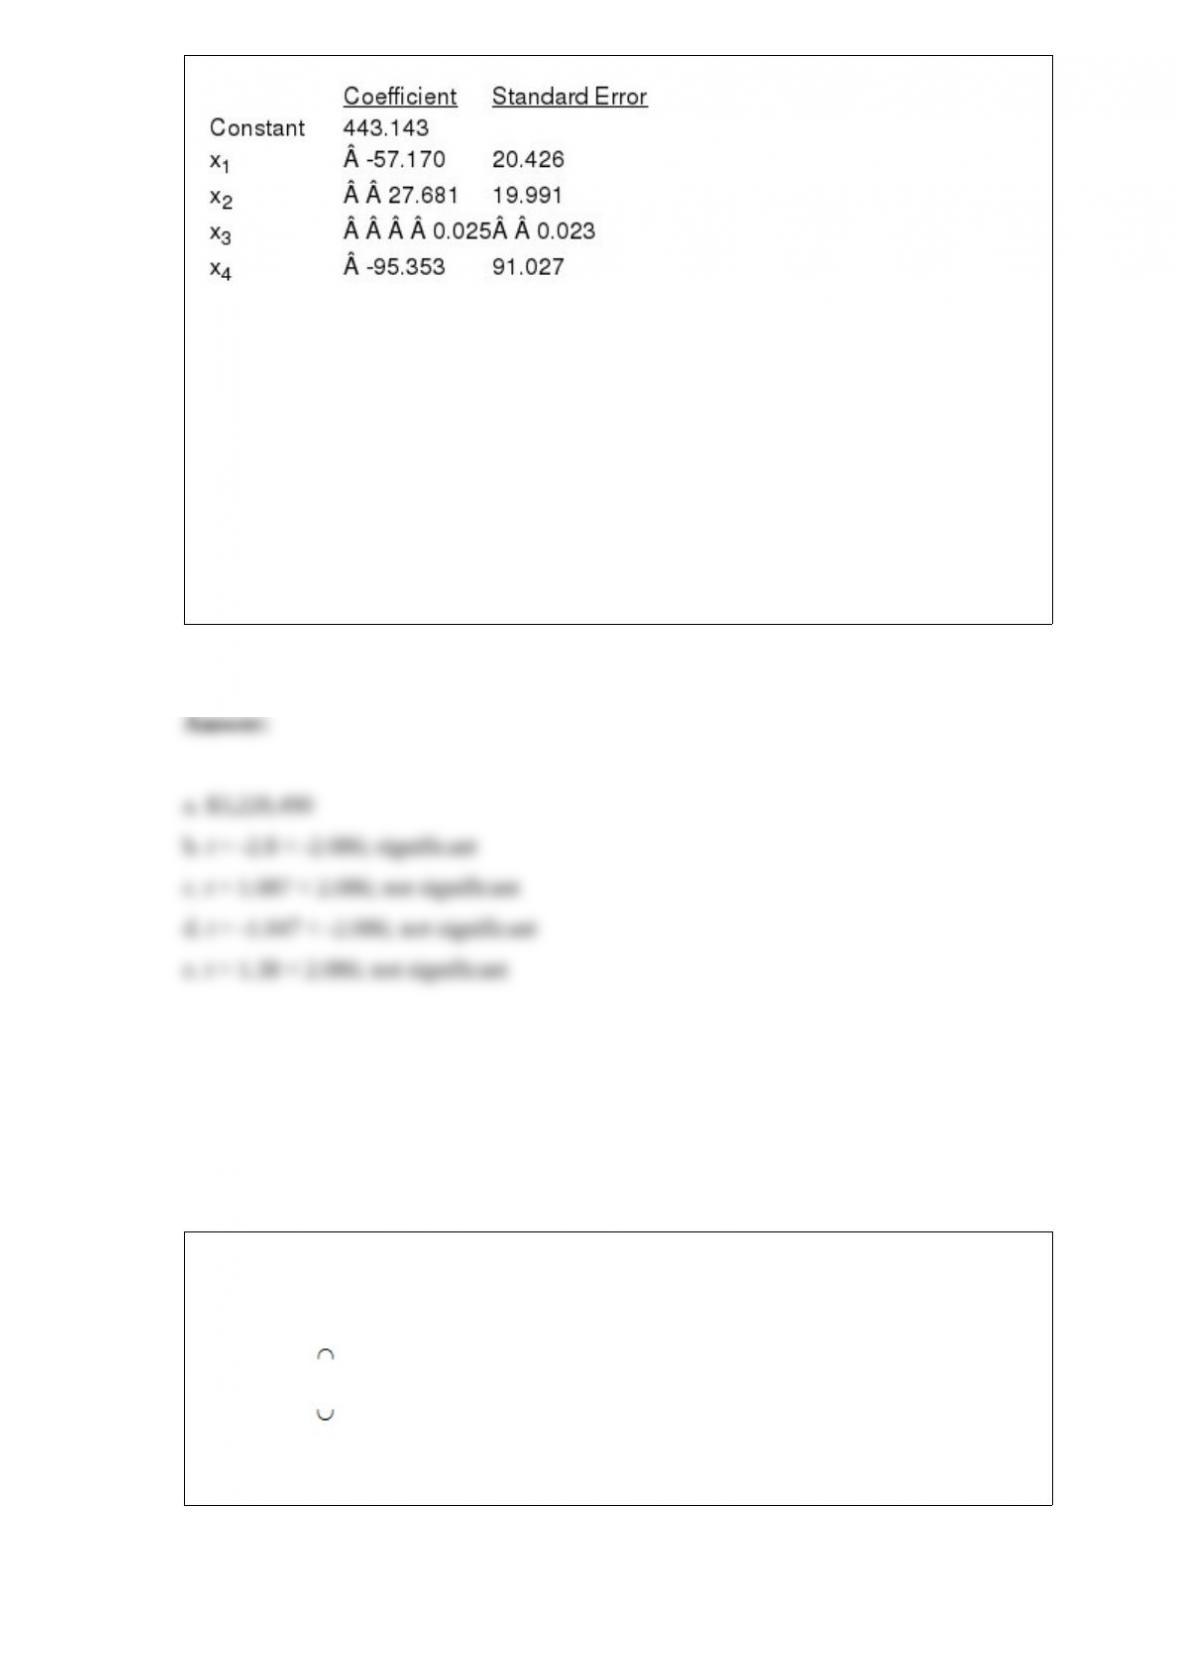
a. If the manufacturer uses can containers and if his price is $1.25, his advertising
expenditure is $200,000, and his competitor’s price is $1.50, what is your estimate of
his sales? (Give your answer in dollars.)
b. Test to see if there is a significant relationship between sales and unit price. Let =
0.05.
c. Test to see if there is a significant relationship between sales and advertising. Let =
0.05.
d. Is the type of container a significant variable? Let = 0.05 = 0.05.
e. Test to see if there is a significant relationship between sales and competitor’s price.
Let = 0.05.
Assume two events A and B are mutually exclusive and, furthermore, P(A) 0.2 and
P(B) 0.4.
a. Find P(A B).
b. Find P(A B).
c. Find P(AB).

Exhibit 16-1
In a regression analysis involving 25 observations, the following estimated regression
equation was developed.
= 10 – 18x1 + 3x2 + 14x3
Also, the following standard errors and the sum of squares were obtained.
Sb1 = 3 Sb2 = 6 Sb3 = 7
SST = 4,800 SSE = 1,296
Refer to Exhibit 16-1. The coefficient of x1
a. is significant
b. is not significant
c. cannot be tested, because not enough information is provided
d. None of these alternatives is correct.
A student believes that the average grade on the statistics final examination is 87. A
sample of 36 final examinations is taken. The average grade in the sample is 83.96. The
population variance is 144.
a. State the null and alternative hypotheses.
b. Using a critical value, test the hypothesis at the 5% level of significance.
c. Using a p-value, test the hypothesis at the 5% level of significance.
d. Using a confidence interval, test the hypothesis at the 5% level of significance.
e. Compute the probability of a Type II error if the average grade on the final is 85.
In the textile industry, a manufacturer is interested in the number of blemishes or flaws
occurring in each 100 feet of material. The probability distribution that has the greatest
chance of applying to this situation is the
a. normal distribution
b. binomial distribution
c. Poisson distribution
d. uniform distribution

A survey of an entire population is called
a. population analysis
b. population
c. census
d. target population
Stratified random sampling is a method of selecting a sample in which
a. the sample is first divided into groups, and then random samples are taken from each
group
b. various strata are selected from the sample
c. the population is first divided into groups, and then random samples are drawn from
each group
d. None of the alternative answers is correct.
A frequency distribution is
a. a tabular summary of a set of data showing the fraction of items in each of several
nonoverlapping classes
b. a graphical form of representing data
c. a tabular summary of a set of data showing the number of items in each of several
nonoverlapping classes
d. a graphical device for presenting categorical data
Statistical methods that require assumptions about the population are known as
a. distribution free
b. nonparametric
c. either distribution free of nonparametric
d. parametric
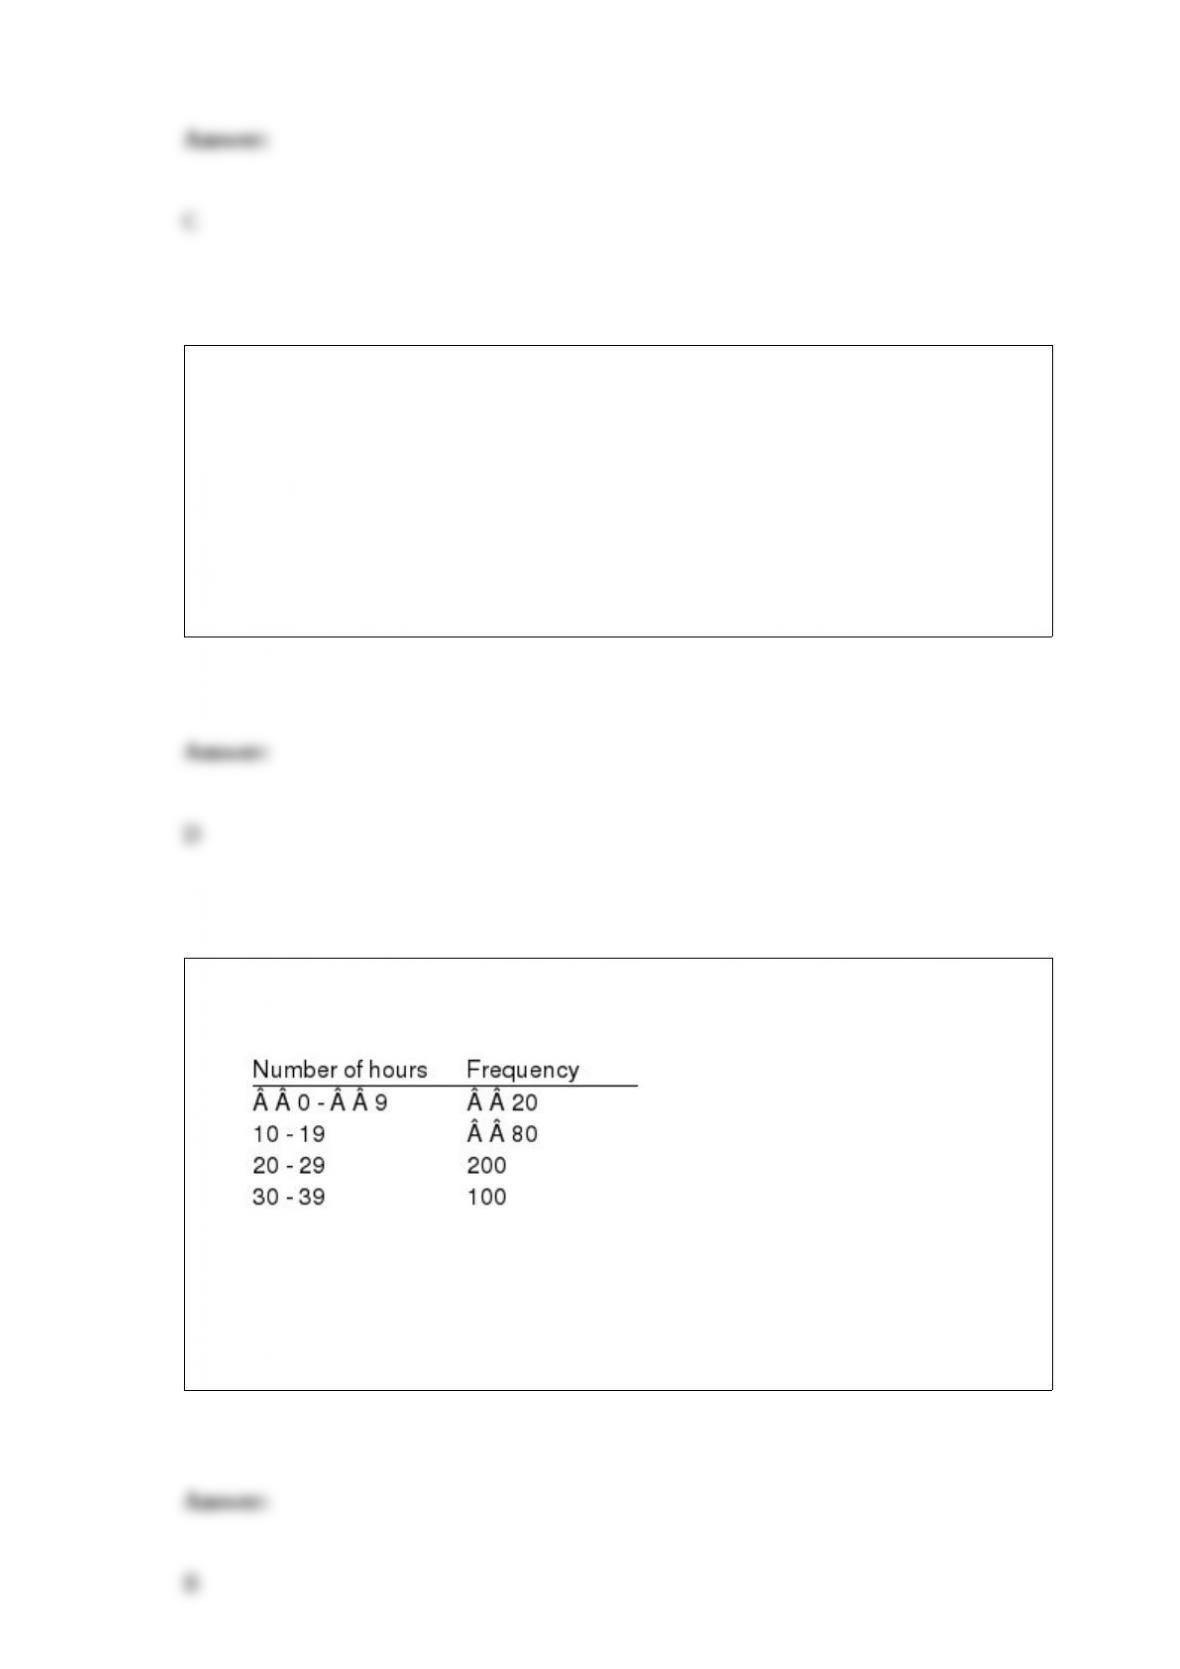
Exhibit 2-1
The numbers of hours worked (per week) by 400 statistics students are shown below.
Refer to Exhibit 2-1. The cumulative frequency for the class of 20 29
a. is 200
b. is 300
c. is 0.75
d. is 0.50
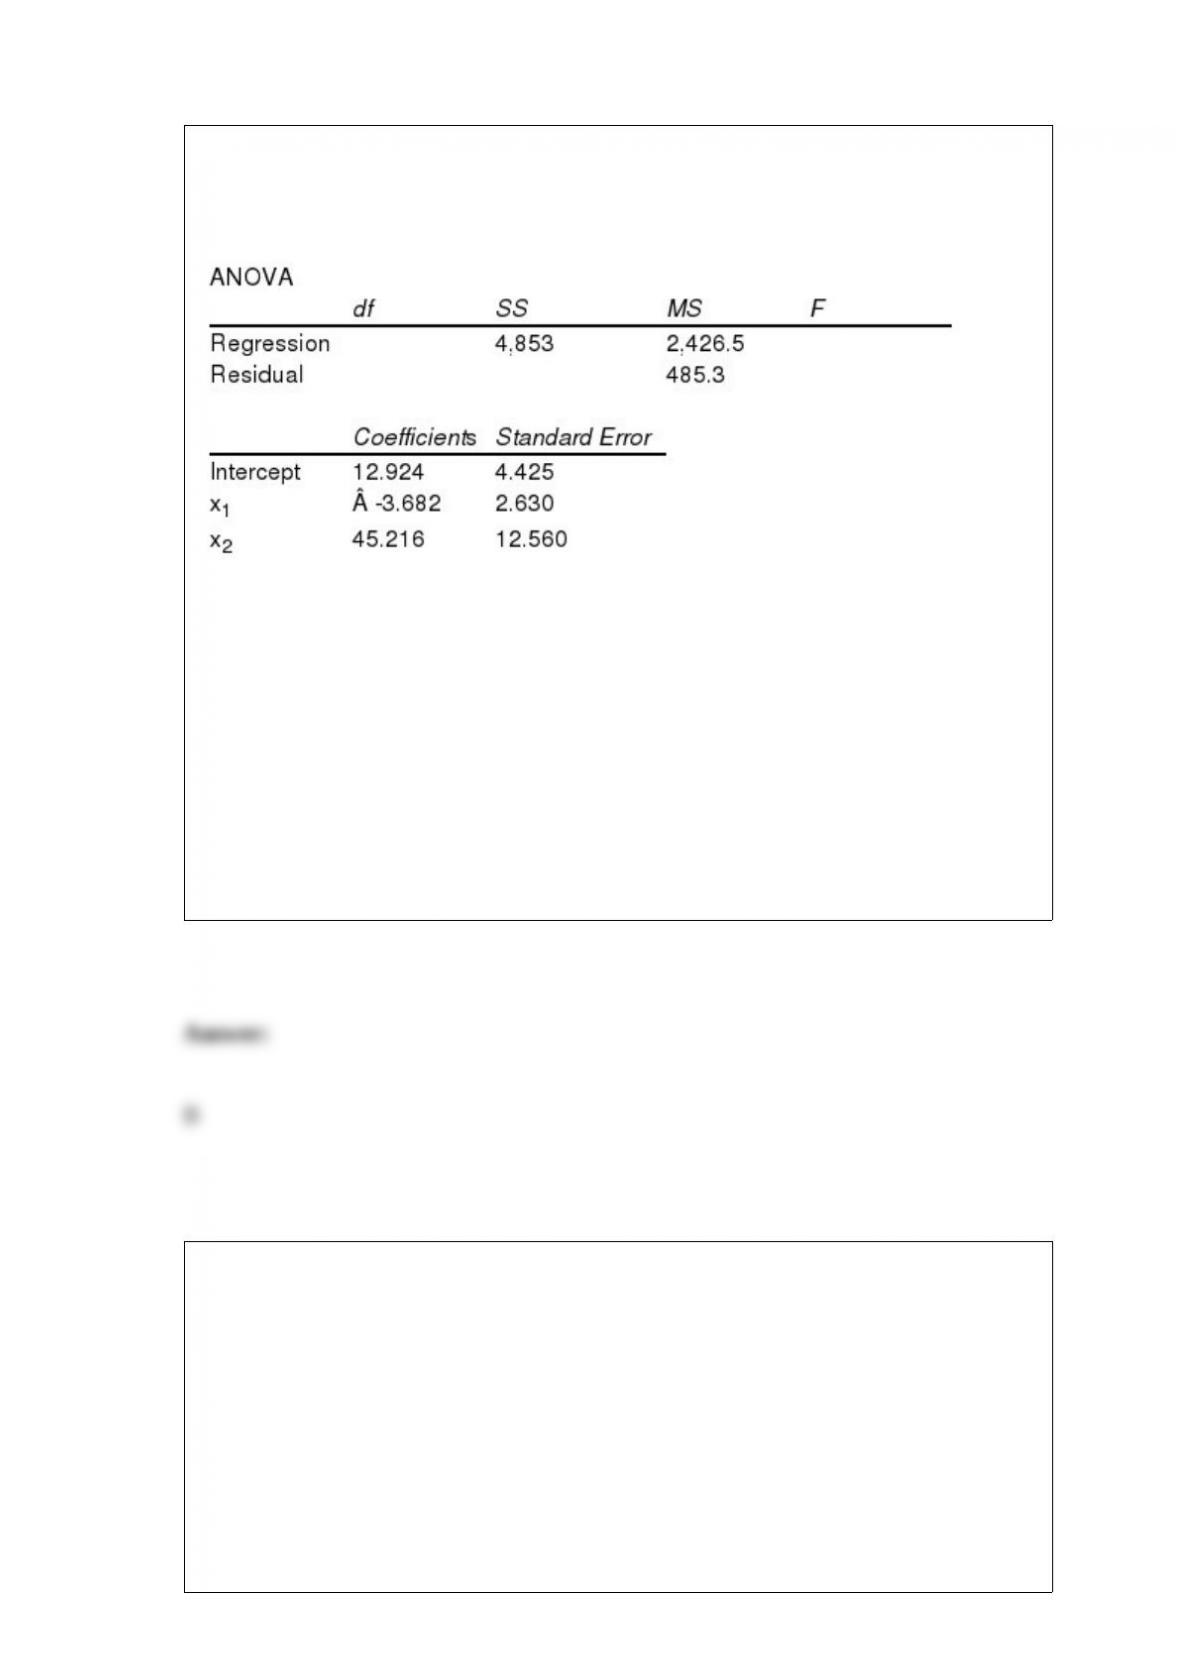
Exhibit 15-6
Below you are given a partial Excel output based on a sample of 16 observations.
Refer to Exhibit 15-6. Carry out the test of significance for the parameter 1 at the 1%
level. The null hypothesis should be
a. rejected
b. not rejected
c. revised
d. None of these alternatives is correct.
A production process produces 2% defective parts. A sample of five parts from the
production process is selected. What is the probability that the sample contains exactly
two defective parts?
a. 0.0004
b. 0.0038
c. 0.10
d. 0.02
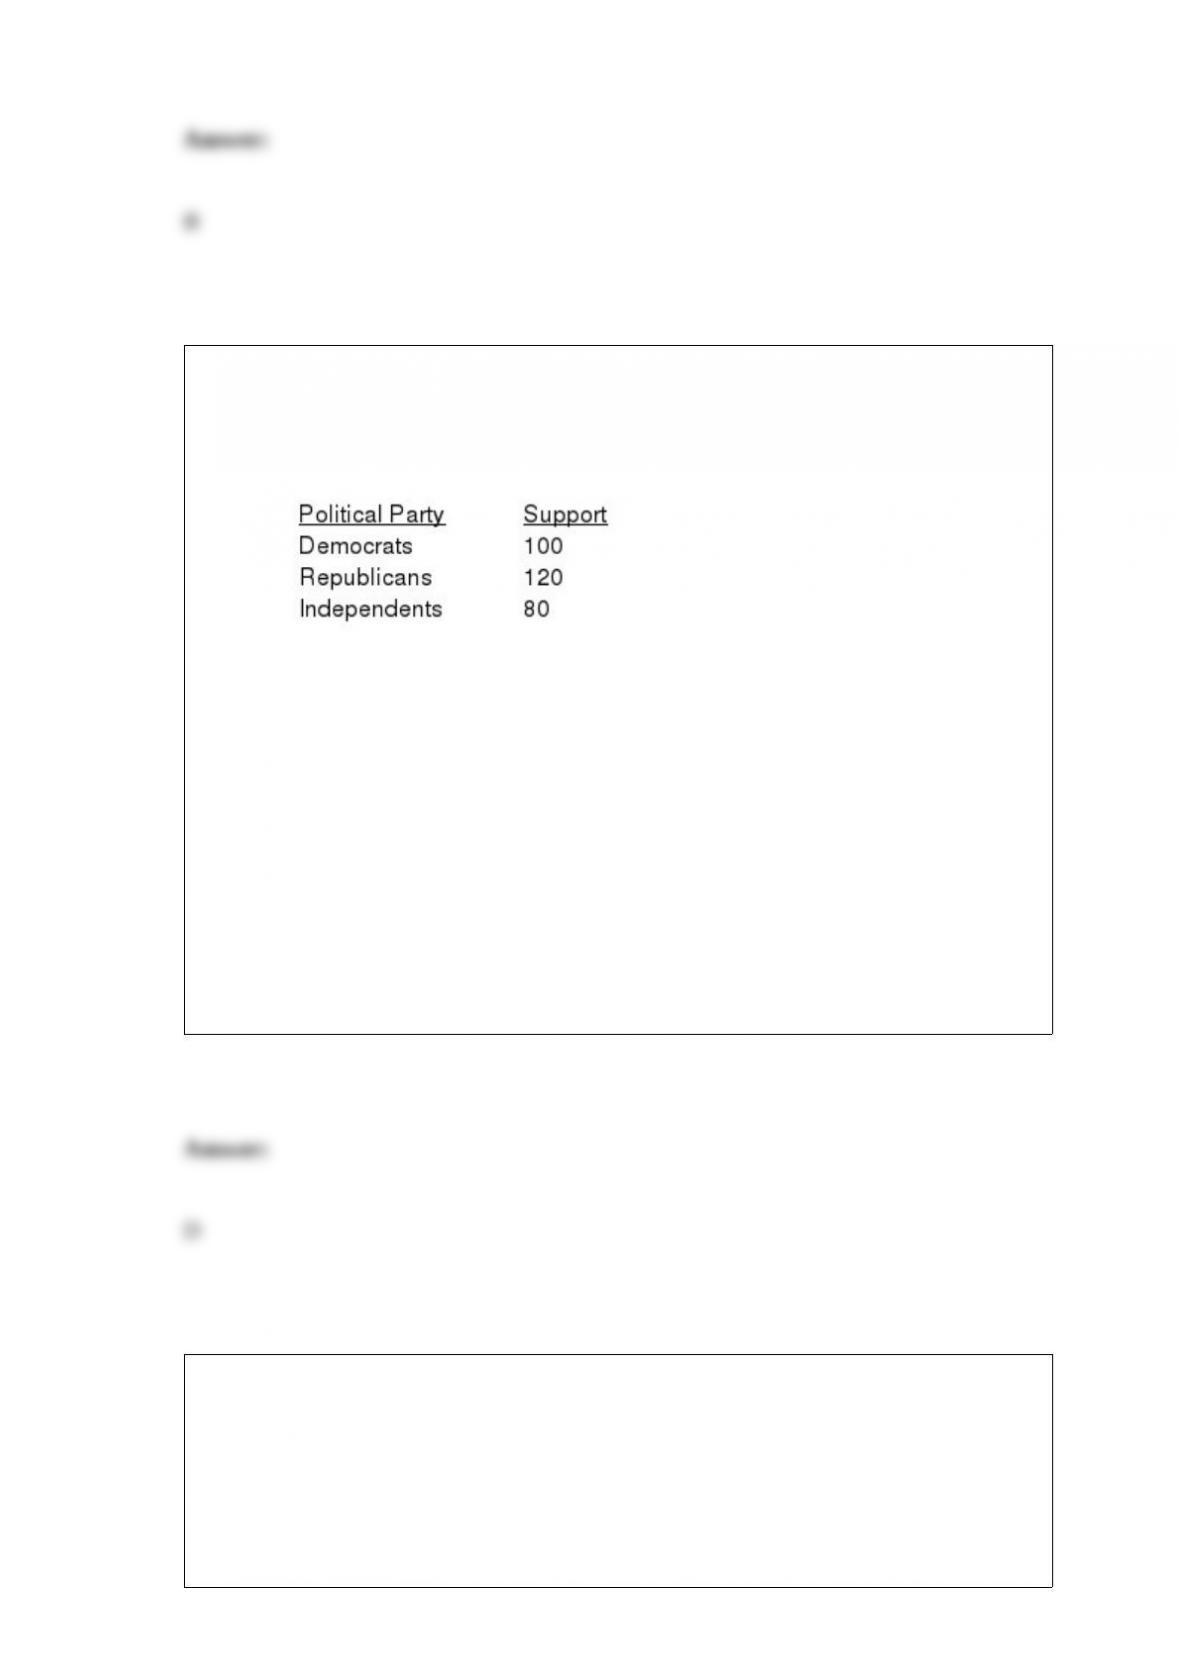
39. Exhibit 12-6
The following shows the number of individuals in a sample of 300 who indicated they
support the new tax proposal.
We are interested in determining whether or not the opinions of the individuals of the
three groups are uniformly distributed.
Refer to Exhibit 12-6. The expected frequency for each group is
a. 0.333
b. 0.50
c. 50
d. None of these alternatives is correct.
The time series pattern that exists when the data fluctuate around a constant mean is the
a. horizontal pattern
b. trend pattern
c. seasonal pattern
d. cyclical pattern
Exhibit 5-10
The probability that Pete will catch fish on a particular day when he goes fishing is 0.8.
Pete is going fishing 3 days next week.
Refer to Exhibit 5-10. The probability that Pete will catch fish on exactly one day is
a. .008
b. .096
c. .104
d. .8
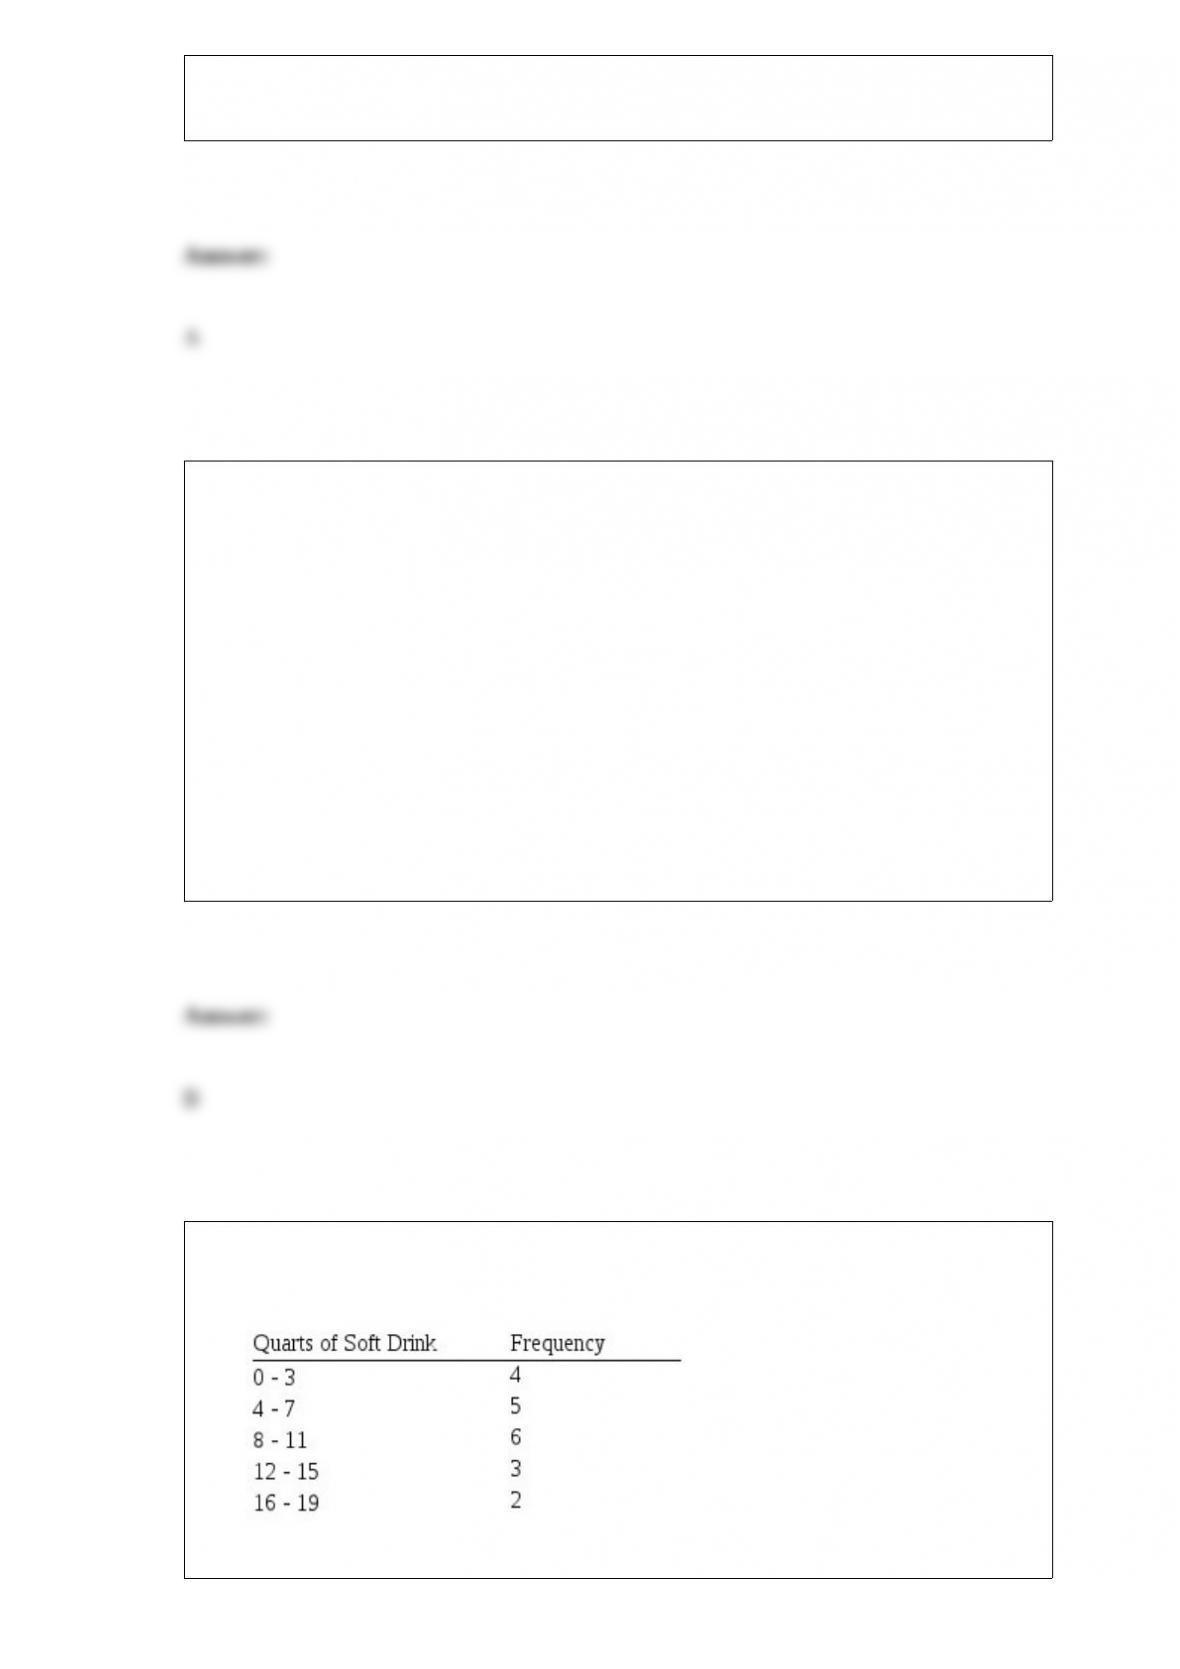
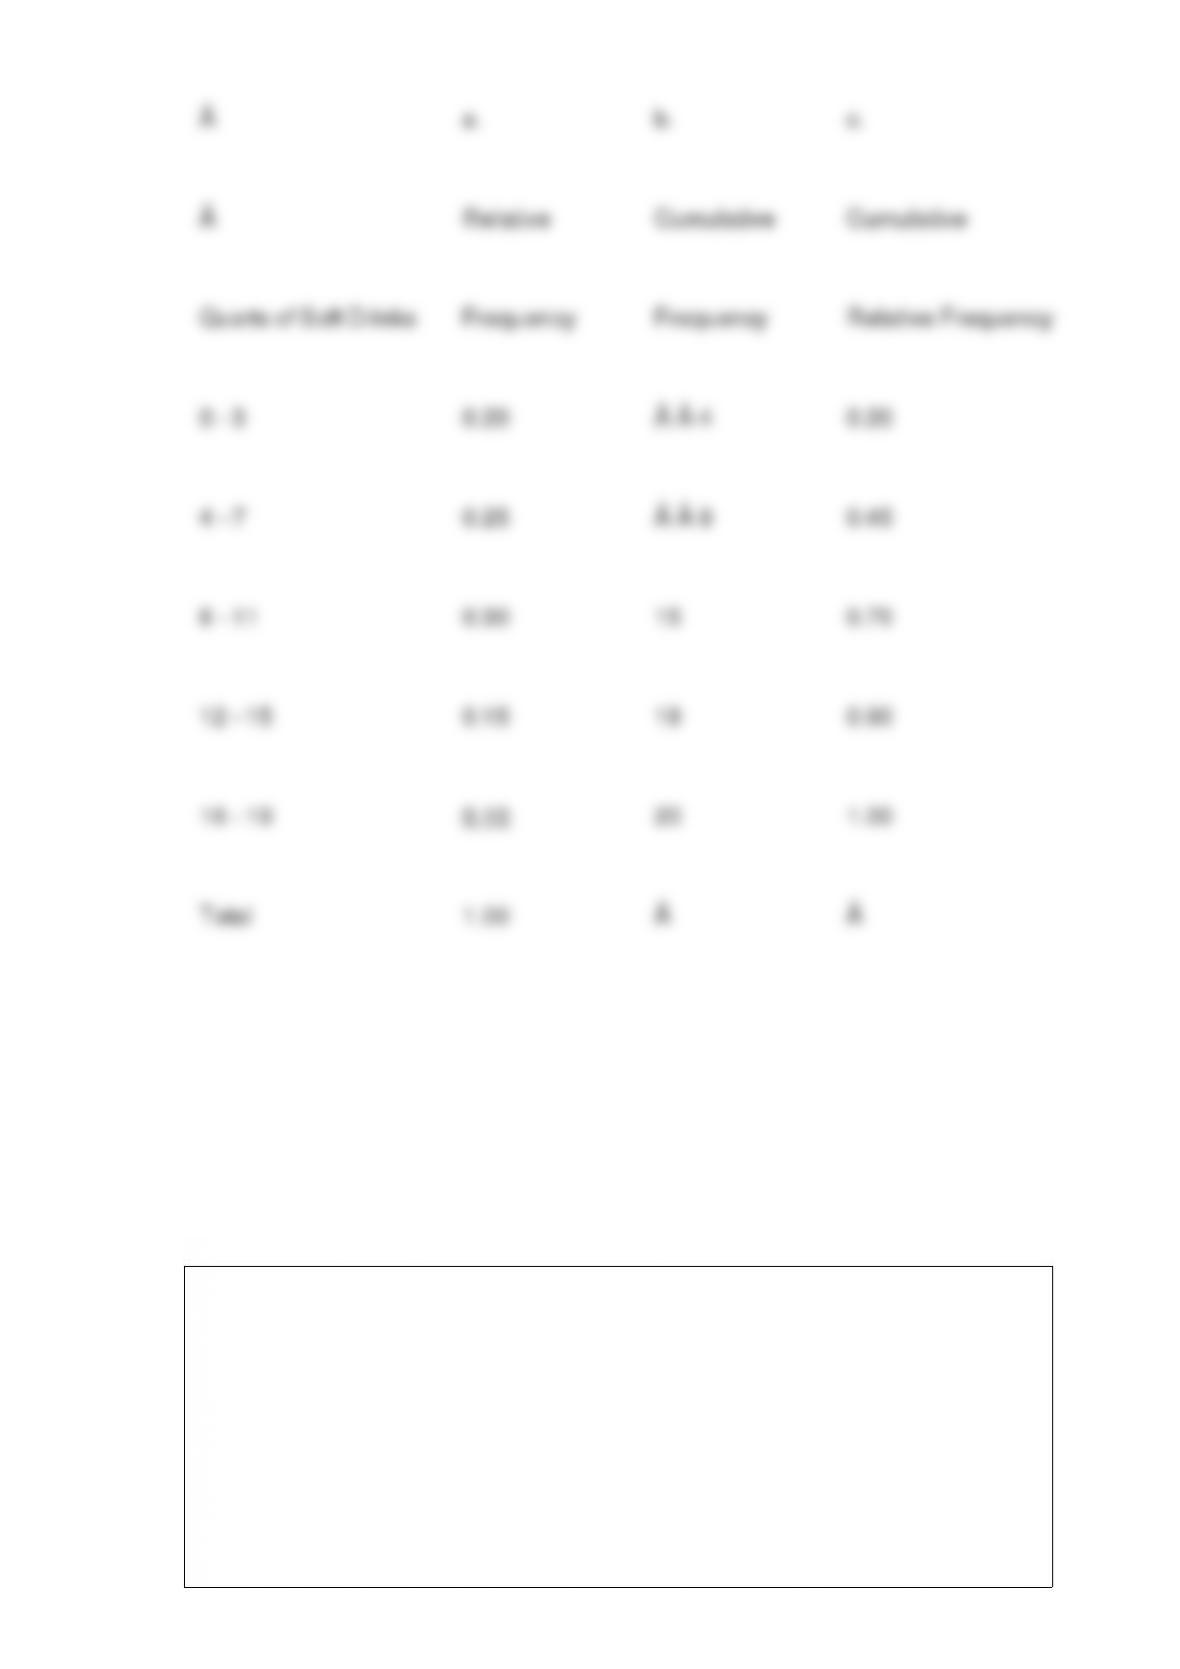
The frequency distribution below was constructed from data collected on
the quarts of soft drinks consumed per week by 20 students.
a. Construct a relative frequency distribution.

b. Construct a cumulative frequency distribution.
c. Construct a cumulative relative frequency distribution.
A number added to and subtracted from a point estimate to create an approximate 95%
confidence interval is known as
a. cluster of points
b. bound on sampling error
c. area point estimation
d. systematic sampling error

Facts and figures that are collected, analyzed and summarized for presentation and
interpretation are
a. data
b. variables
c. elements
d. Both variables and elements are correct.
The critical value of F at 95% confidence when there is a sample size of 21 for the
sample with the smaller variance, and there is a sample size of 9 for the sample with the
larger sample variance is
a. 2.45
b. 2.94
c. 2.37
d. 2.10