Exhibit 11-1
Last year, the standard deviation of the ages of the students at UA was 1.81 years.
Recently, a sample of 10 students had a standard deviation of 2.1 years. We are
interested in testing to see if there has been a significant change in the standard
deviation of the ages of the students at UA.
Refer to Exhibit 11-1. The test statistic is
a. 14.2
b. 12.1
c. 3.28
d. 2.1
__________ consist(s) of making a series of inspections and measurements to
determine whether quality standards are being met.
a. Quality control
b. Quality engineering
c. Quality assurance
d. Both quality control and quality engineering are correct.
Connie Harris, in charge of office supplies at First Capital Mortgage Corp., would like
to predict the quantity of paper used in the office photocopying machines per month.
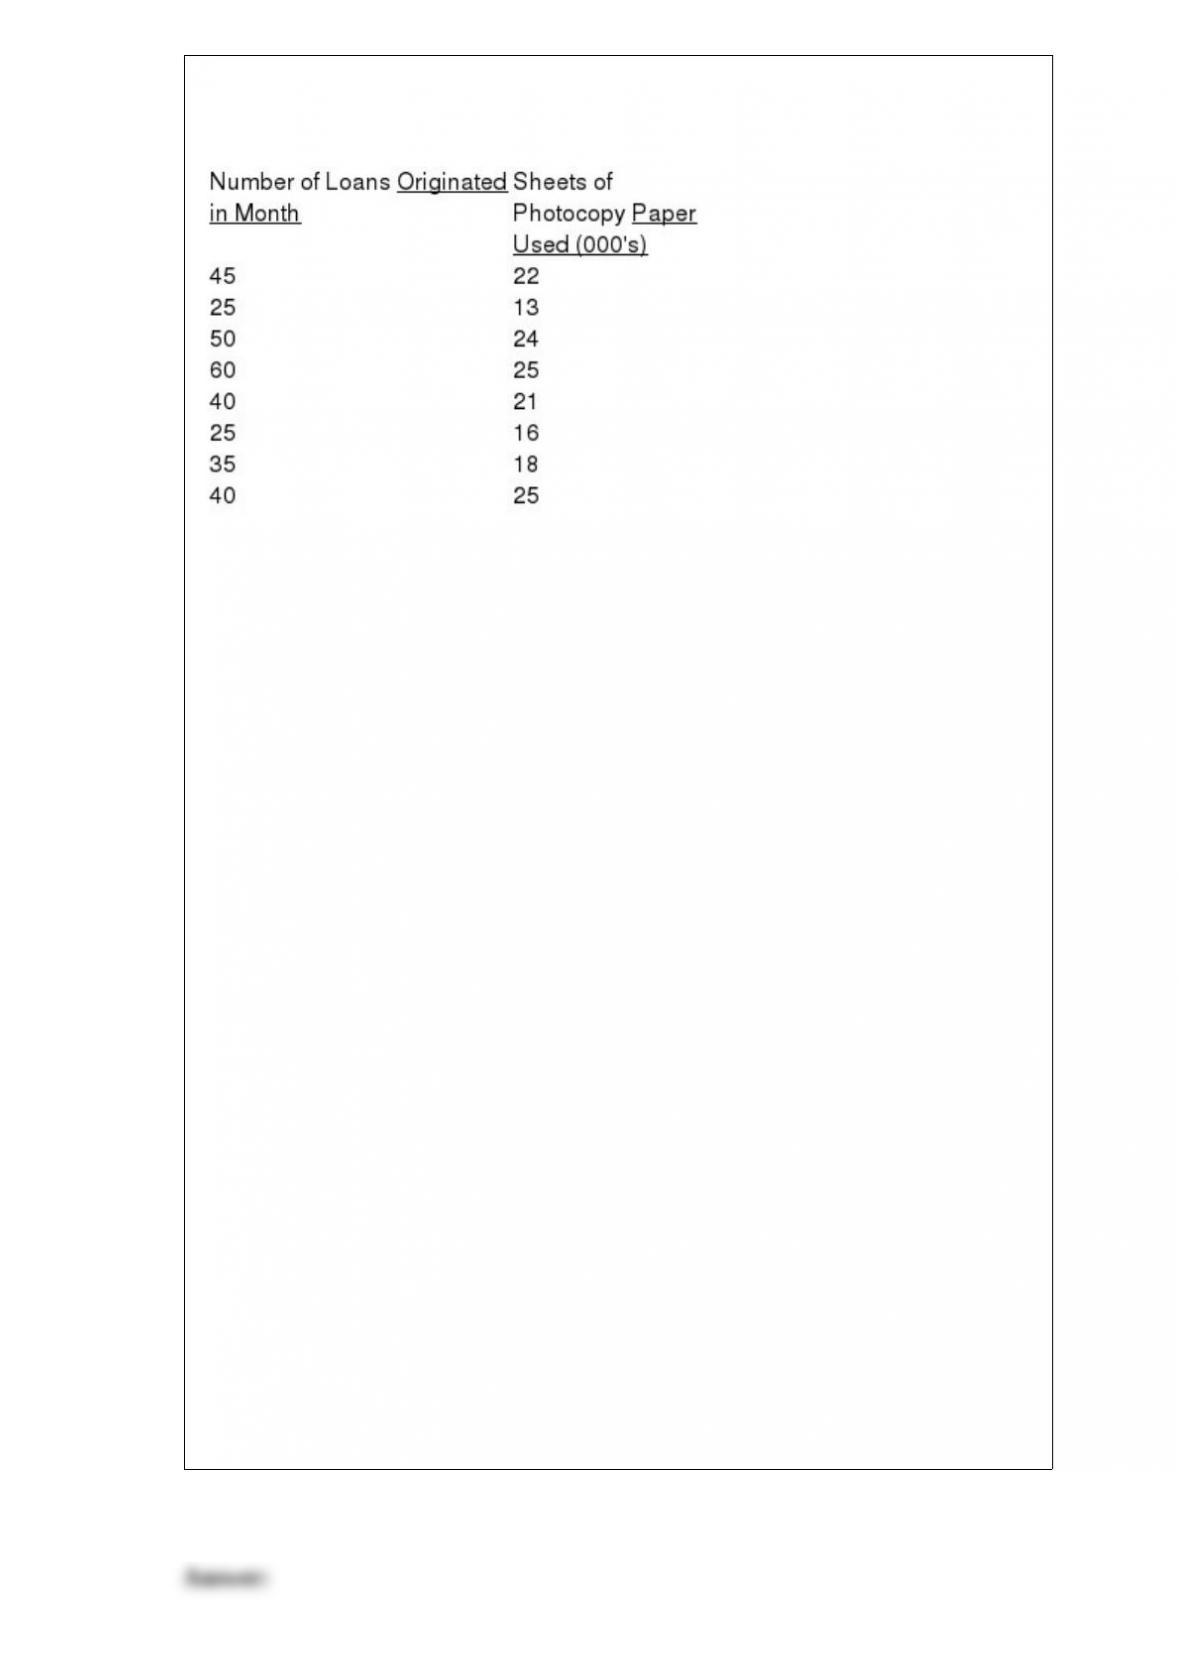
She believes that the number of loans originated in a month influence the volume of
photocopying performed. She has compiled the following recent monthly data:
a. Develop the least-squares estimated regression equation that relates sheets of
photocopy paper used to loans originated.
b. Use the regression equation developed in part (a) to forecast the amount of paper
used in a month when 42 loan originations are expected.
c. Compute SSE, SST, and SSR.
d. Compute the coefficient of determination r2. Comment on the goodness of fit.
e. Compute the correlation coefficient.
f. Compute the mean square error MSE.
g. Compute the standard error of the estimate.
h. Compute the estimated standard deviation of b1.
i. Use the t test to test the following hypothesis
1 = 0 at
= .05.
j. Develop a 95% confidence interval estimate for
1 to test the hypothesis
1 = 0.
k. Use the F test to test the hypothesis
1 = 0 at a .05 level of significance.
l. Develop a 95% confidence interval estimate of the mean number of sheets of paper
used when 38 mortgages are originated.
m. Develop a 95% prediction interval estimate for the number of sheets of paper used
when 38 mortgages are originated.
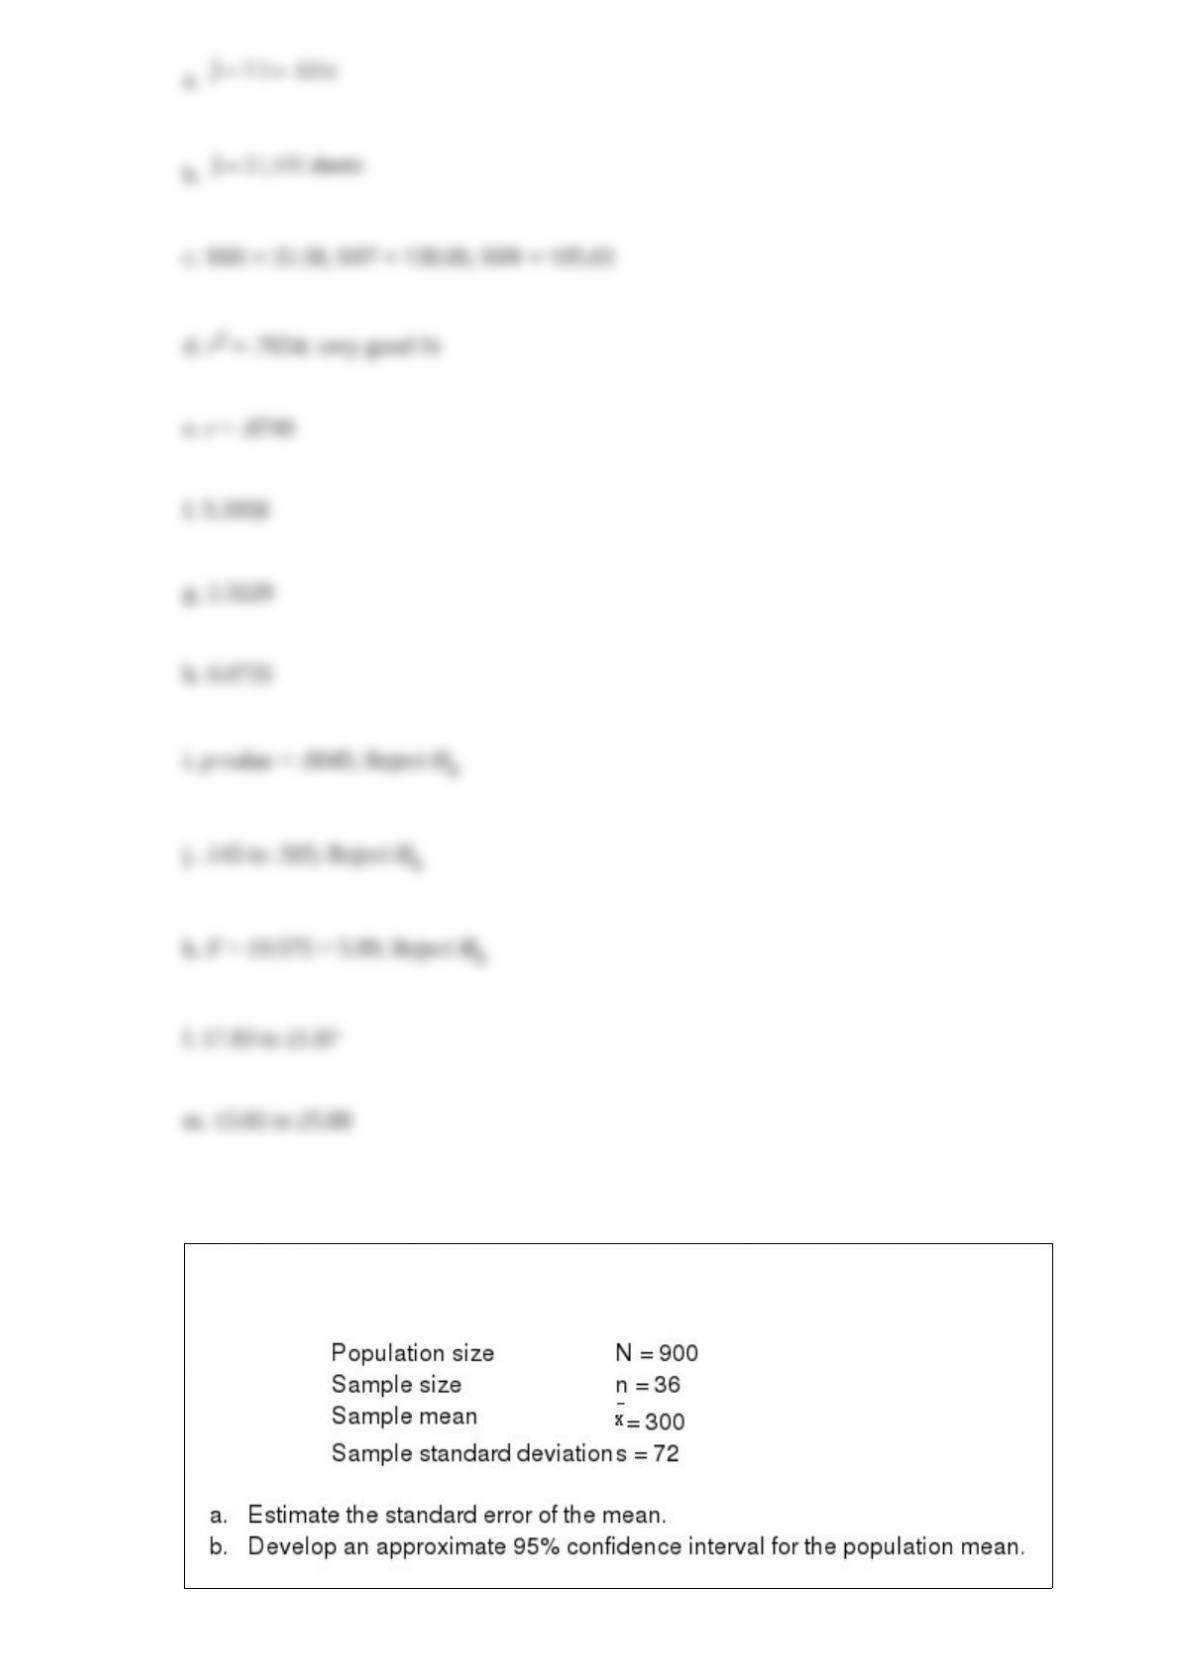
Assume simple random sampling has been used, and the following information was
obtained.

A measure of the average value of a random variable is called a(n)
a. variance
b. standard deviation
c. expected value
d. None of the answers is correct.
Exhibit 13-4
In a completely randomized experimental design involving five treatments, thirteen
observations were recorded for each of the five treatments. The following information
is provided.
SSTR = 200 (Sum Square Between Treatments)
SST = 800 (Total Sum Square)
Refer to Exhibit 13-4. The number of degrees of freedom corresponding to between
treatments is
a. 60
b. 59
c. 5
d. 4

Consider a Poisson probability distribution in a process with an average of 3 flaws
every 100 feet. Find the probability of
a. no flaws in 100 feet
b. 2 flaws in 100 feet
c. 1 flaws in 150 feet
d. 3 or 4 flaws in 150 feet
The price of a particular brand of jeans has a mean of $37.99 and a standard deviation
of $7. A sample of 49 pairs of jeans is selected. Use Excel to answer the following
questions.
a. What is the probability that the sample of jeans will have a mean price less than $40?
b. What is the probability that the sample of jeans will have a mean price between $38
and $39?
c. What is the probability that the sample of jeans will have a mean price within $3 of
the population mean?
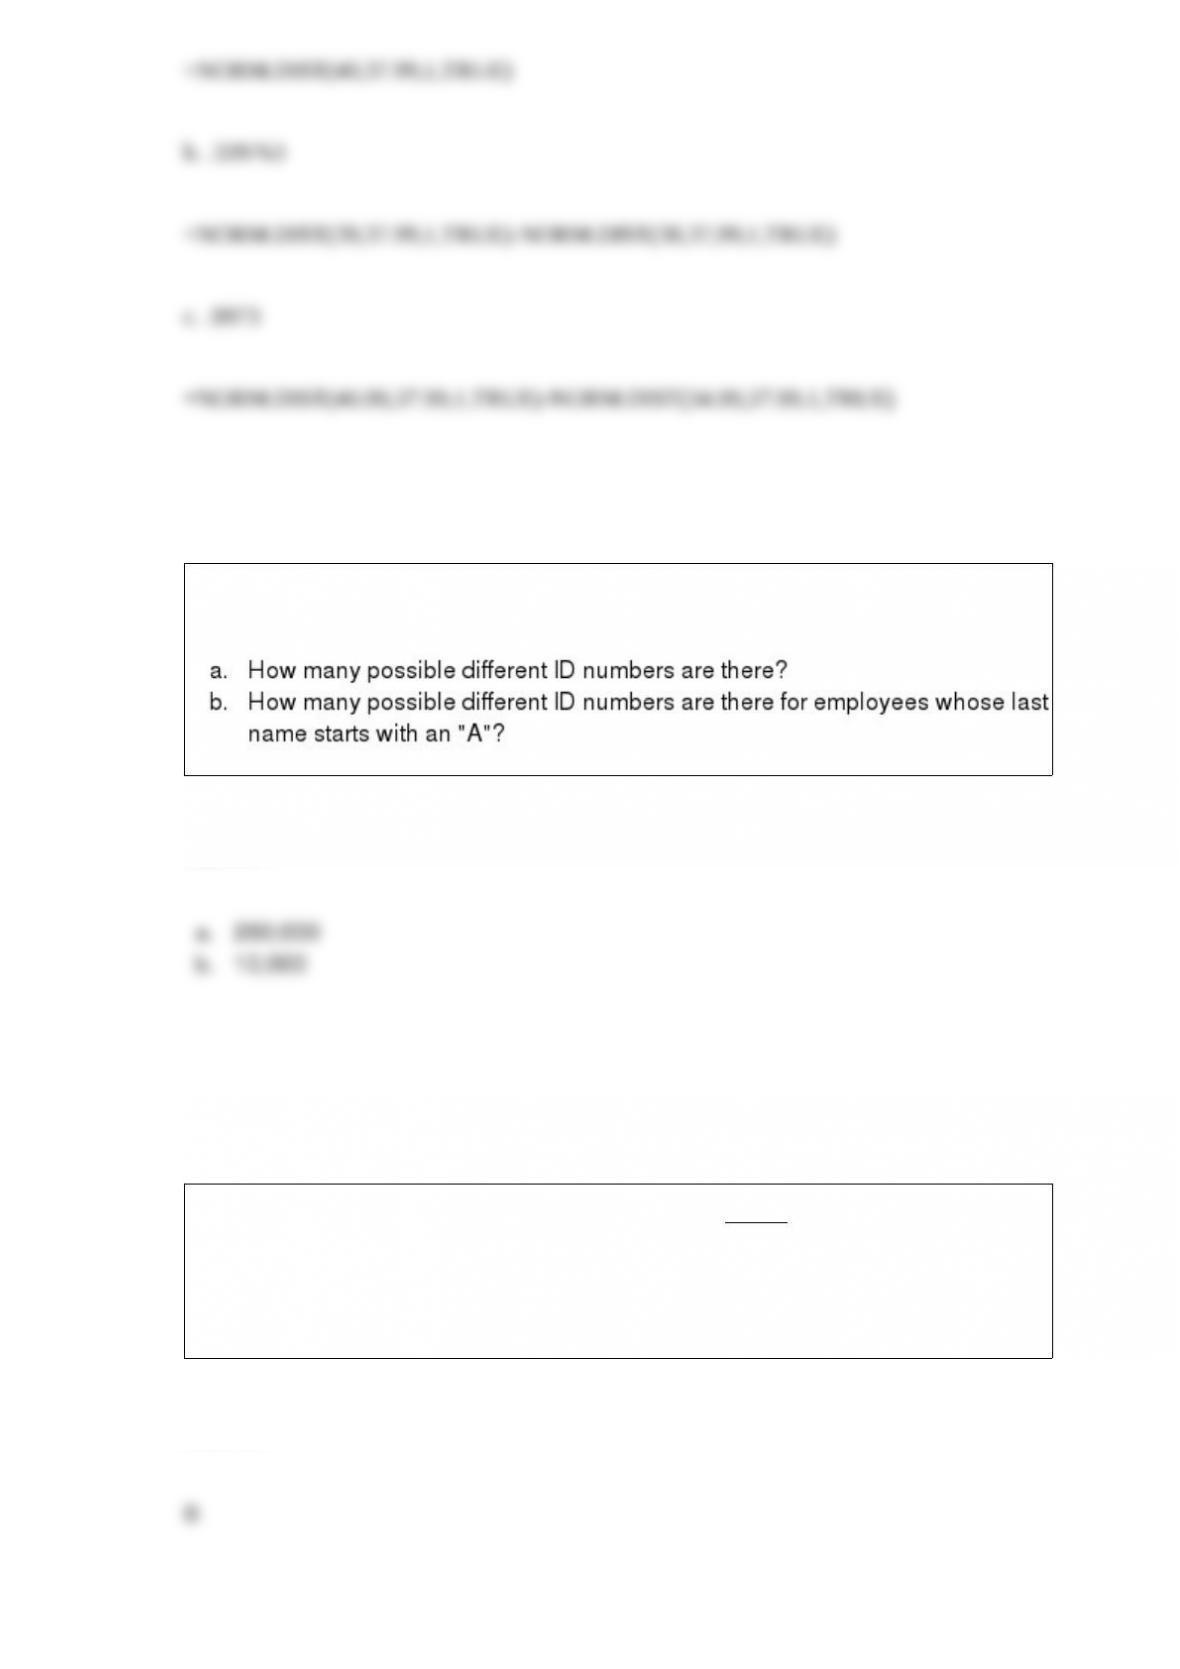
All the employees of ABC Company are assigned ID numbers. The ID number consists
of the first letter of an employee’s last name, followed by four numbers.
All of the following are true about time series methods except
a. they discover a pattern in historical data and project it into the future
b. they identify a set of related independent, or explanatory, variables
c. they assume that the pattern of the past will continue into the future
d. their forecasts are based solely on past values of the variable or past forecast errors
A regression analysis was applied in order to determine the relationship between a
dependent variable and 14 independent variables. The following information was
obtained from the regression analysis.
R Square = 0.70
SSR = 7,000
Total number of observations n = 45
The summaries of data, which may be tabular, graphical, or numerical, are referred to as
a. inferential statistics
b. descriptive statistics
c. statistical inference
d. report generation
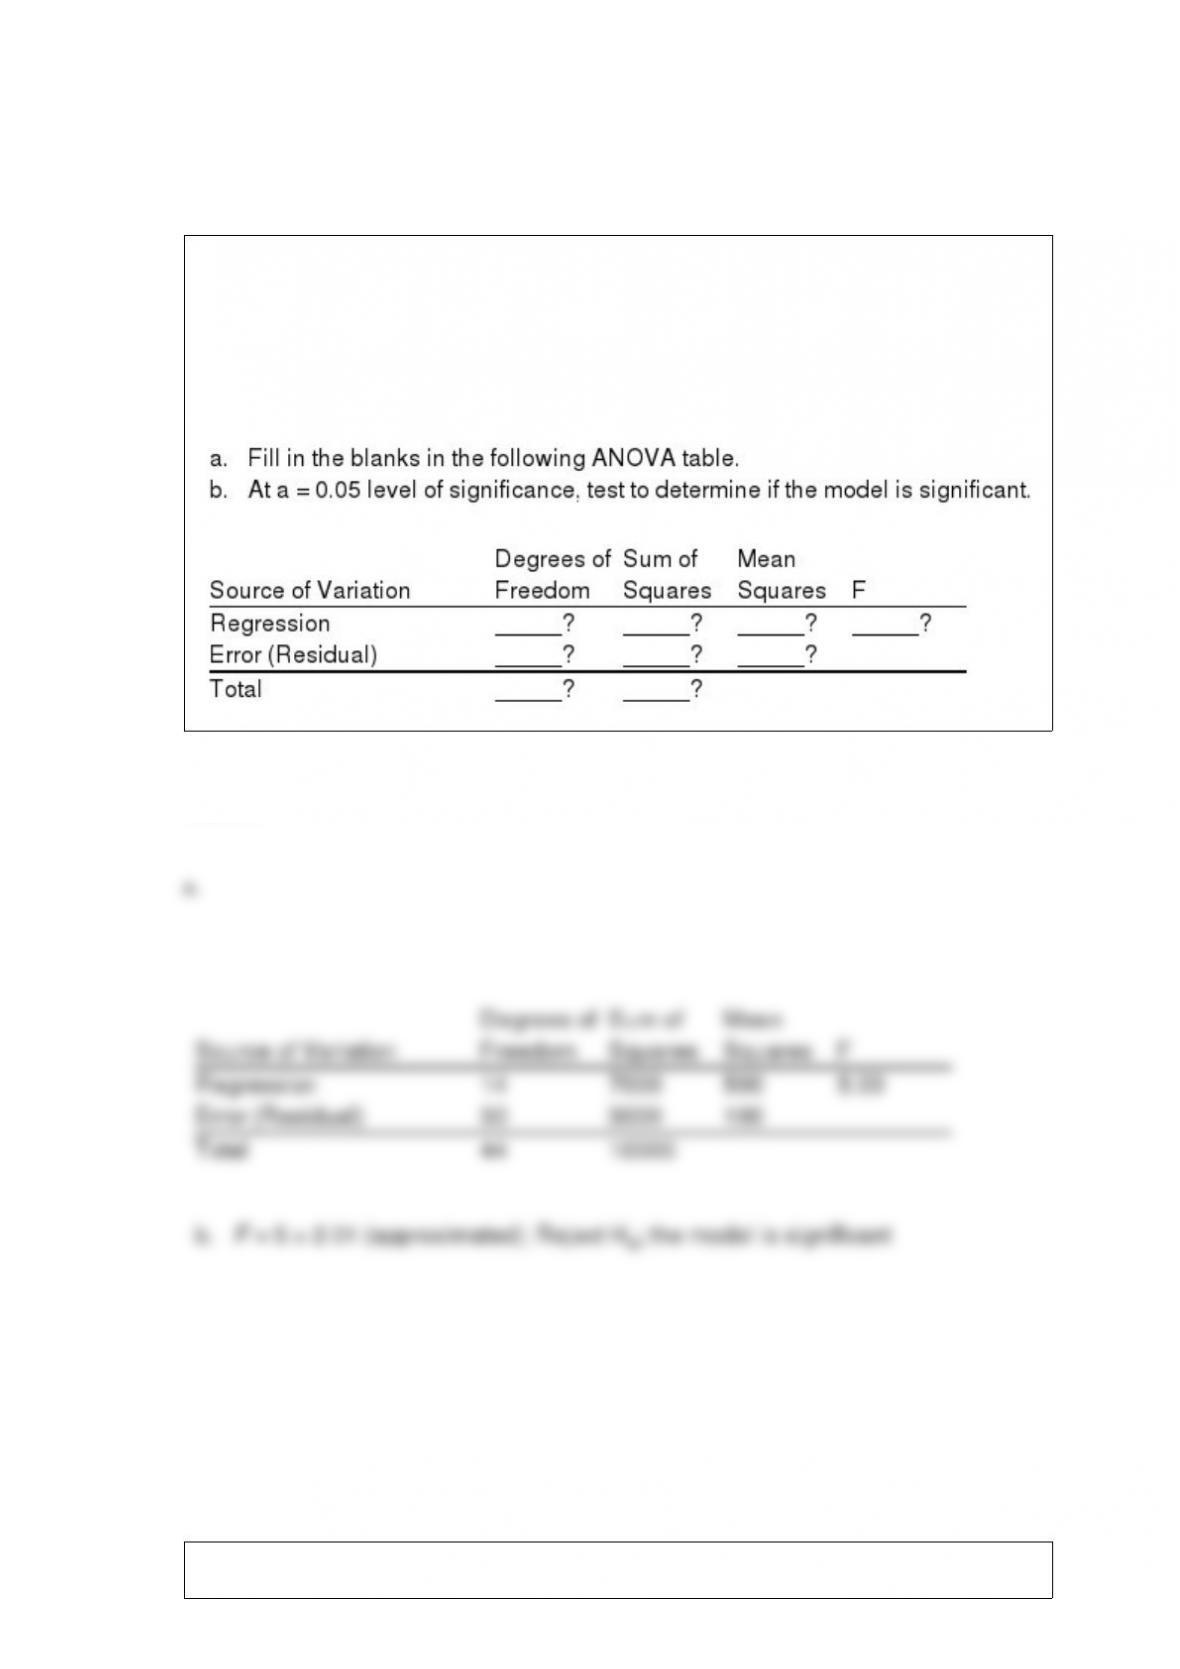
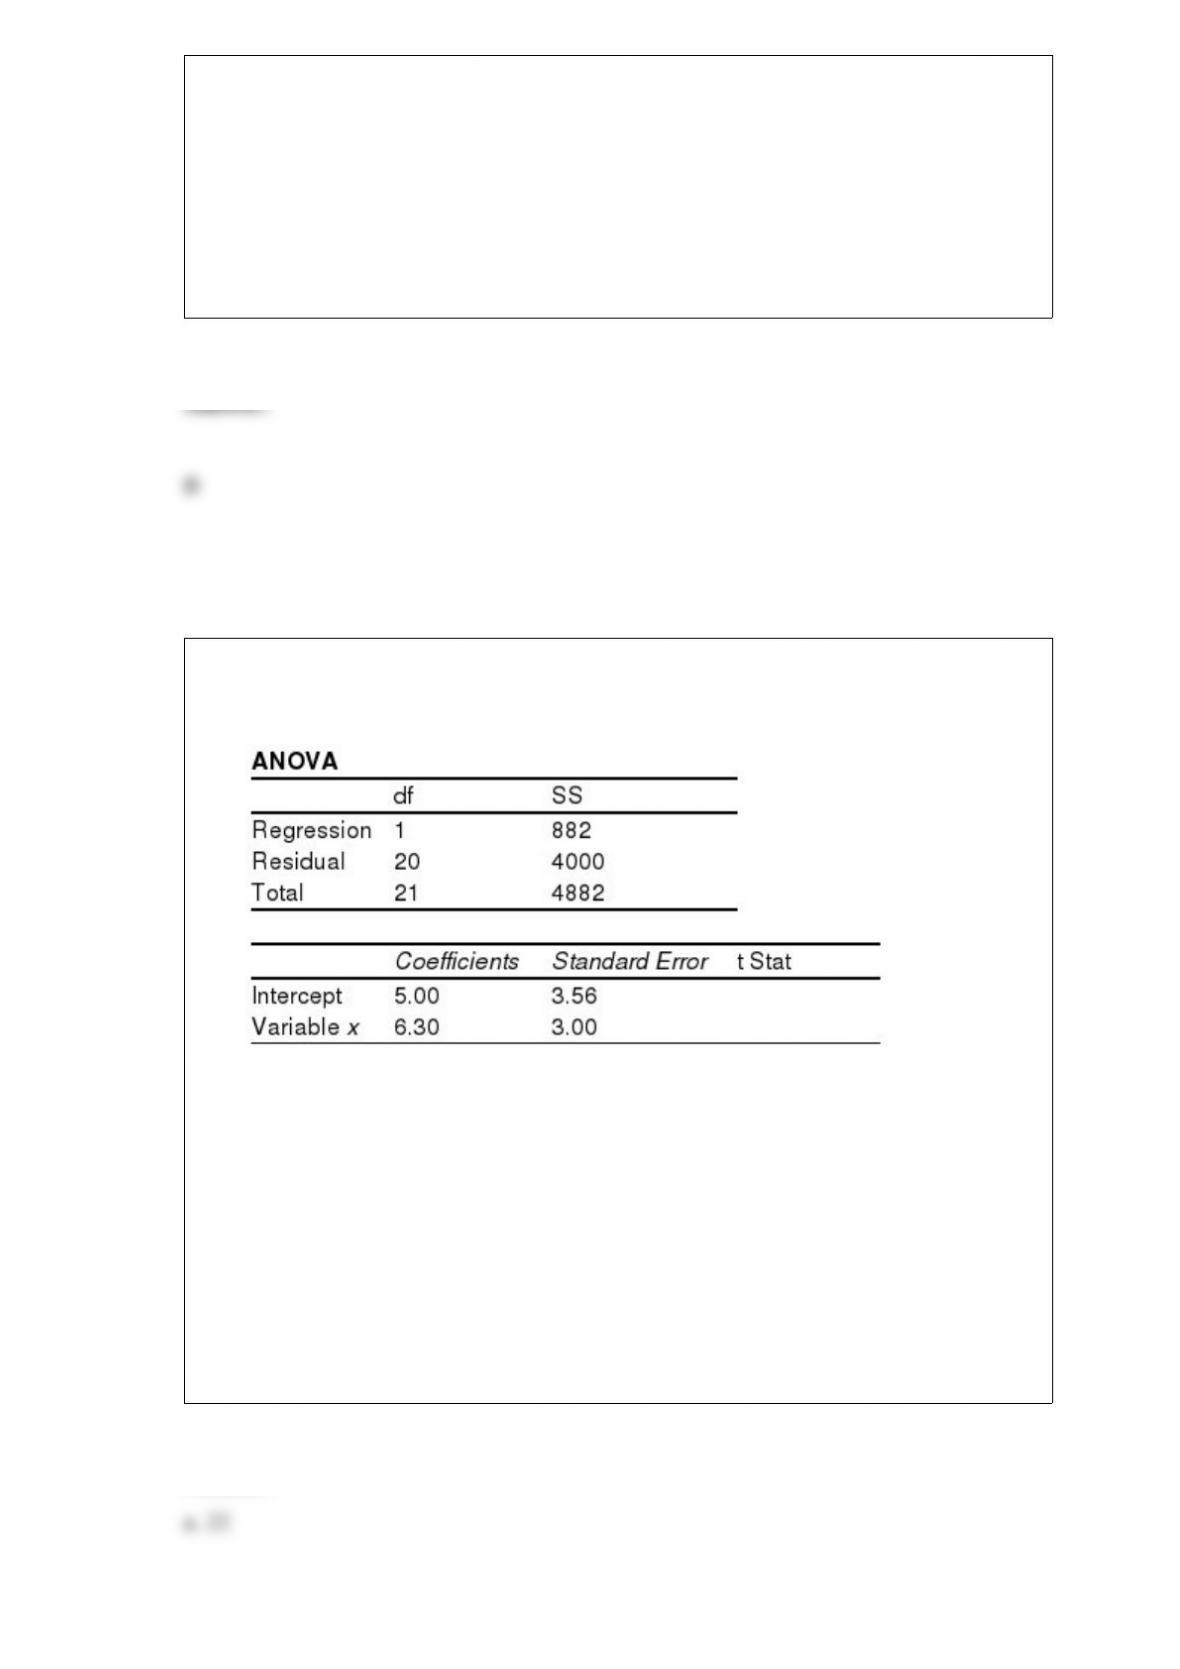
Shown below is a portion of a computer output for regression analysis relating y
(dependent variable) and x (independent variable).
a. What has been the sample size for the above?
b. Perform a t-test and determine whether or not x and y are related. Use 0.05.
c. Perform an F-test and determine whether or not x and y are related. Use 0.05.
d. Compute the coefficient of determination.
e. Interpret the meaning of the value of the coefficient of determination that you found
in d. Be very specific.
The process of allocating the total sum of squares and degrees of freedom is called
a. factoring
b. blocking
c. replicating
d. partitioning
In situations where you need to compare forecasting methods for different time periods,
the most appropriate accuracy measure is
a. mean error
b. mean absolute error
c. mean squared error
d. mean absolute percentage error
47. When working backward through a decision tree, the analyst should
a. compute the expected value at each chance node
b. select the best chance branch at each chance node
c. select the best chance branch at each decision node
d. compute the expected value at each decision node
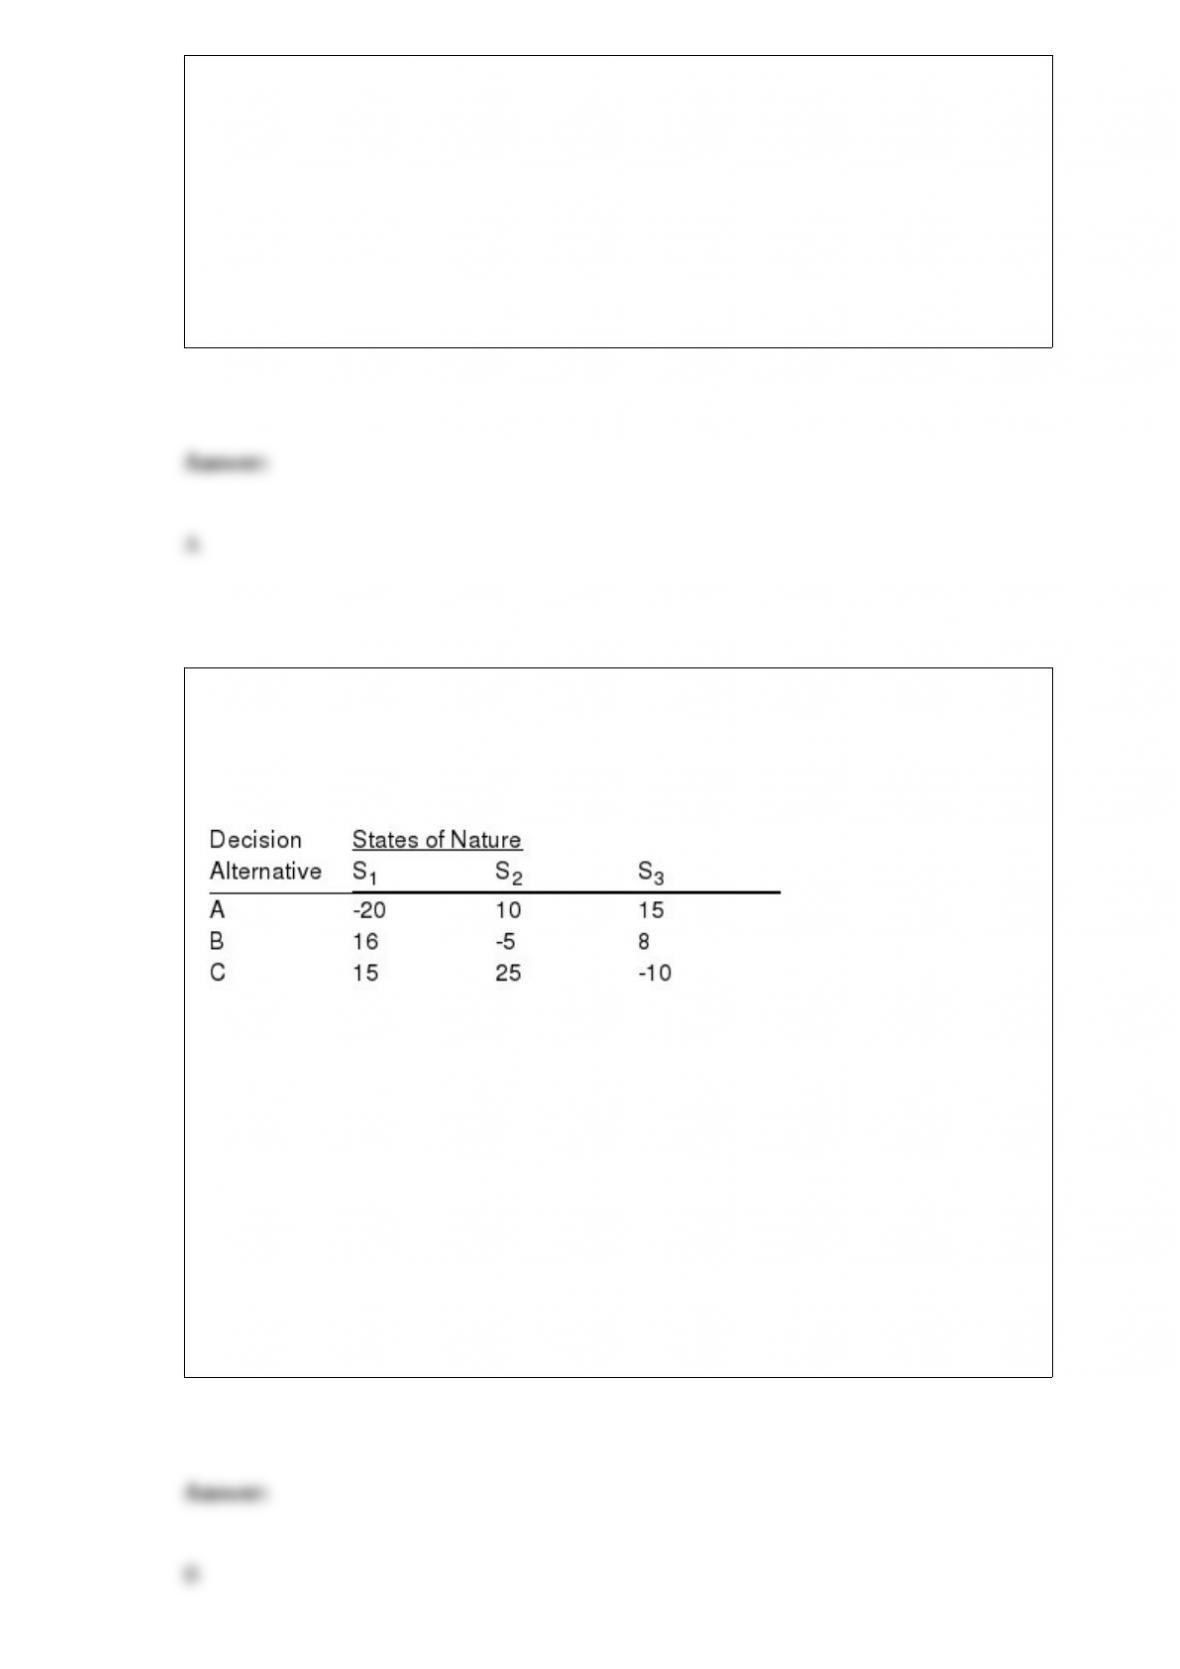
Exhibit 20-5
Below you are given a payoff table involving three states of nature and three decision
alternatives.
The probability of occurrence of S1 is 0.2 and the probability of occurrence of S2 is 0.3.
Refer to Exhibit 20-5. The expected value of perfect information is
a. 18.2
b. 11.7
c. 51
d. 37
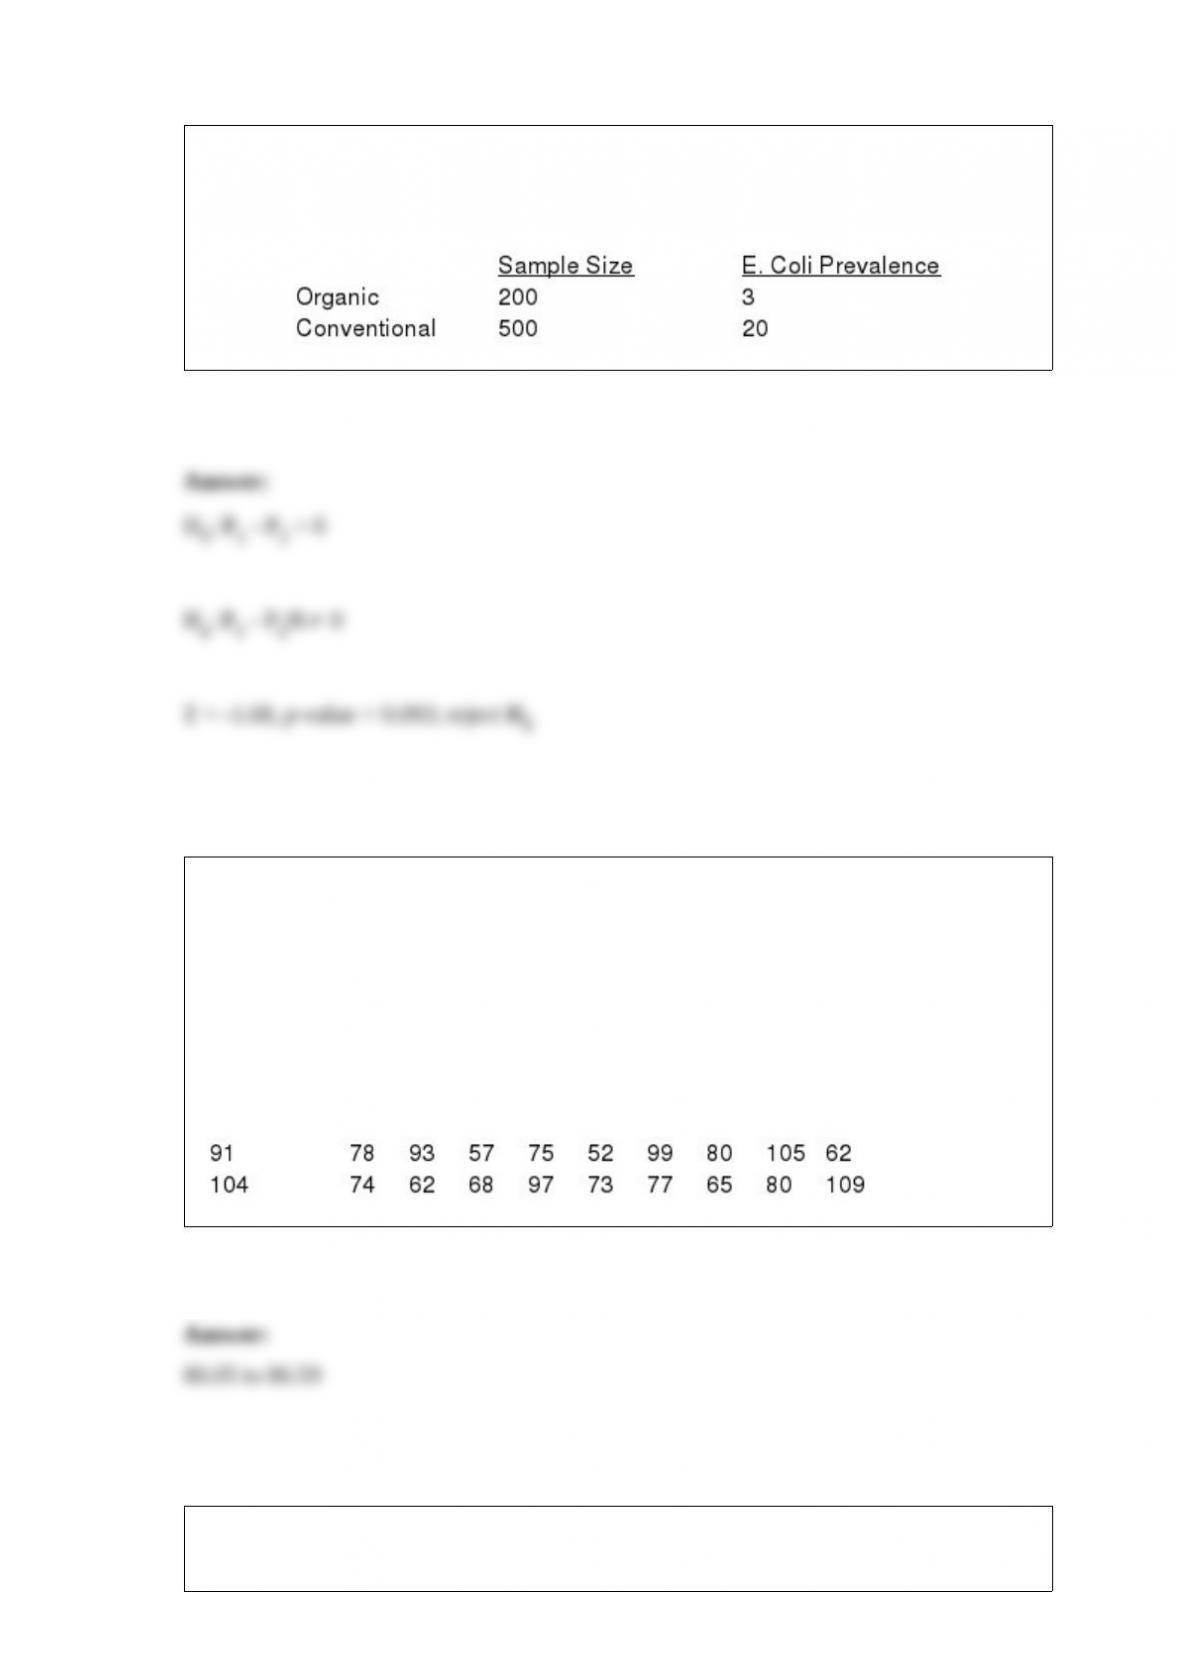
A comparative study of organic and conventionally grown produce was checked for the
presence of E. coli. Results are summarized below. Is there a significant difference in
the proportion of E. Coli in organic vs. conventionally grown produce? Test at = 0.10.
The manager of Hudson Auto Repair wants to advertise one price for an engine
tune-up, with parts included. Before he decides the price to advertise, he needs a good
estimate of the average cost of tune-up parts. A sample of 20 customer invoices for
tune-ups has been taken and the costs of parts, rounded to the nearest dollar, are
listed below.
Provide a 90% confidence interval estimate of the mean cost of parts per tune-up for
all of the tune-ups performed at Hudson Auto Repair. We will assume this population
to be normally distributed.
The standard deviation of the daily temperatures in Honolulu last year was 3.2 degrees
Fahrenheit. A random sample of 19 days resulted in a standard deviation of 4 degrees
Fahrenheit. Has there been a significant change in the variance of the temperatures?
Use = 0.02.
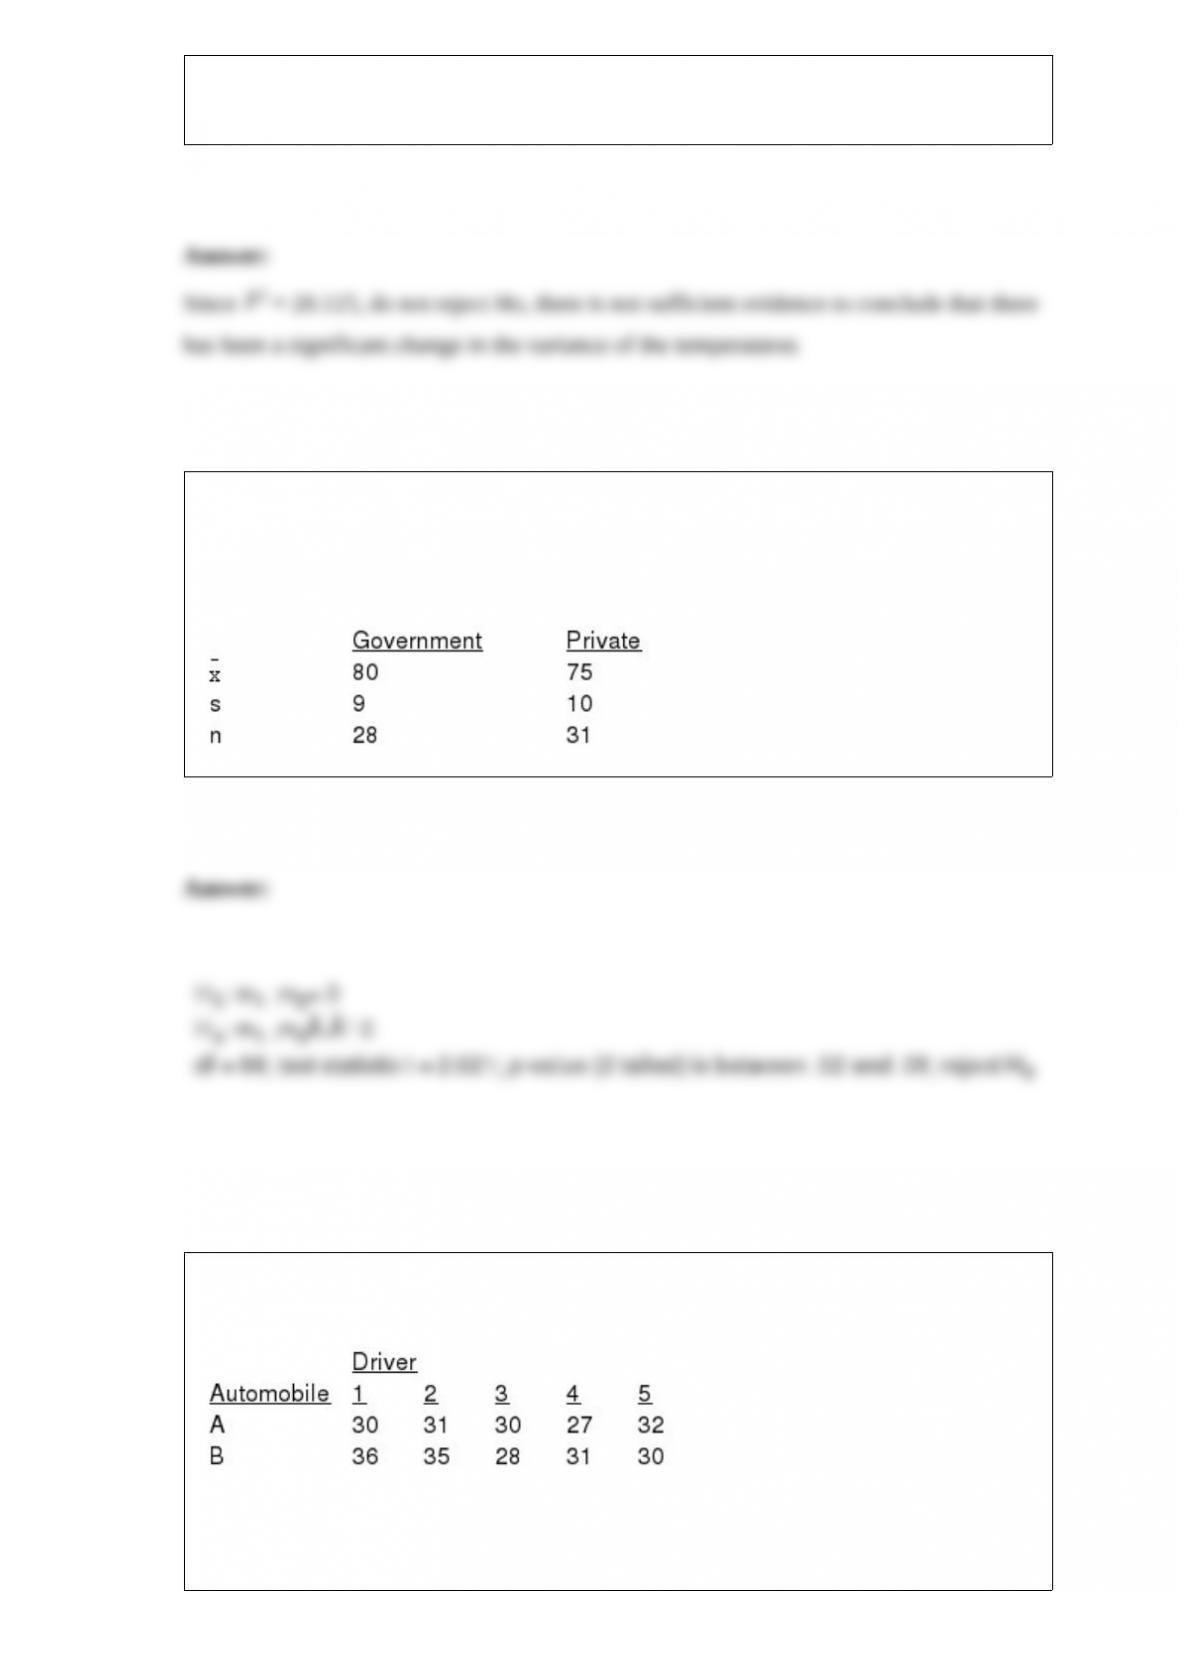
Independent random samples of managers’ yearly salaries (in $1000) taken from
governmental and private organizations provided the following information. At 95%
confidence, test to determine if there is a significant difference between the average
salaries of the managers in the two sectors.
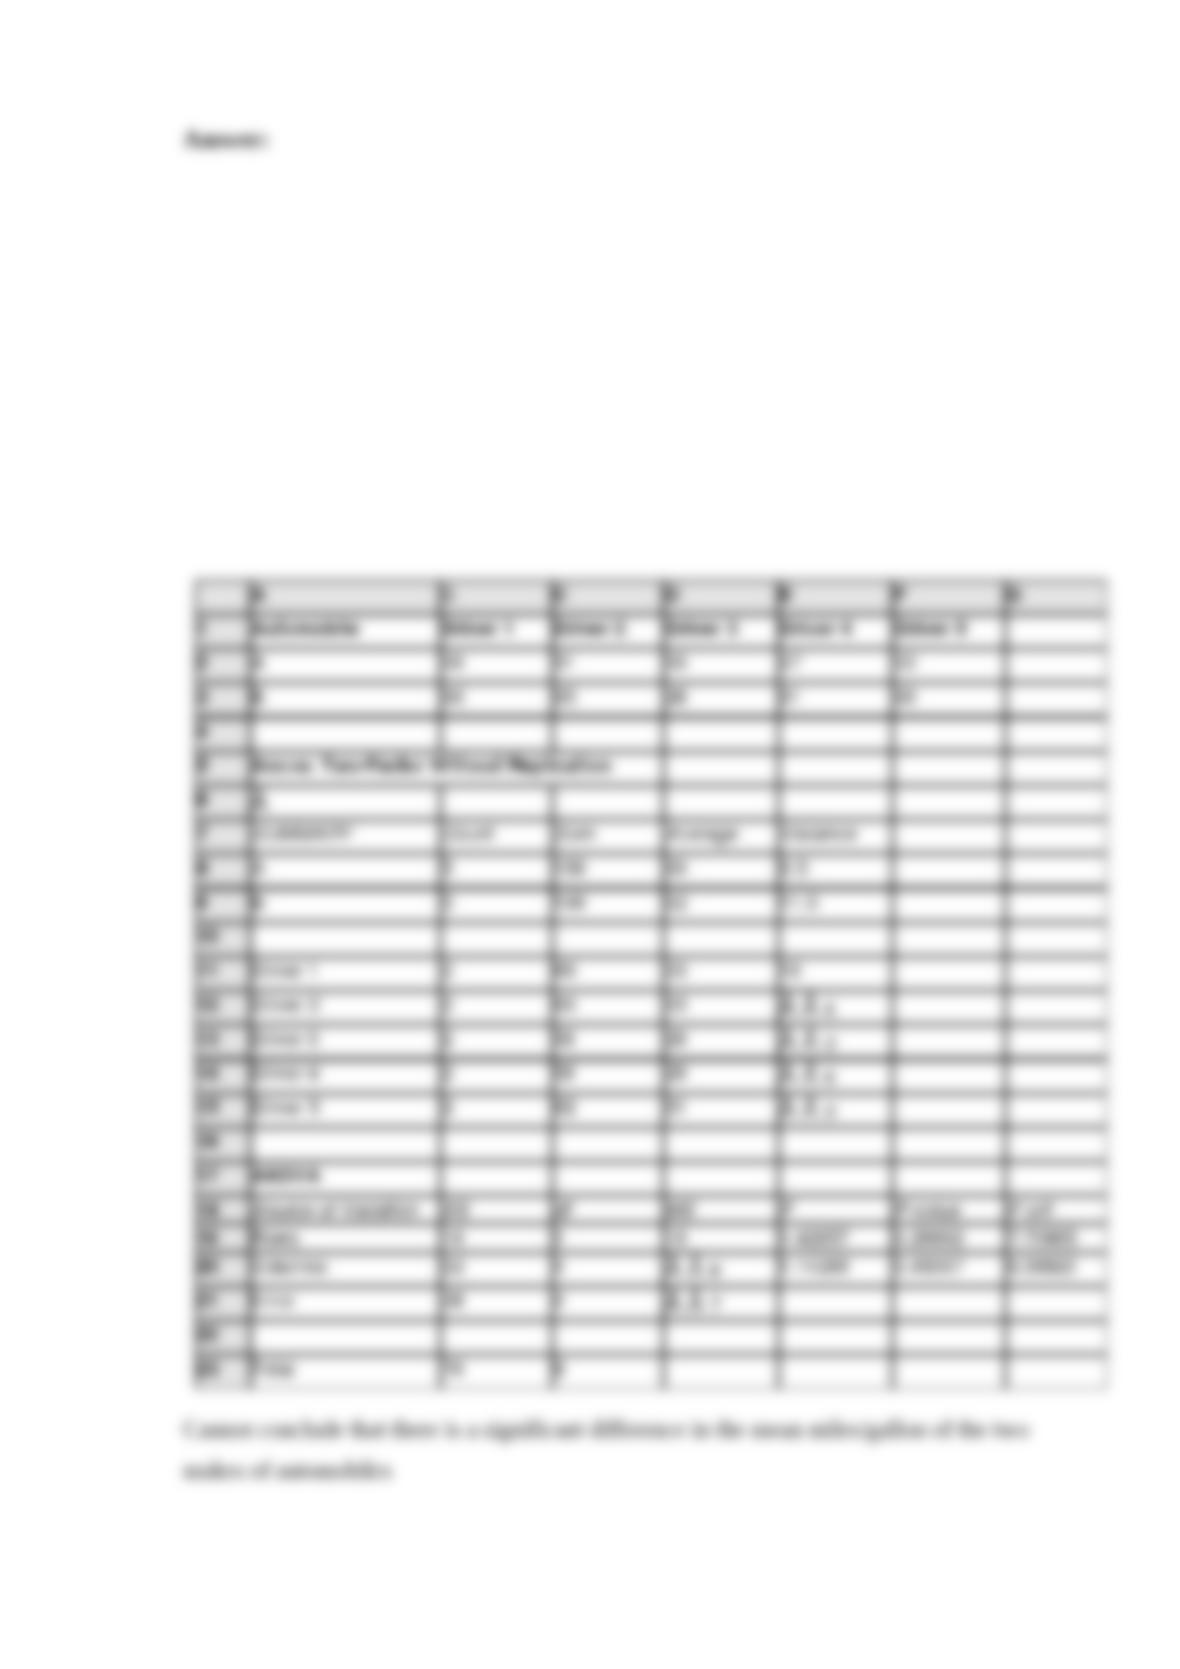
Five drivers were selected to test drive 2 makes of automobiles. The following table
shows the number of miles per gallon for each driver driving each car.
Consider the makes of automobiles as treatments and the drivers as blocks, use Excel to
test to see if there is any difference in the miles/gallon of the two makes of automobiles.
Let = .05.