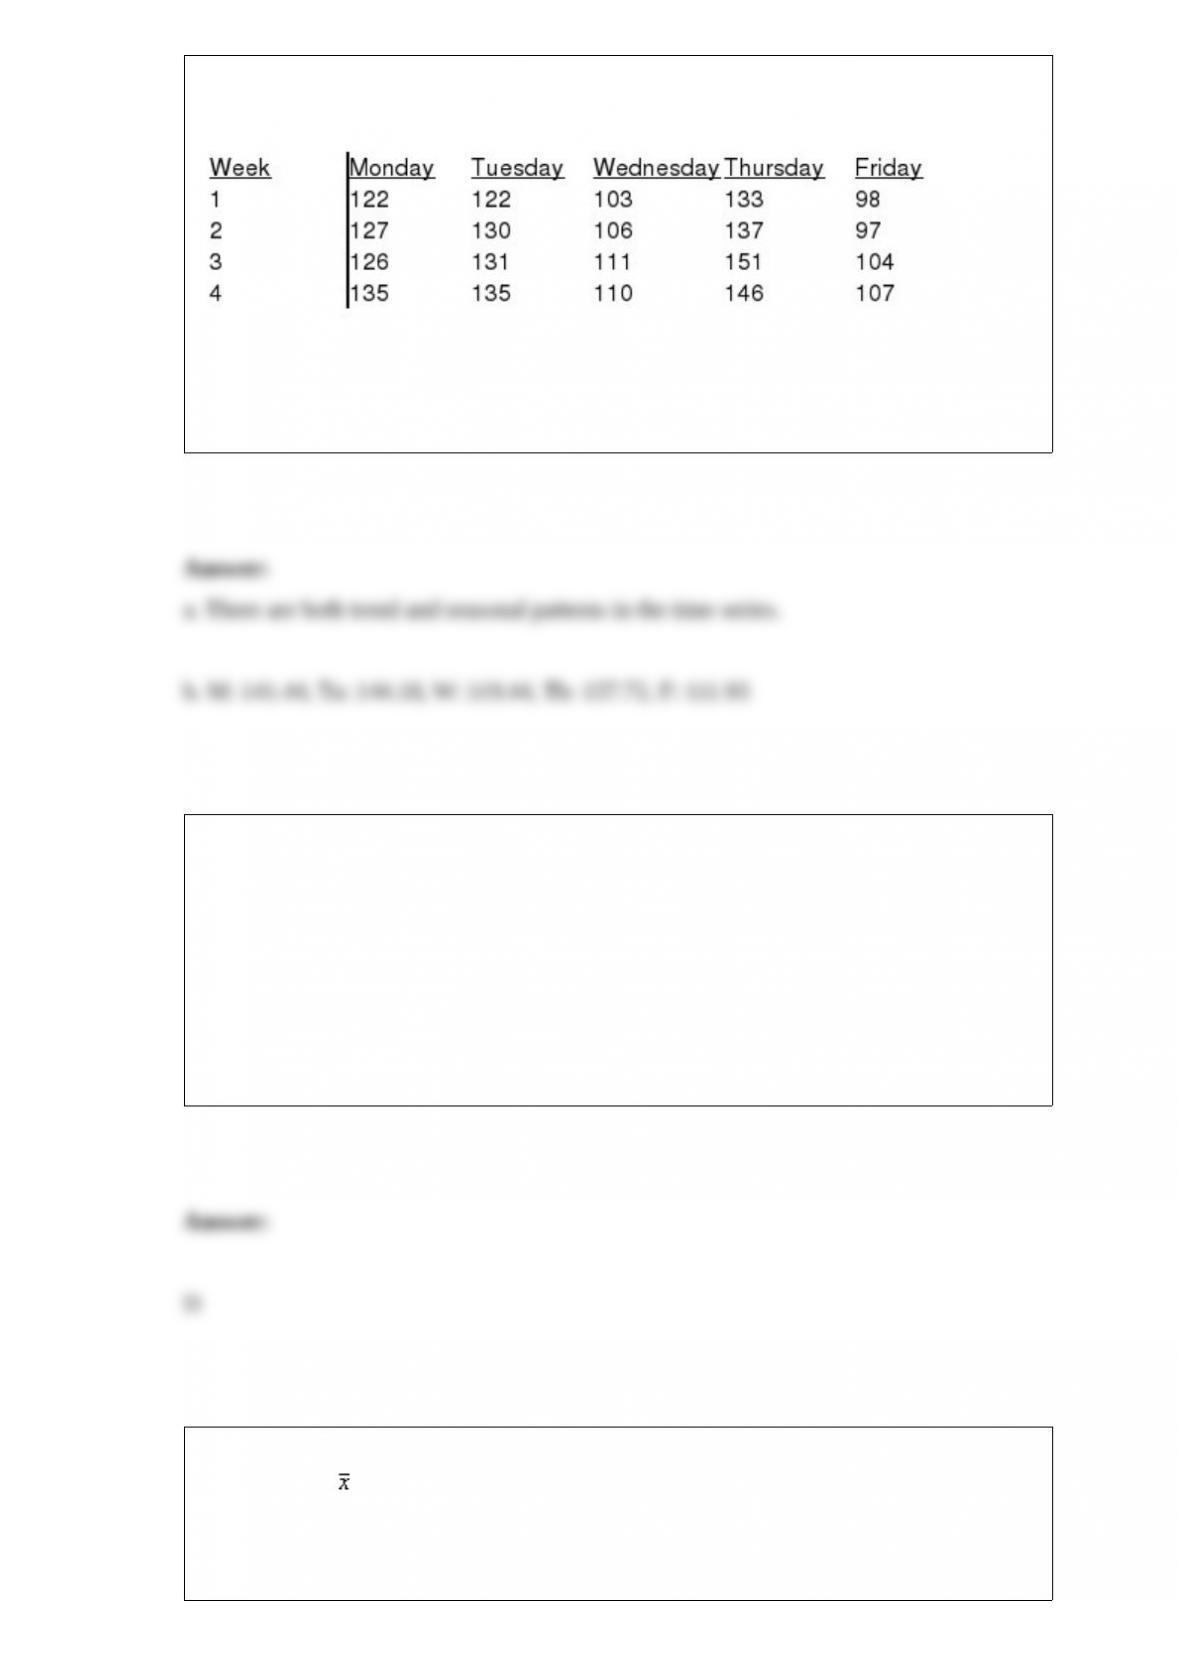
The number of haircuts performed each day at KwikKuts in the last four weeks is listed
below.
a. Plot the sales data. Do you see both trend and seasonality components in the data?
b. Forecast the number of haircuts to be performed in each workday of week 6.
If the coefficient of correlation is a negative value, then the coefficient of determination
a. must also be negative
b. must be zero
c. can be either negative or positive
d. must be positive
Whenever the population has a normal probability distribution, the sampling
distribution of is a normal probability distribution for
a. only large sample sizes
b. only small sample sizes
c. any sample size
d. only samples of size thirty or greater
Excel’s __________ function can be used to compute the median.
a. MAX
b. AVERAGE
c. MEDIAN
d. MODE
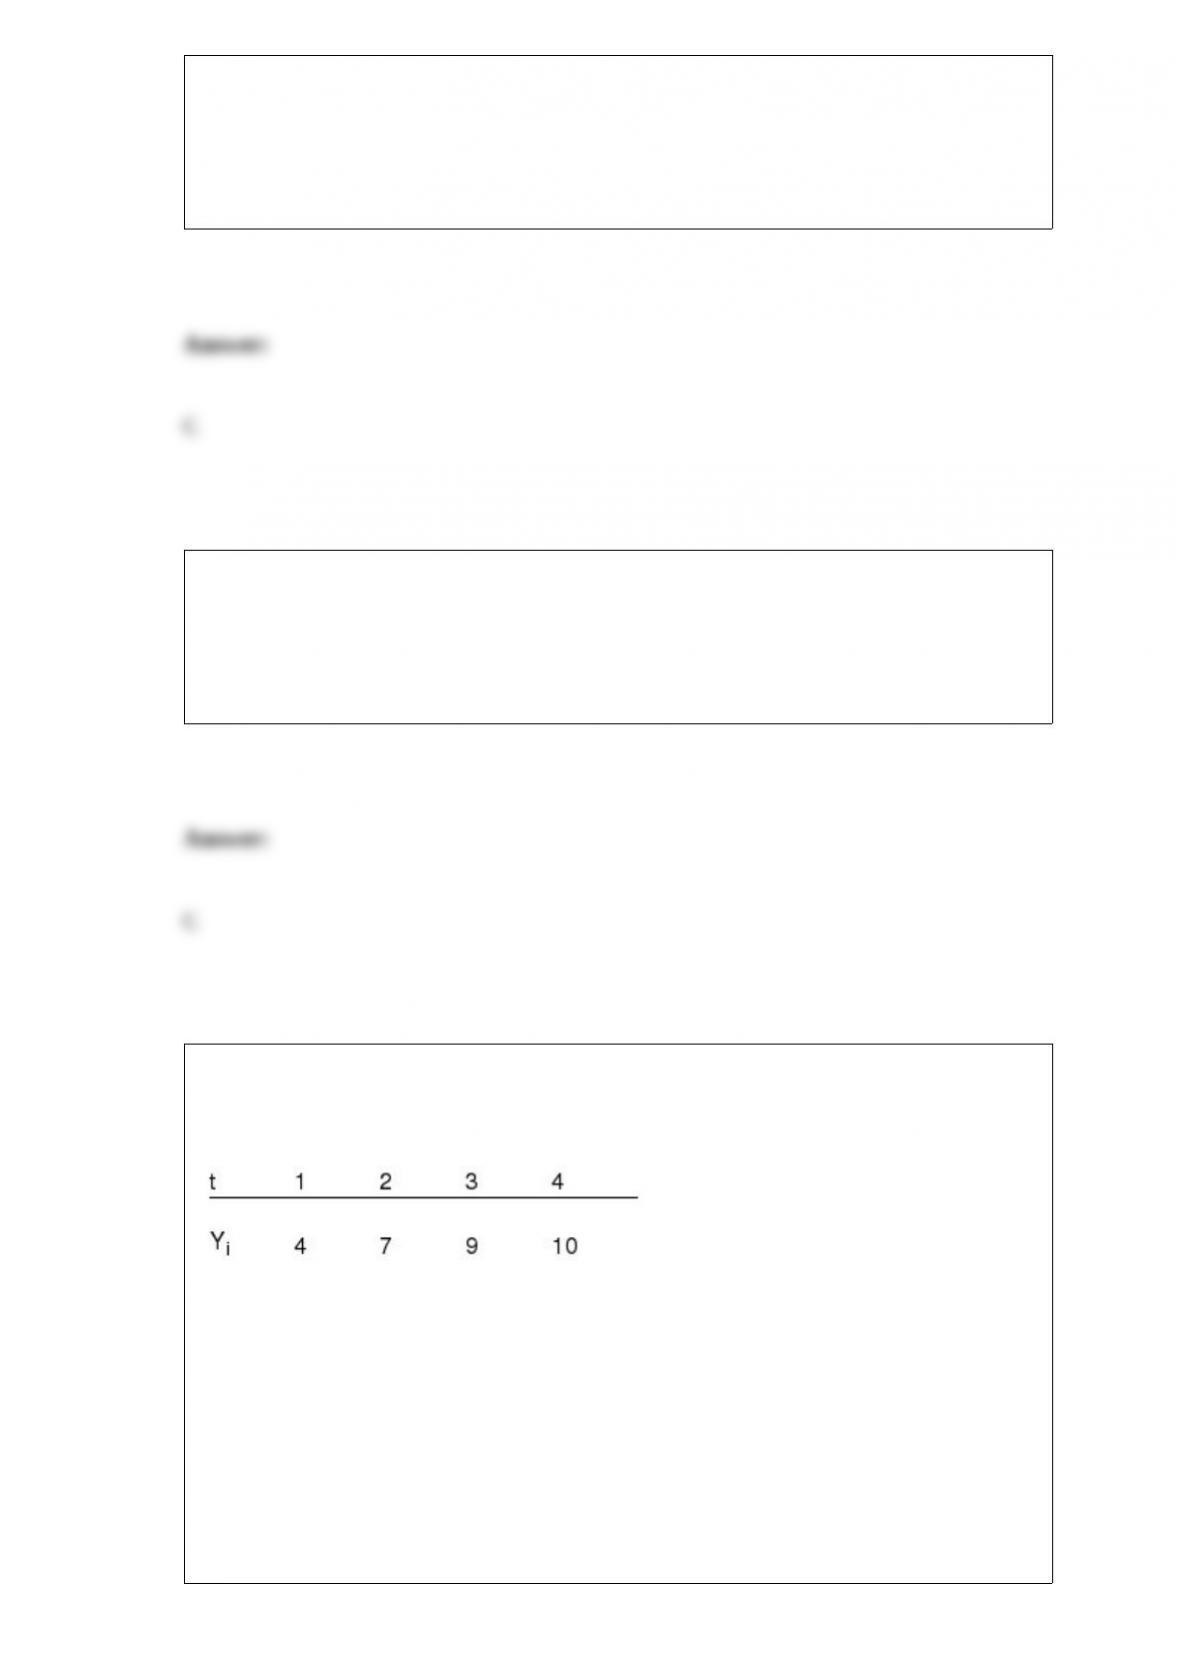
42. Exhibit 17-2
Consider the following time series.
Refer to Exhibit 17-2. The forecast for period 5 is
a. 10.0
b. 2.5
c. 12.5
d. 4.5
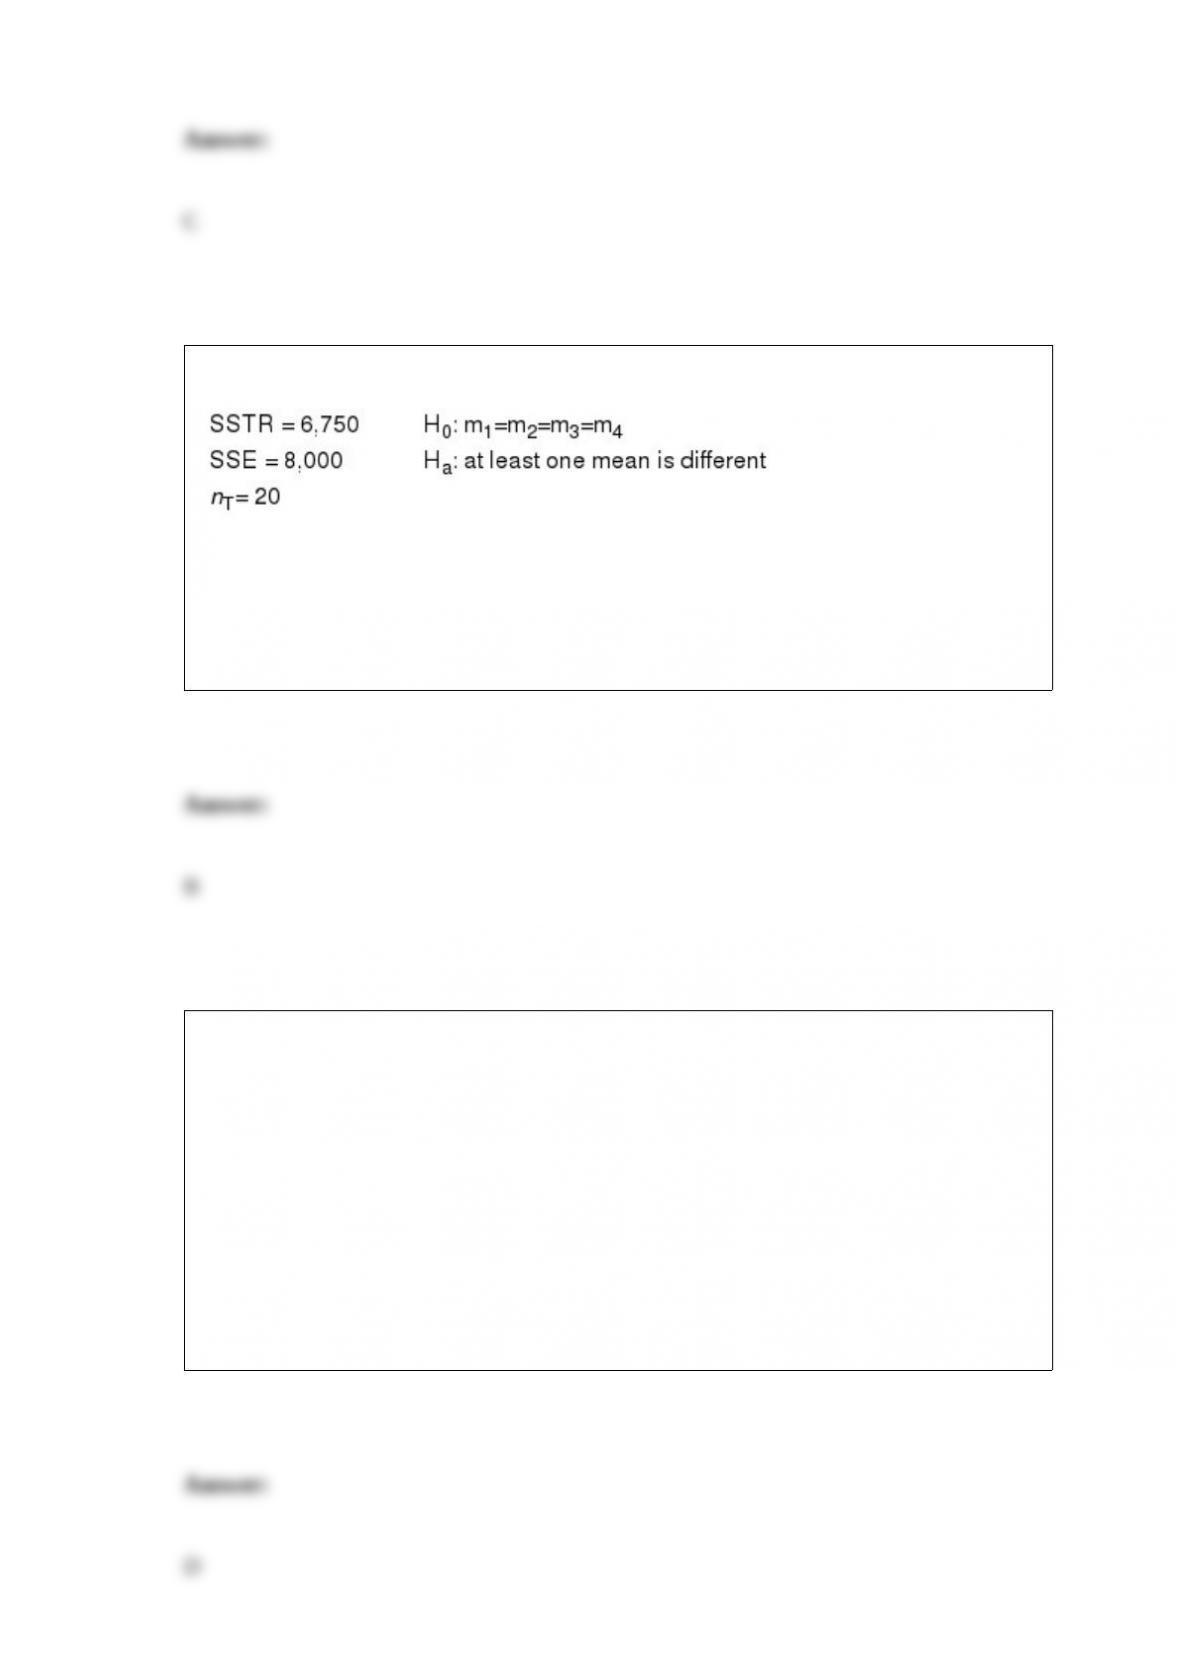
Exhibit 13-1
Refer to Exhibit 13-1. The mean square within treatments (MSE) equals
a. 400
b. 500
c. 1,687.5
d. 2,250
Independent simple random samples are taken to test the difference between the means
of two populations whose variances are not known. The sample sizes are n1 = 32 and n2
= 40. The correct distribution to use is the
a. binomial distribution
b. t distribution with 72 degrees of freedom
c. t distribution with 71 degrees of freedom
d. t distribution with 70 degrees of freedom

A method of assigning probabilities based upon judgment is referred to as the
a. relative method
b. probability method
c. classical method
d. None of the other answers is correct.
Normal or natural variation in the quality of production output that is due purely to
chance is called
a. common-cause variation
b. assignable-cause variation
c. control-cause variation
d. correctable-cause variation
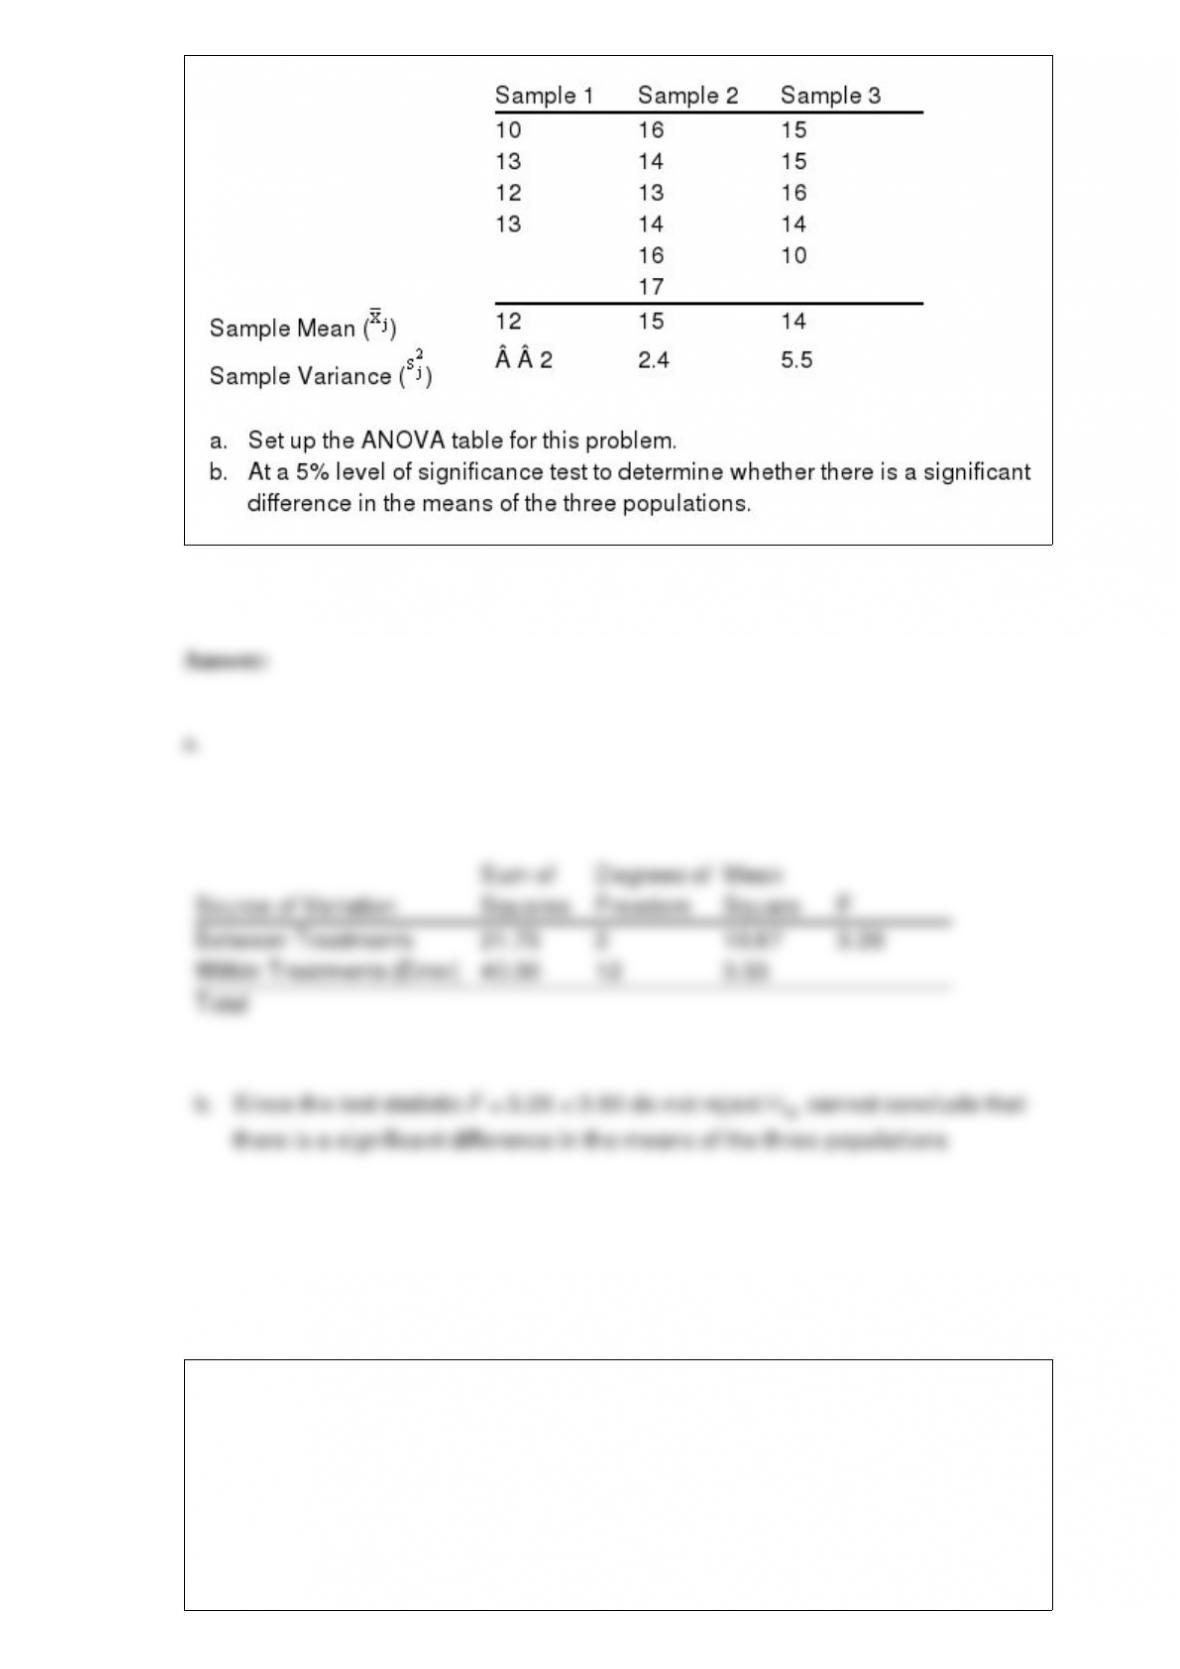
Samples were selected from three populations. The data obtained are shown below.
Independent simple random samples are taken to test the difference between the means
of two populations whose standard deviations are not known. The sample sizes are n1 =
25 and n2 = 35. The correct distribution to use is the
a. Poisson distribution
b. t distribution with 60 degrees of freedom
c. t distribution with 59 degrees of freedom
d. t distribution with 58 degrees of freedom
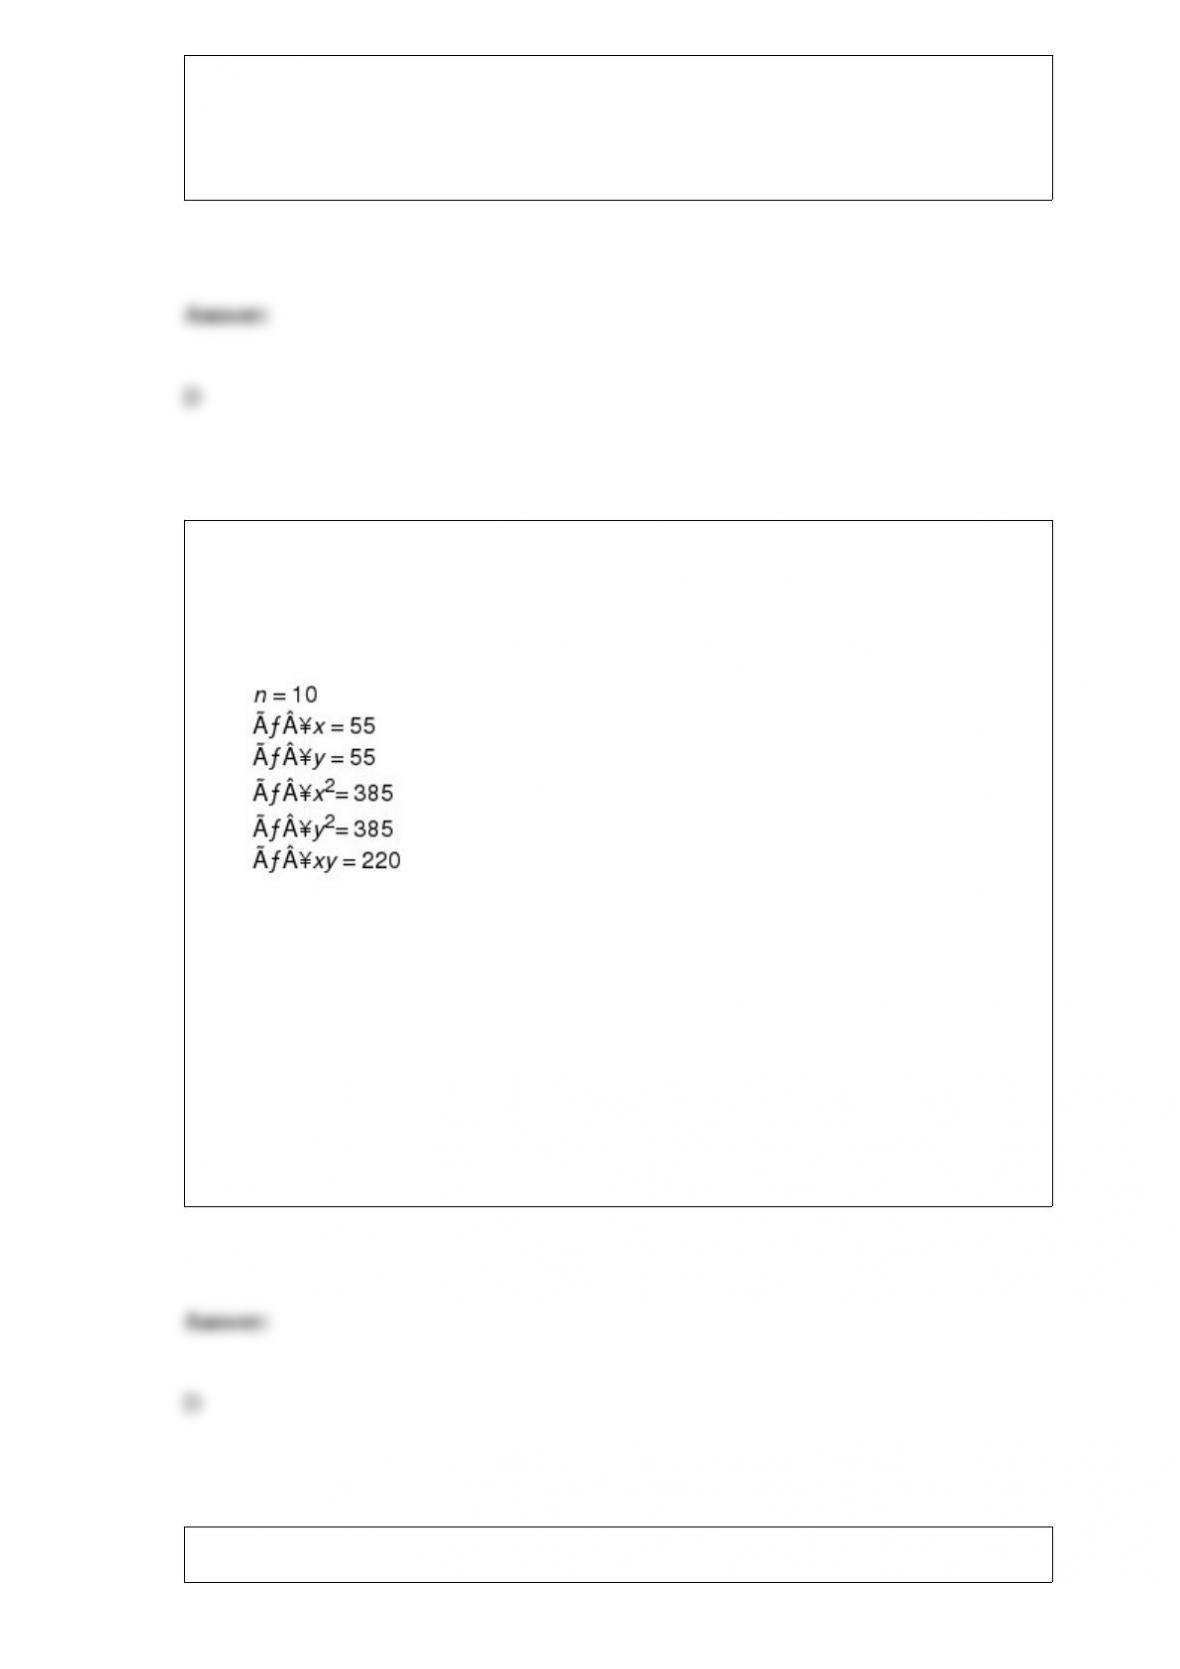
Exhibit 14-1
A regression analysis resulted in the following information regarding a dependent
variable (y) and an independent variable (x).
Refer to Exhibit 14-1. The least squares estimate of b0 equals
a. 1
b. -1
c. 5.5
d. 11
The correlation coefficient ranges between
a. 0 and 1
b. 1 and 1
c. minus infinity and plus infinity
d. 1 and 100
Exhibit 15-8
The following estimated regression model was developed relating yearly income (y in
$1,000s) of 30 individuals with their age (x1) and their gender (x2) (0 if male and 1 if
female).
= 30 + 0.7x1 + 3x2
Also provided are SST = 1,200 and SSE = 384.
Refer to Exhibit 15-8. The multiple coefficient of determination is
a. 0.32
b. 0.42
c. 0.68
d. 0.50
From a population of 2000 accounts receivable, a simple random sample of 120
accounts is selected. Thirty-six of the accounts in the sample were overdue.
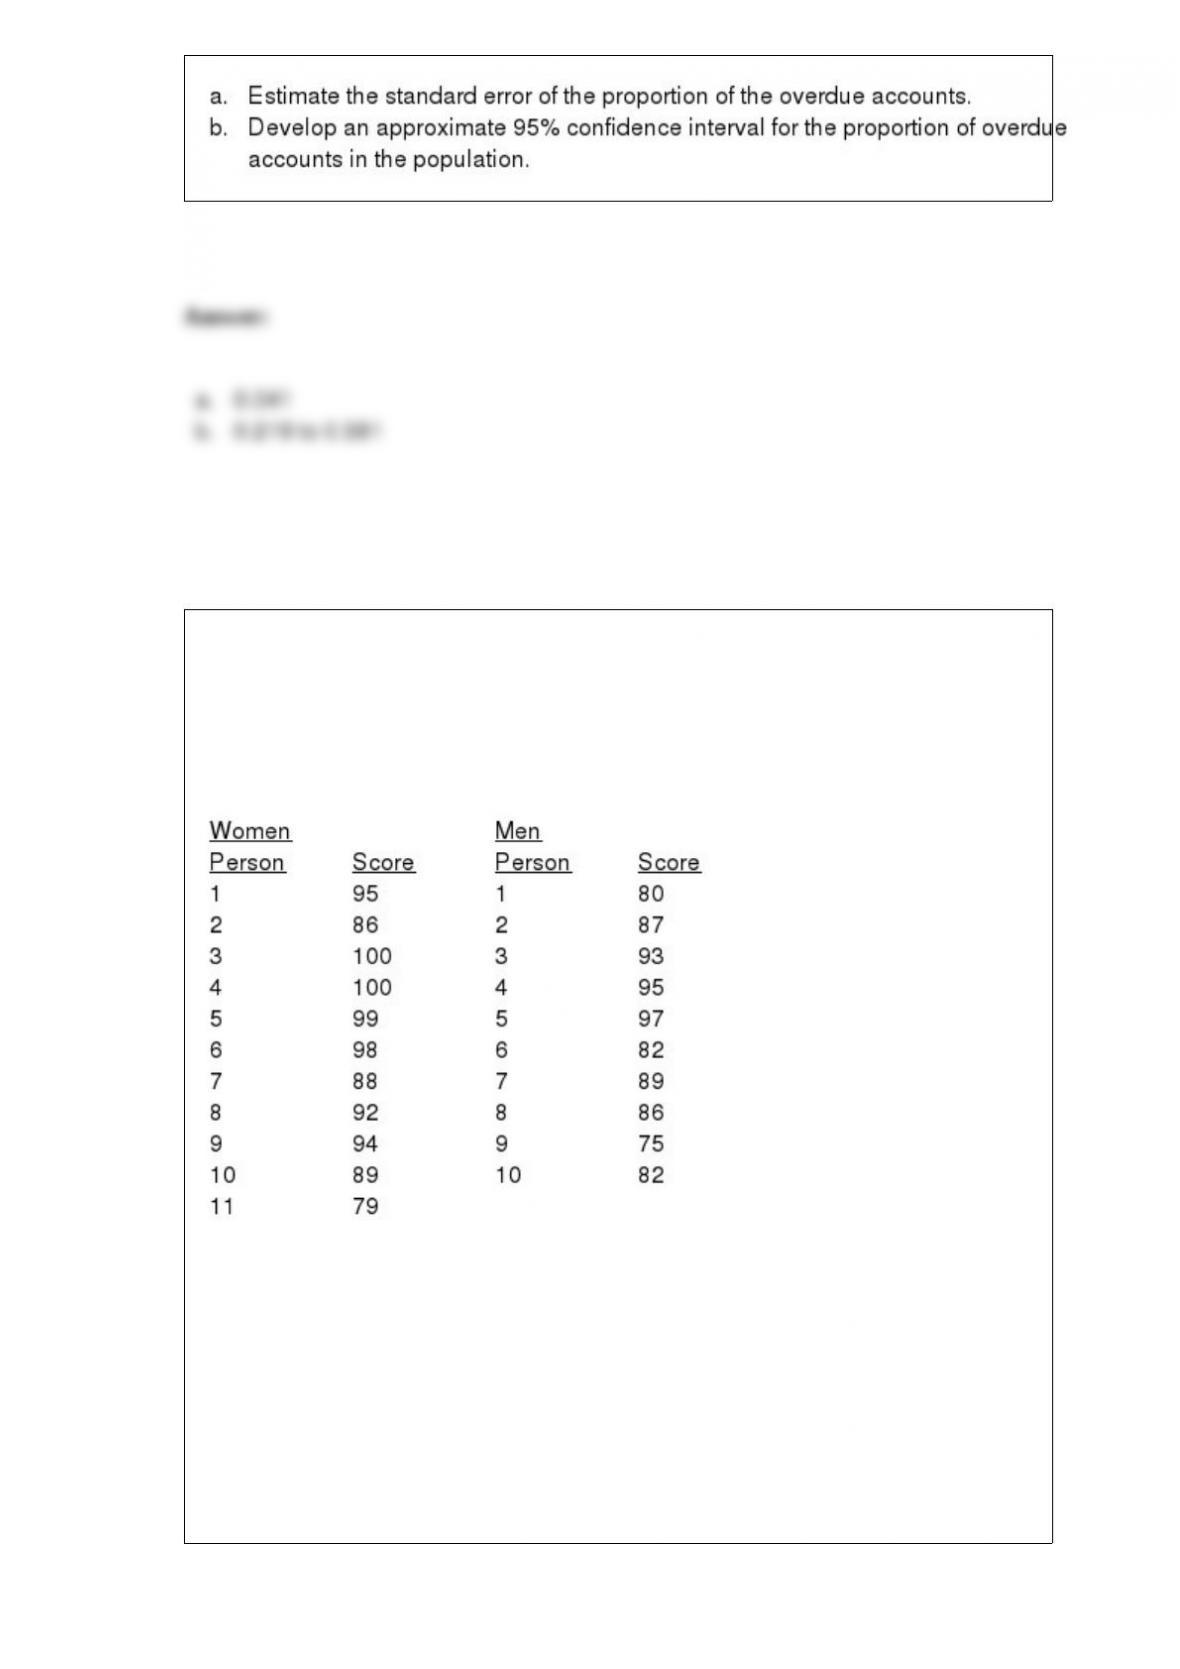
Exhibit 18-4
It has been hypothesized that there is no difference in the mathematical accuracy of men
and women. A sample of men and women were given math tests. The scores on the tests
are given below.
Refer to Exhibit 18-4. The test statistic equals (using the women as population 1)
a. -5.246
b. 0.176
c. 0.722
d. 2.5
For a two-tailed hypothesis test about , we can use any of the following approaches
except
a. compare the confidence interval estimate of to the hypothesized value of
b. compare the p-value to the value of
c. compare the value of the test statistic to the critical value
d. compare the level of significance to the confidence coefficient
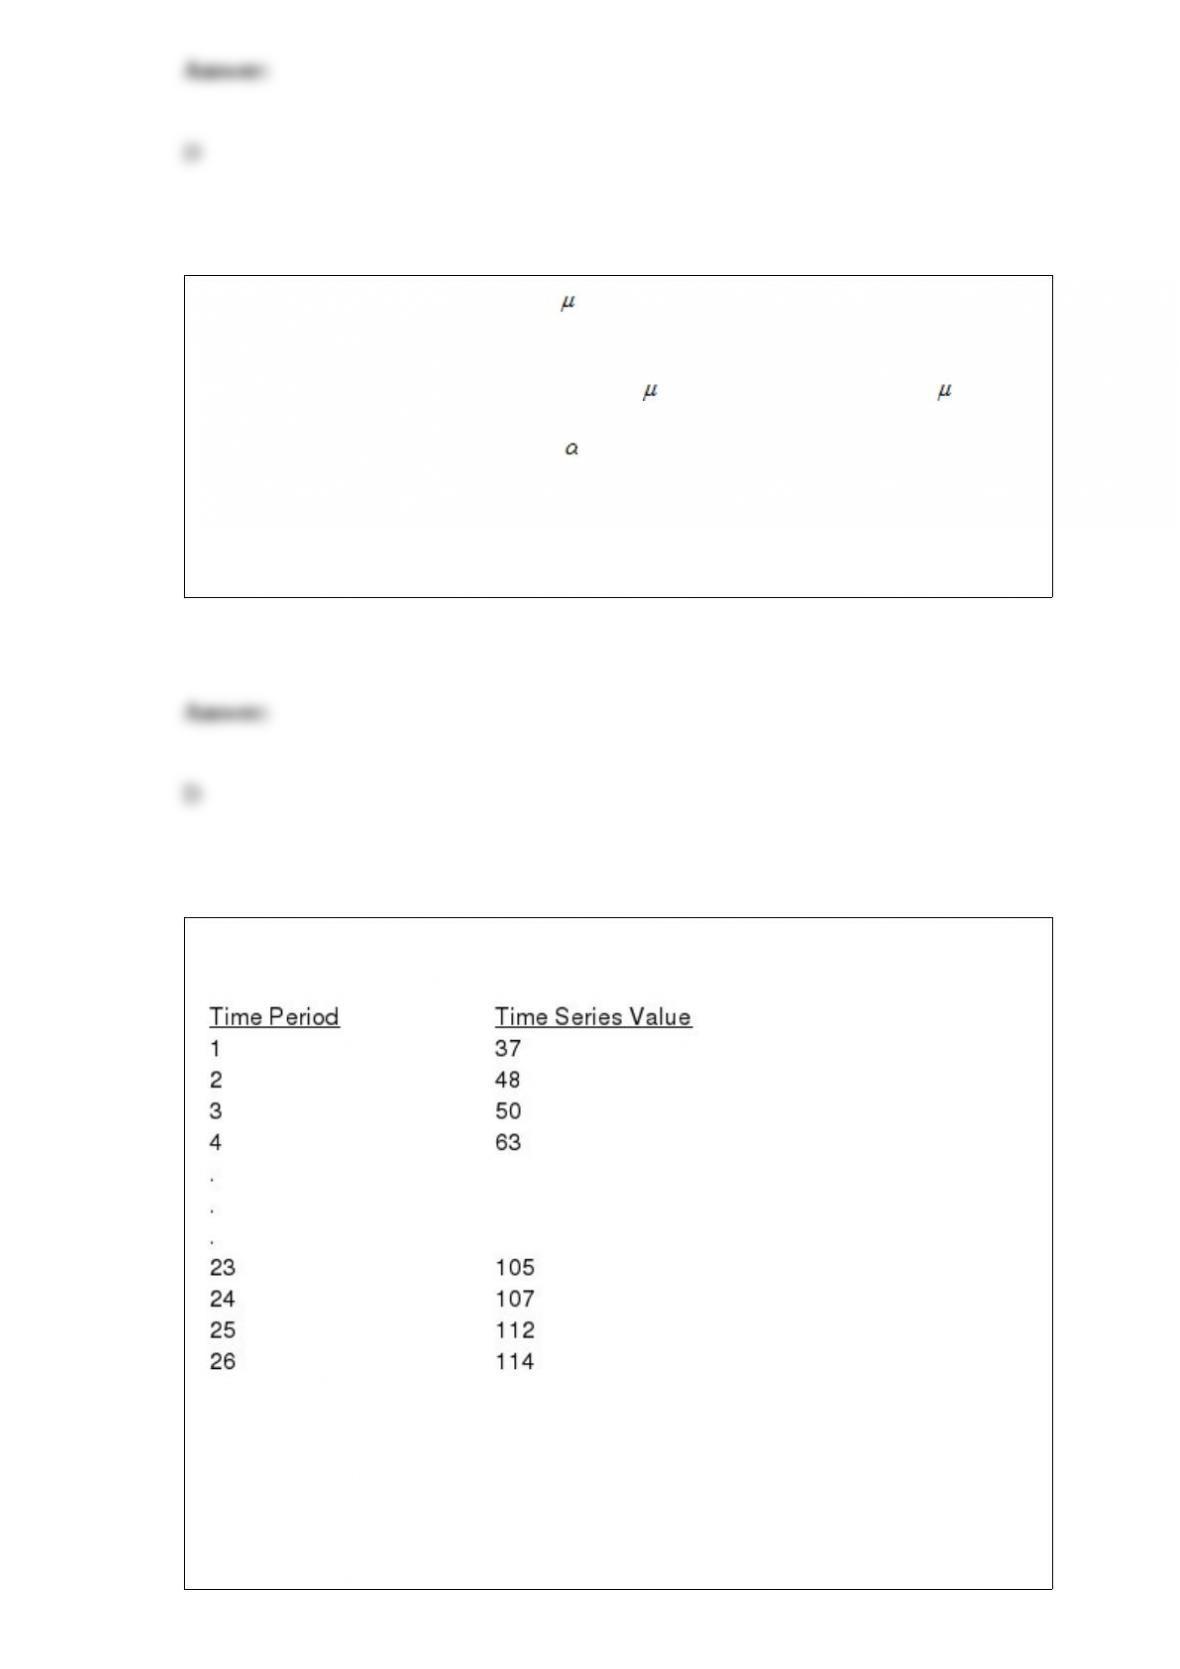
Below you are given some values of a time series consisting of 26 time periods.
The estimated regression equation for these data is
Yt = 16.23 + .52Yt-1 + .37Yt-2
The forecasted value for time period 27 is
a. 53.23
b. 109.5
c. 116.65
d. 116.95
Exhibit 15-6
Below you are given a partial Excel output based on a sample of 16 observations.
Refer to Exhibit 15-6. Carry out the test to determine if there is a relationship among
the variables at the 5% level. The null hypothesis should
a. be rejected
b. not be rejected
c. revised
d. None of these alternatives is correct.

Income is an example of
a. categorical data
b. either categorical or quantitative data
c. currency data
d. quantitative data
In a large corporation, 65% of the employees are male. A random sample of five
employees is selected.
a. Define the random variable in words for this experiment.
b. What is the probability that the sample contains exactly three male employees?
c. What is the probability that the sample contains no male employees?
d. What is the probability that the sample contains more than three female employees?
e. What is the expected number of female employees in the sample?
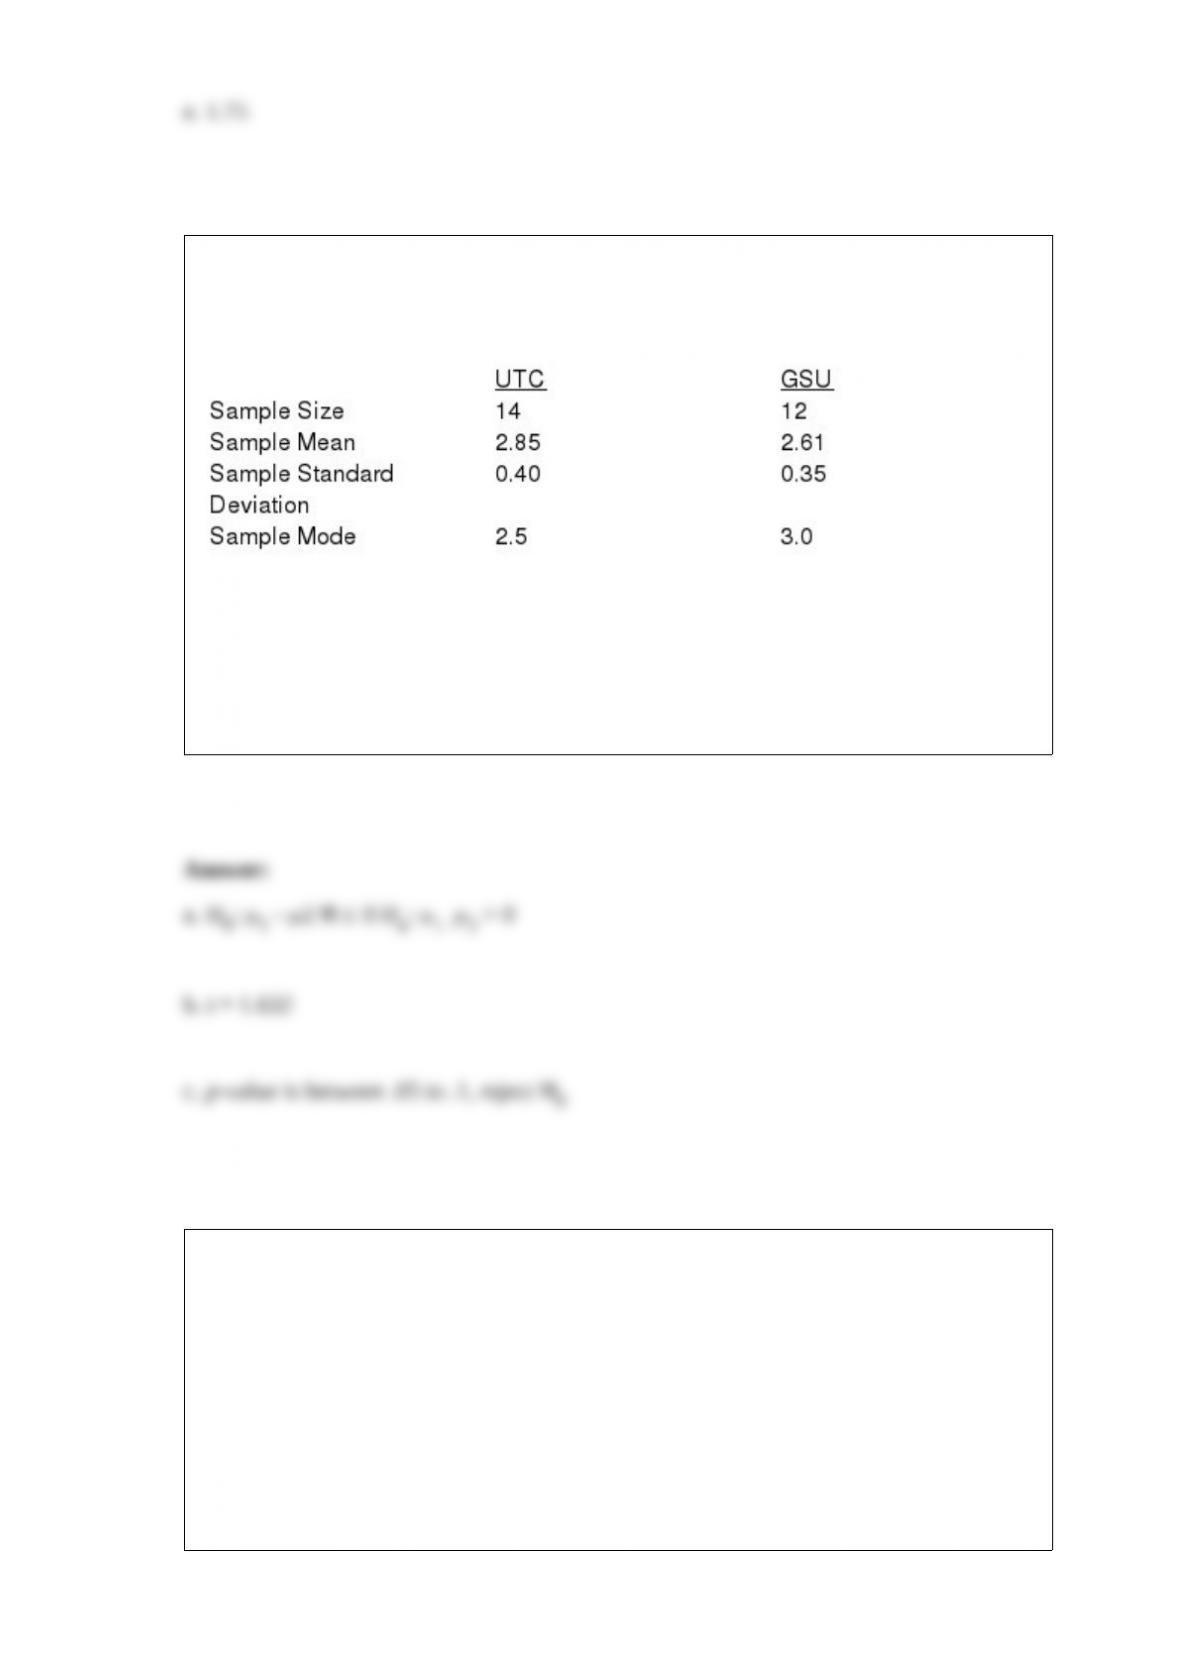
The Dean of Students at UTC has said that the average grade of UTC students is higher
than that of the students at GSU. Random samples of grades from the two schools are
selected, and the results are shown below.
a. Give the hypotheses.
b. Compute the test statistic.
c. At a 0.1 level of significance, test the Dean of Students’ statement.
A statistical test conducted to determine whether to reject or not reject a hypothesized
probability distribution for a population is known as a
a. contingency test
b. probability test
c. goodness of fit test
d. None of these alternatives is correct.
Which of the following is not a type of a control chart?
a. a p chart
b. an x-bar chart
c. an R chart
d. All of these are types of control charts.
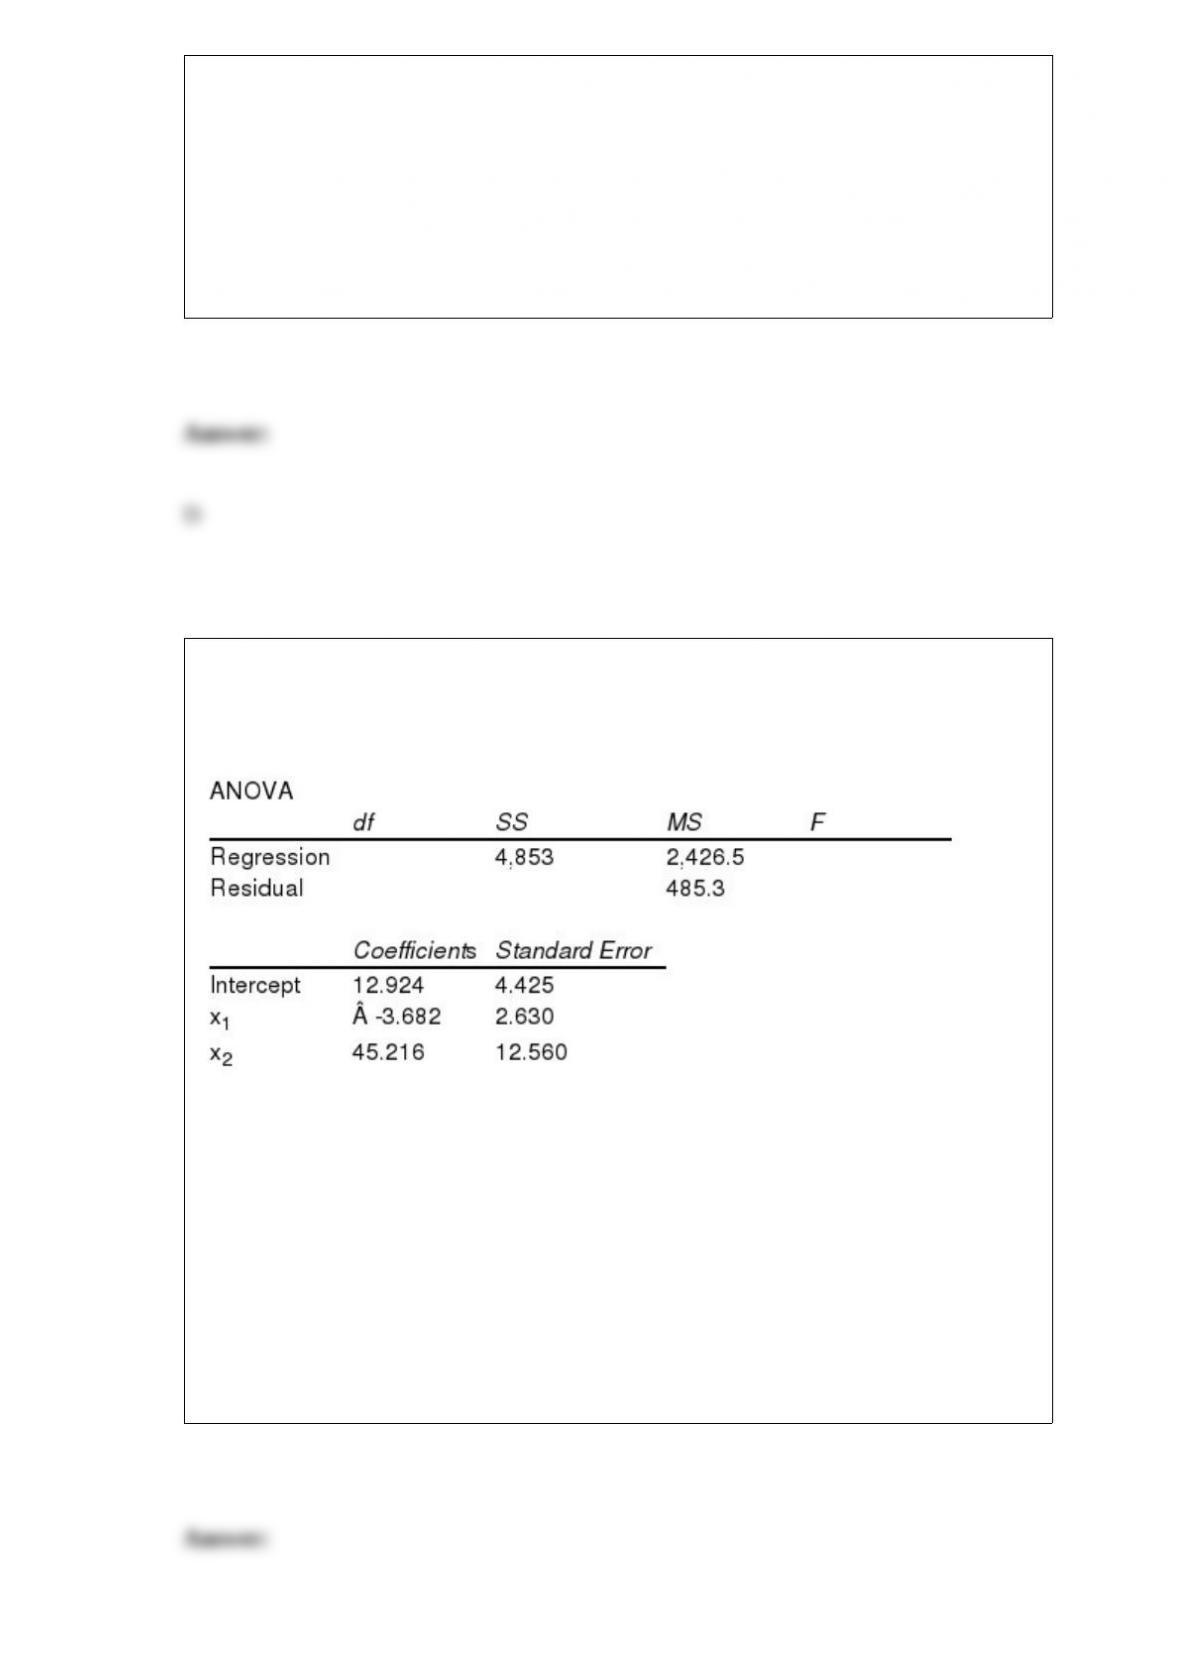
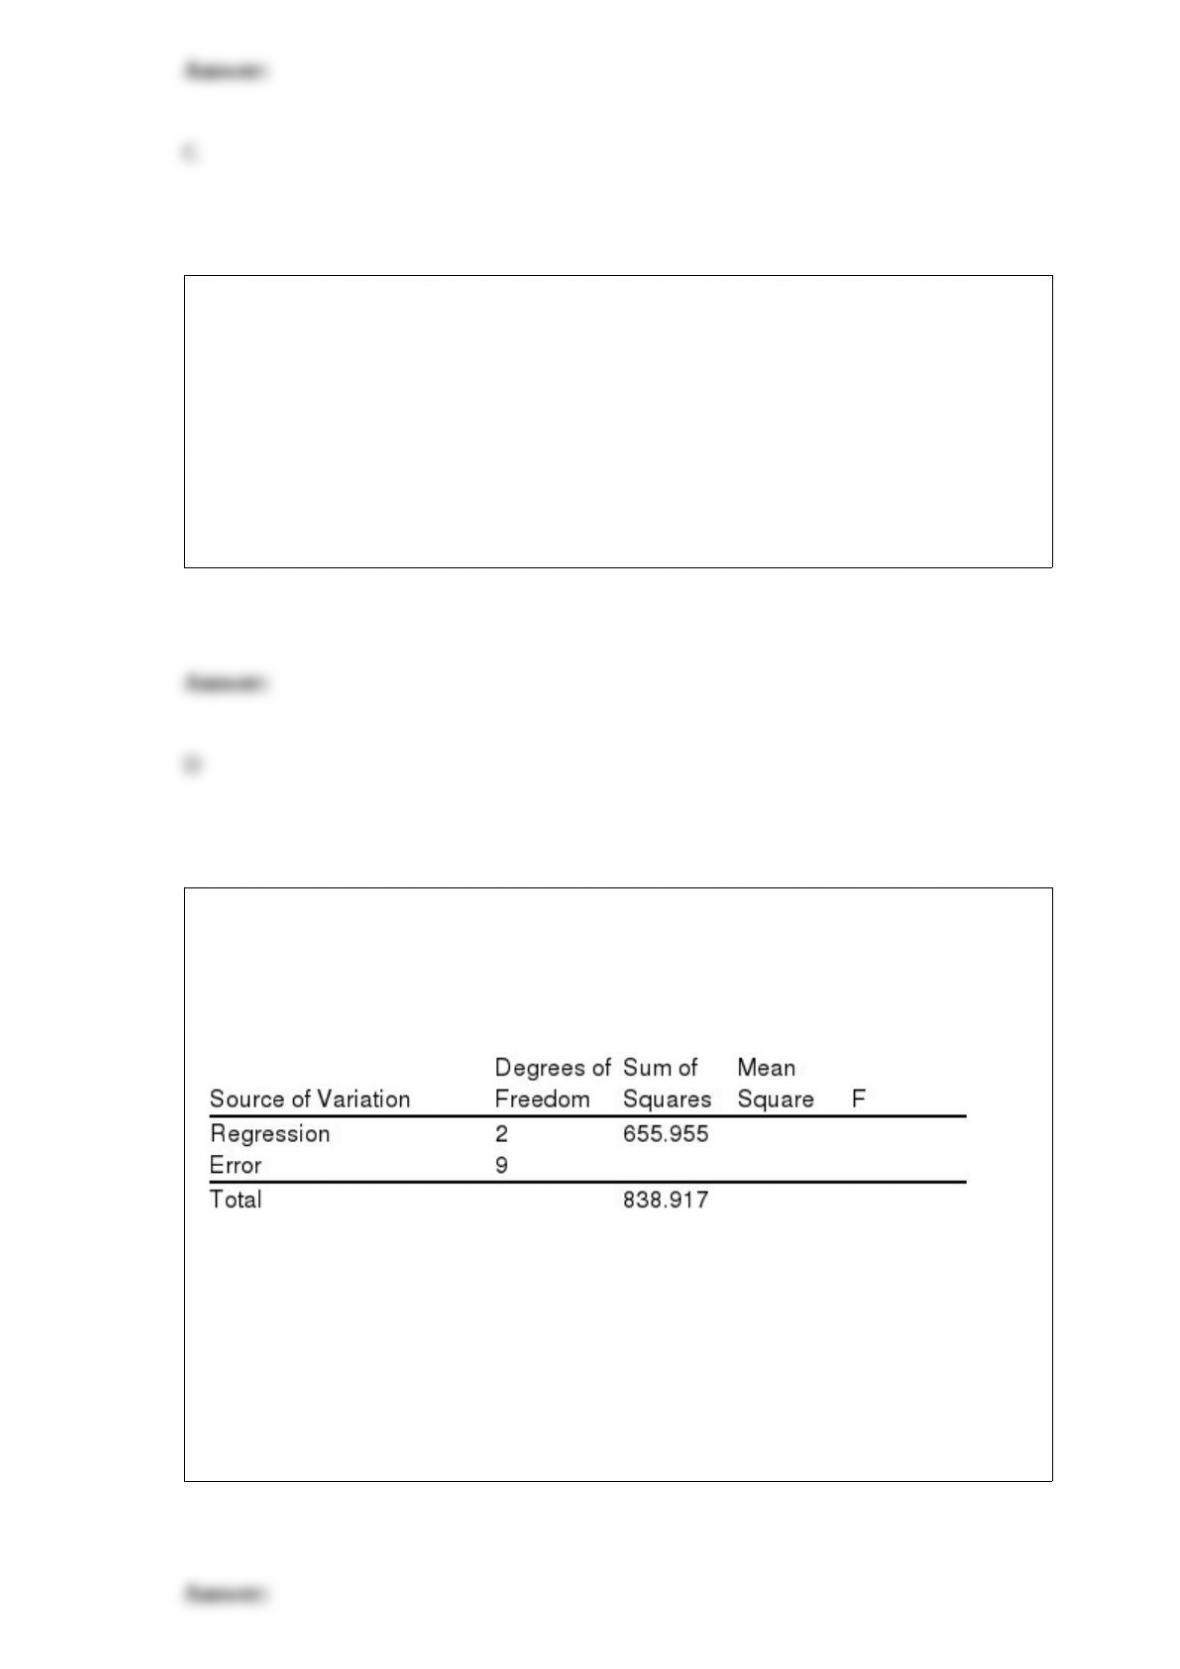
Below you are given a partial ANOVA table based on a sample of 12 observations
relating the number of personal computers sold by a computer shop per month (y), unit
price (x1 in $1,000) and the number of advertising spots (x2) they used on a local
television station.
a. At = 0.05 level of significance, test to determine if the model is significant. That is,
determine if there exists a significant relationship between the independent variables
and the dependent variable.
b. Determine the multiple coefficient of determination.
c. Determine the adjusted multiple coefficient of determination.
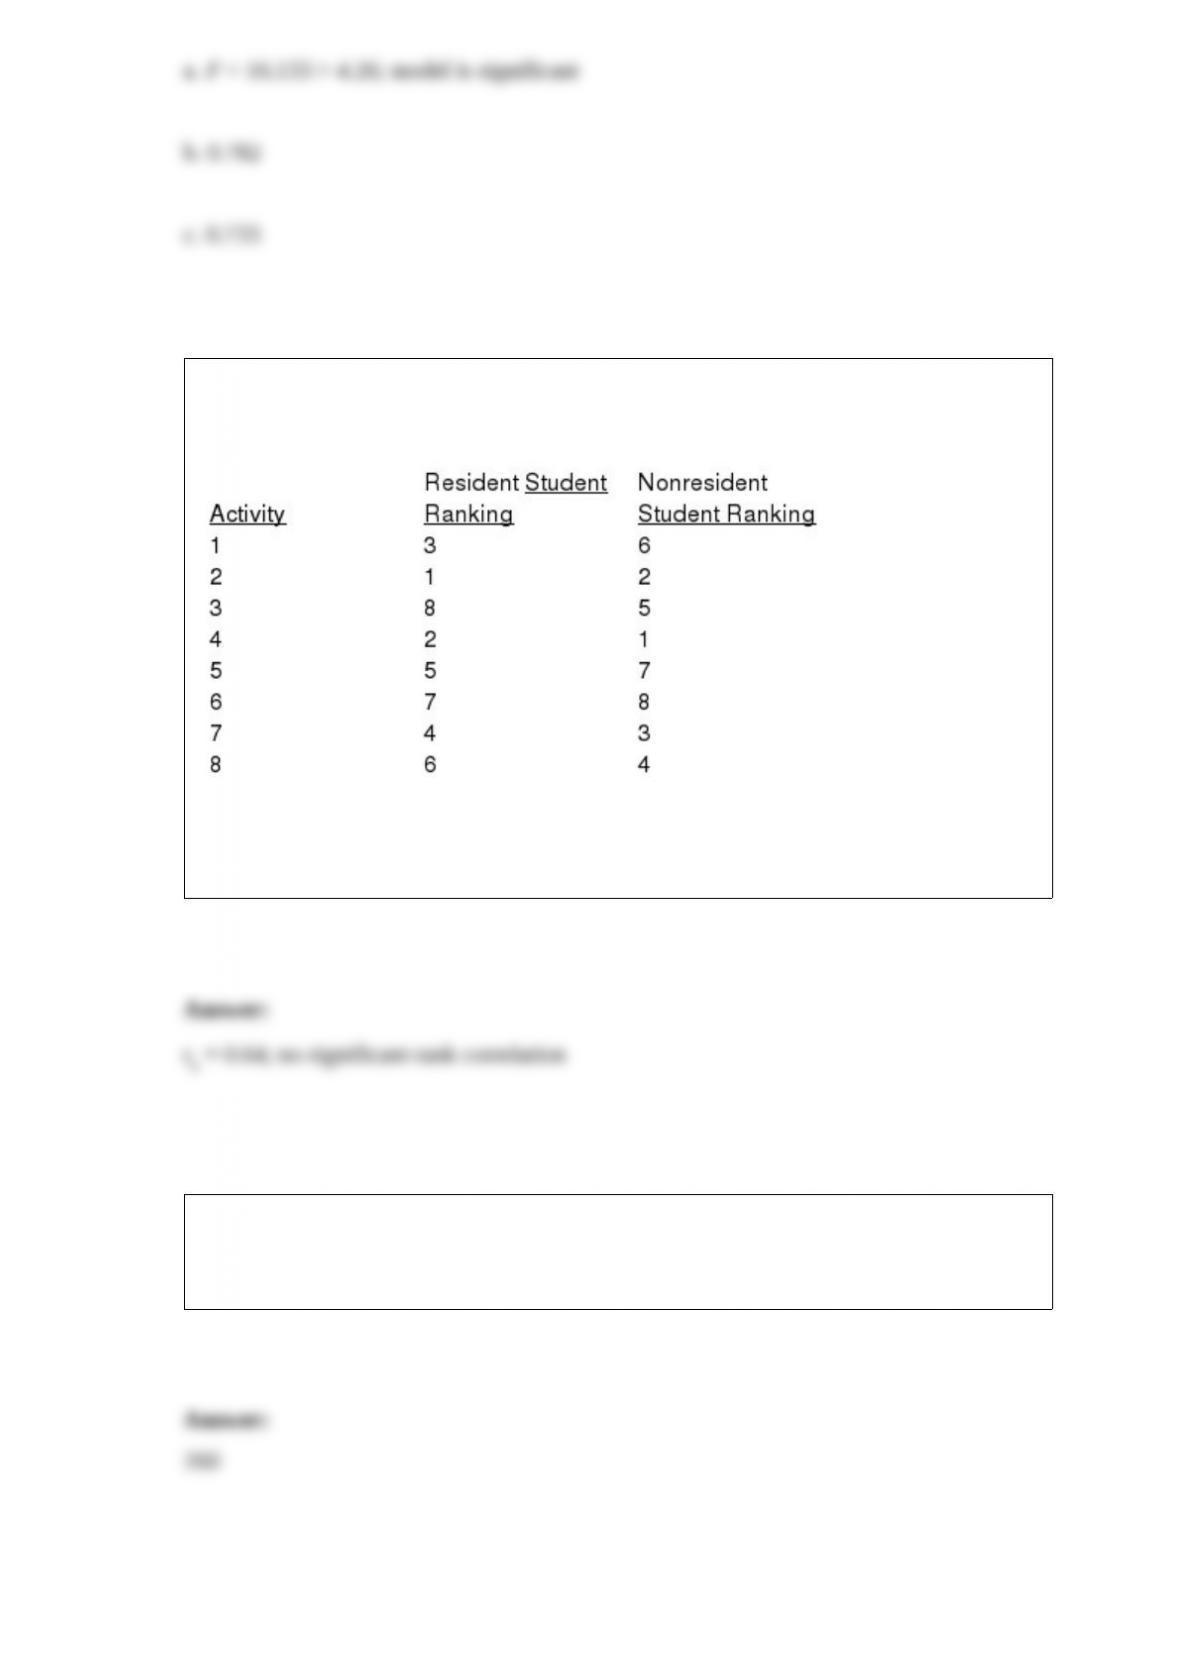
Two groups of students were asked to rank the activities sponsored by the Student
Government Association on campus. The following show their rankings.
Determine the Spearman rank-correlation coefficient and test for a significant
correlation with = 0.05.
The manager of a department store wants to determine what proportion of people who
enter the store use the store’s credit card for their purchases. What size sample should he
take so that at 99% confidence the error will not be more than 8%?
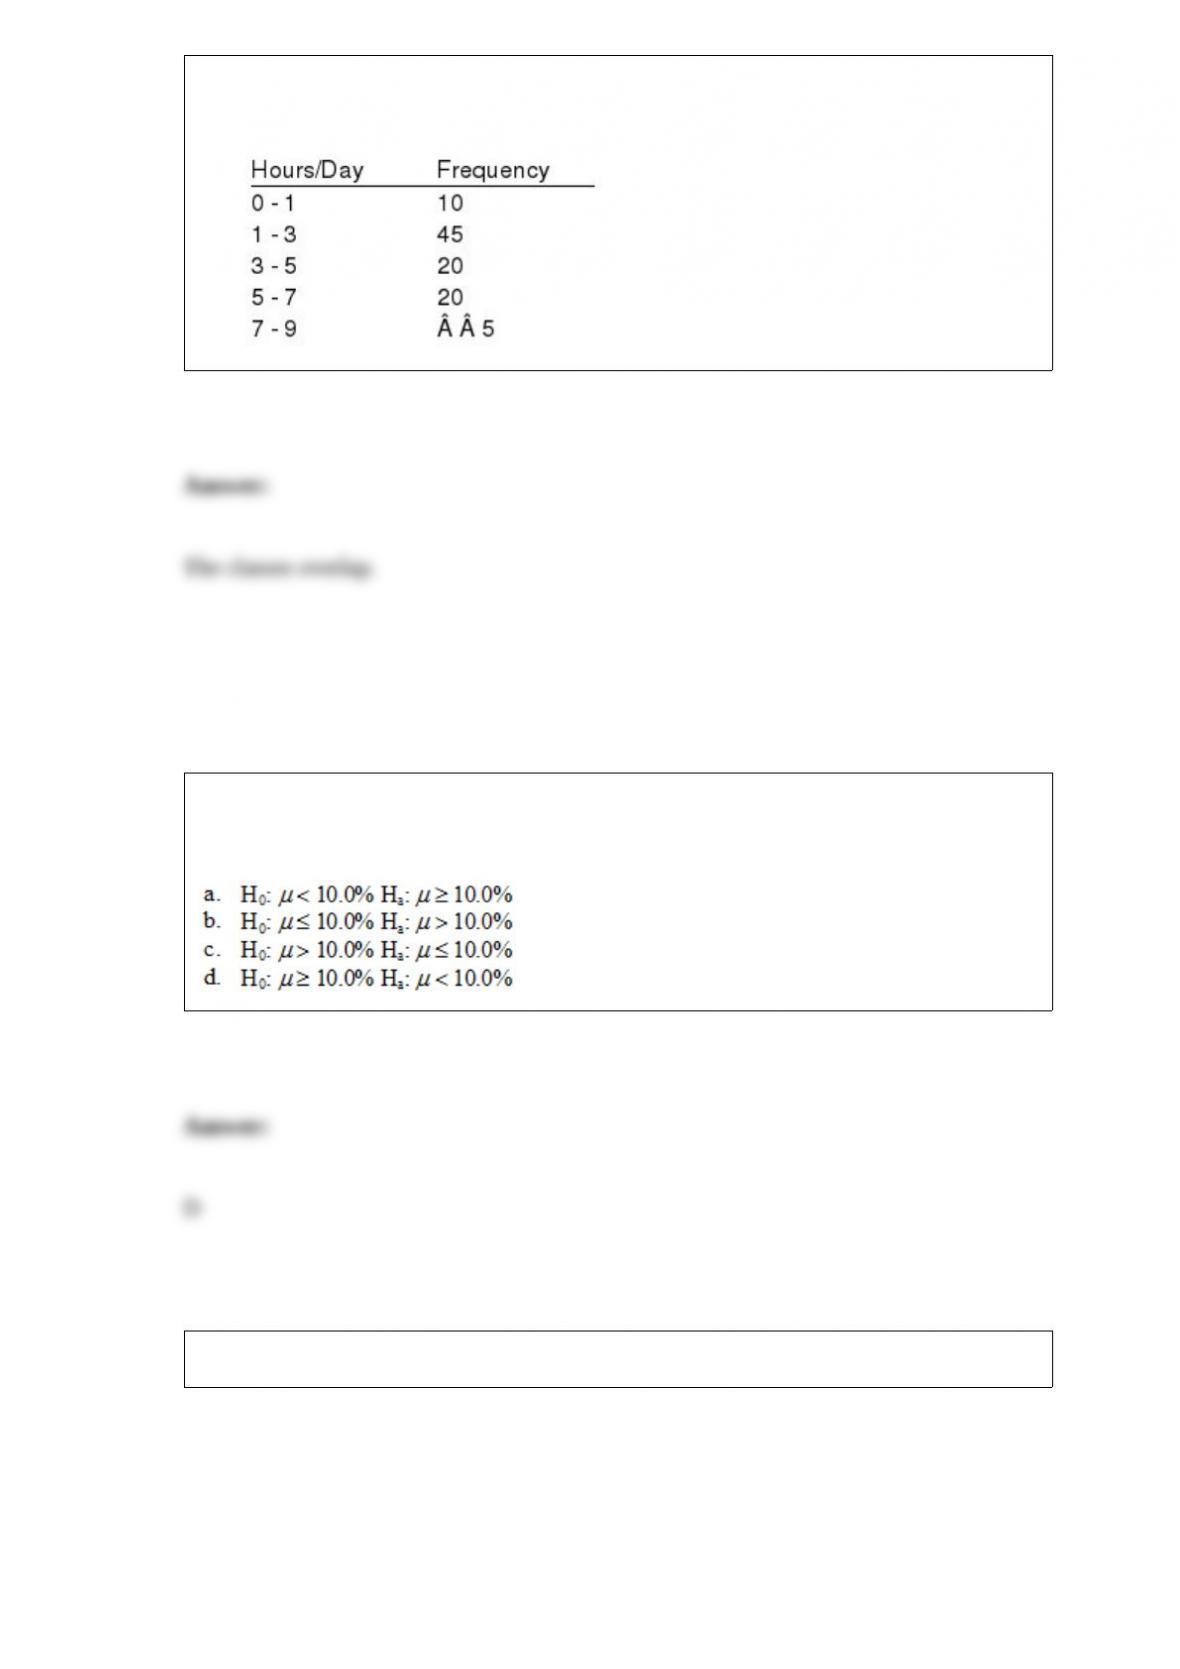
The following is a summary of the number of hours spent per day watching television
for a sample of 100 people. What is wrong with the frequency distribution?
Your investment executive claims that the average yearly rate of return on the stocks
she recommends is at least 10.0%. You plan on taking a sample to test her claim. The
correct set of hypotheses is
What type of graph is depicted below?
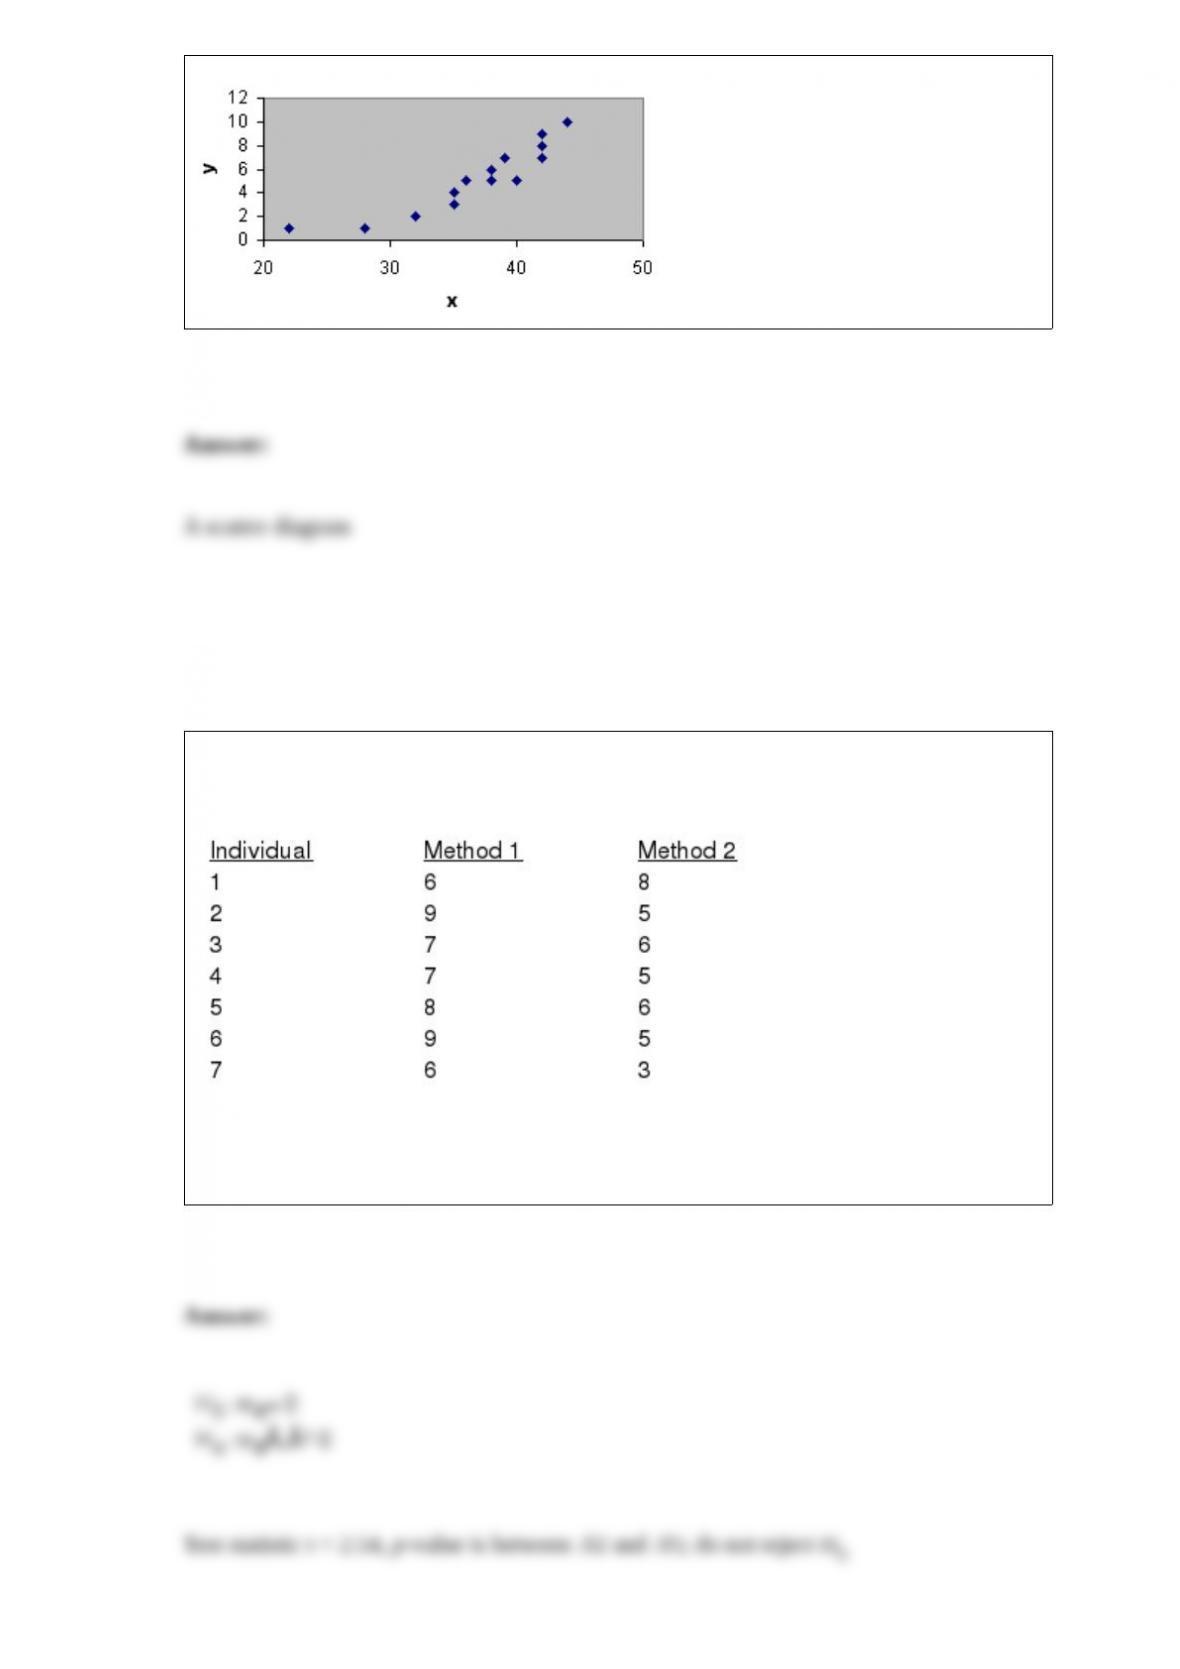
The following information was obtained from matched samples regarding the
productivity of four individuals using two different methods of production.
Let d = Method 1 – Method 2. Is there a significant difference between the productivity
of the two methods? Let = 0.05.