
It is known that the variance of a population equals 1,936. A random sample of 121 has
been taken from the population. There is a .95 probability that the sample mean will
provide a margin of error of
a. 7.84 or less
b. 31.36 or less
c. 344.96 or less
d. 1,936 or less
Exhibit 1-2
In a sample of 3,200 registered voters, 1,440, or 45%, approve of the way the President
is doing his job.
Refer to Exhibit 1-2. A political pollster states, “Forty five percent of all voters approve
of the President.” This statement is an example of
a. a sample
b. descriptive statistics
c. statistical inference
d. a population
Exhibit 7-3
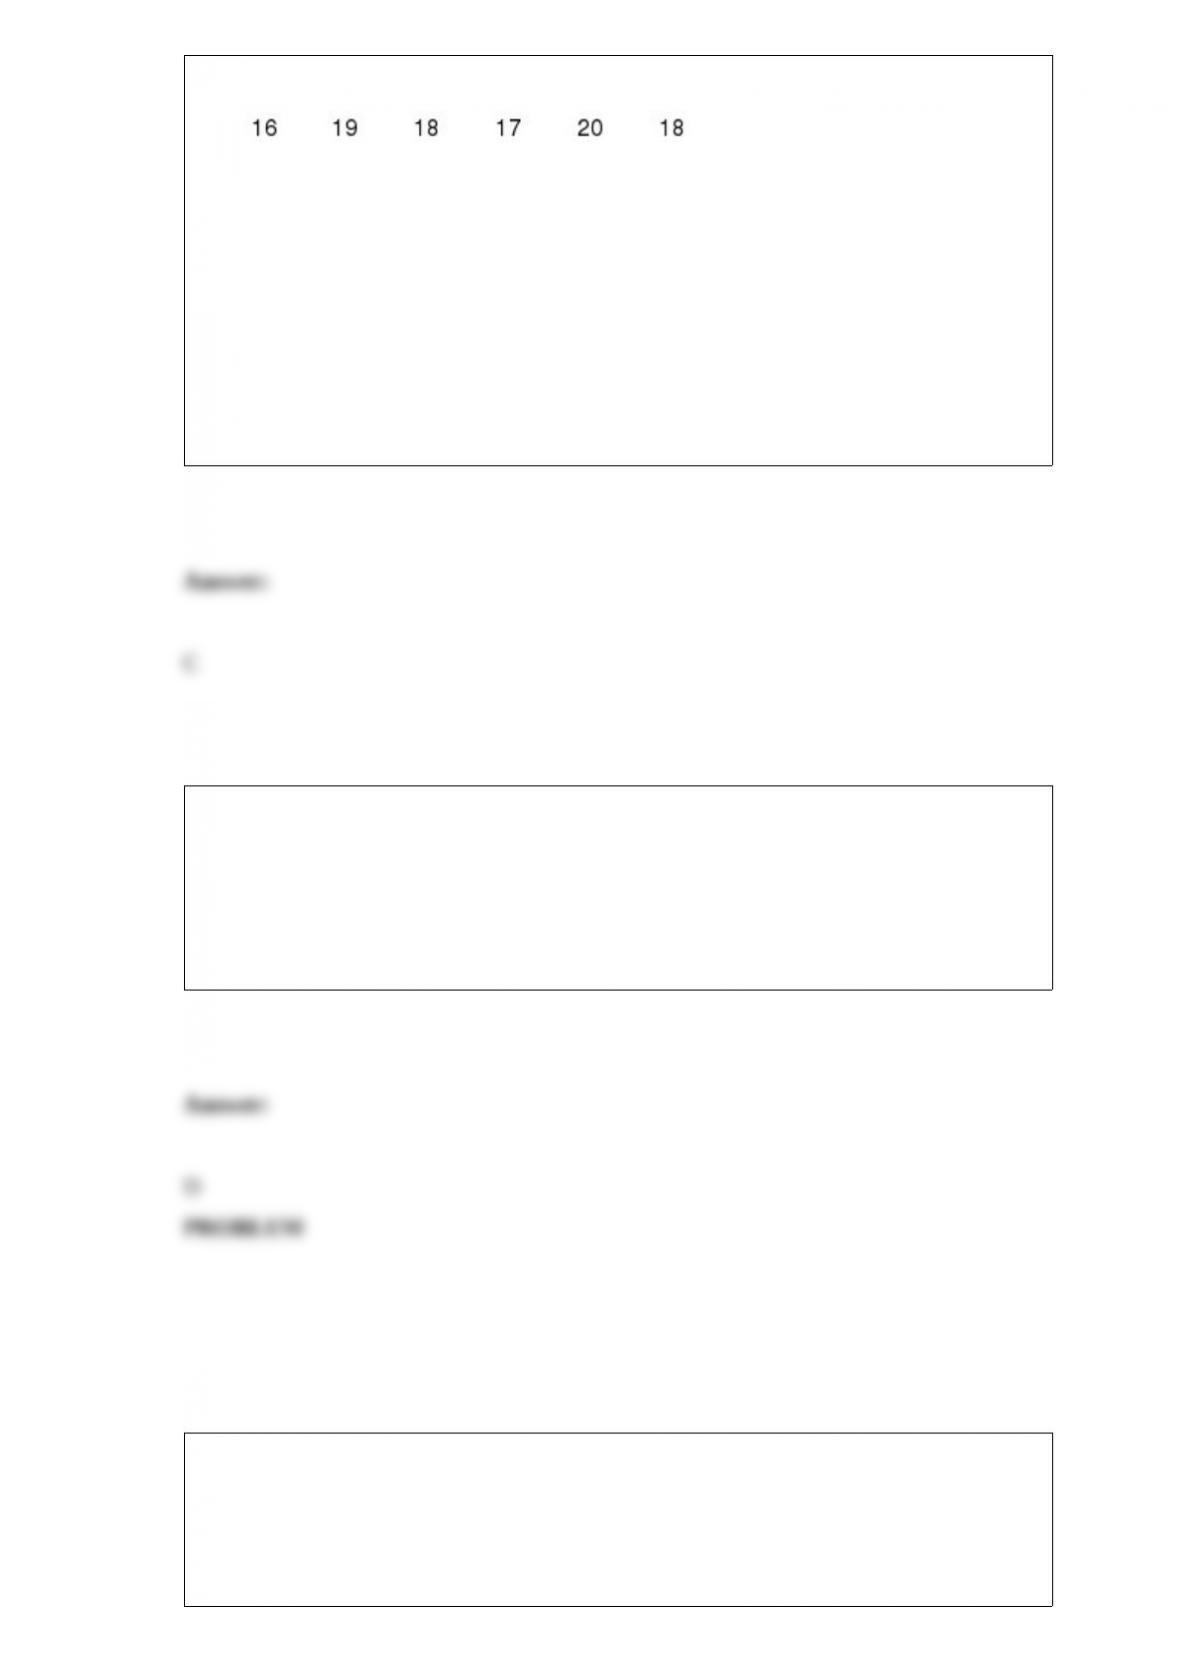
The following information was collected from a simple random sample of a population.
Refer to Exhibit 7-3. The point estimate of the population standard deviation is
a. 2.000
b. 1.291
c. 1.414
d. 1.667
The variable selection procedure that identifies the best regression equation, given a
specified number of independent variables, is
a. stepwise regression
b. forward selection
c. backward elimination
d. best-subsets regression
A Scanner Data User Survey of 50 companies found that the average amount spent on
scanner data per category of consumer goods was $387,325 (Mercer Management
Consulting, Inc., April 24, 1997). The $387,325 is an example of
a. categorical data
b. quantitative data
c. a descriptive statistic
d. Both quantitative data and a descriptive statistic are correct.
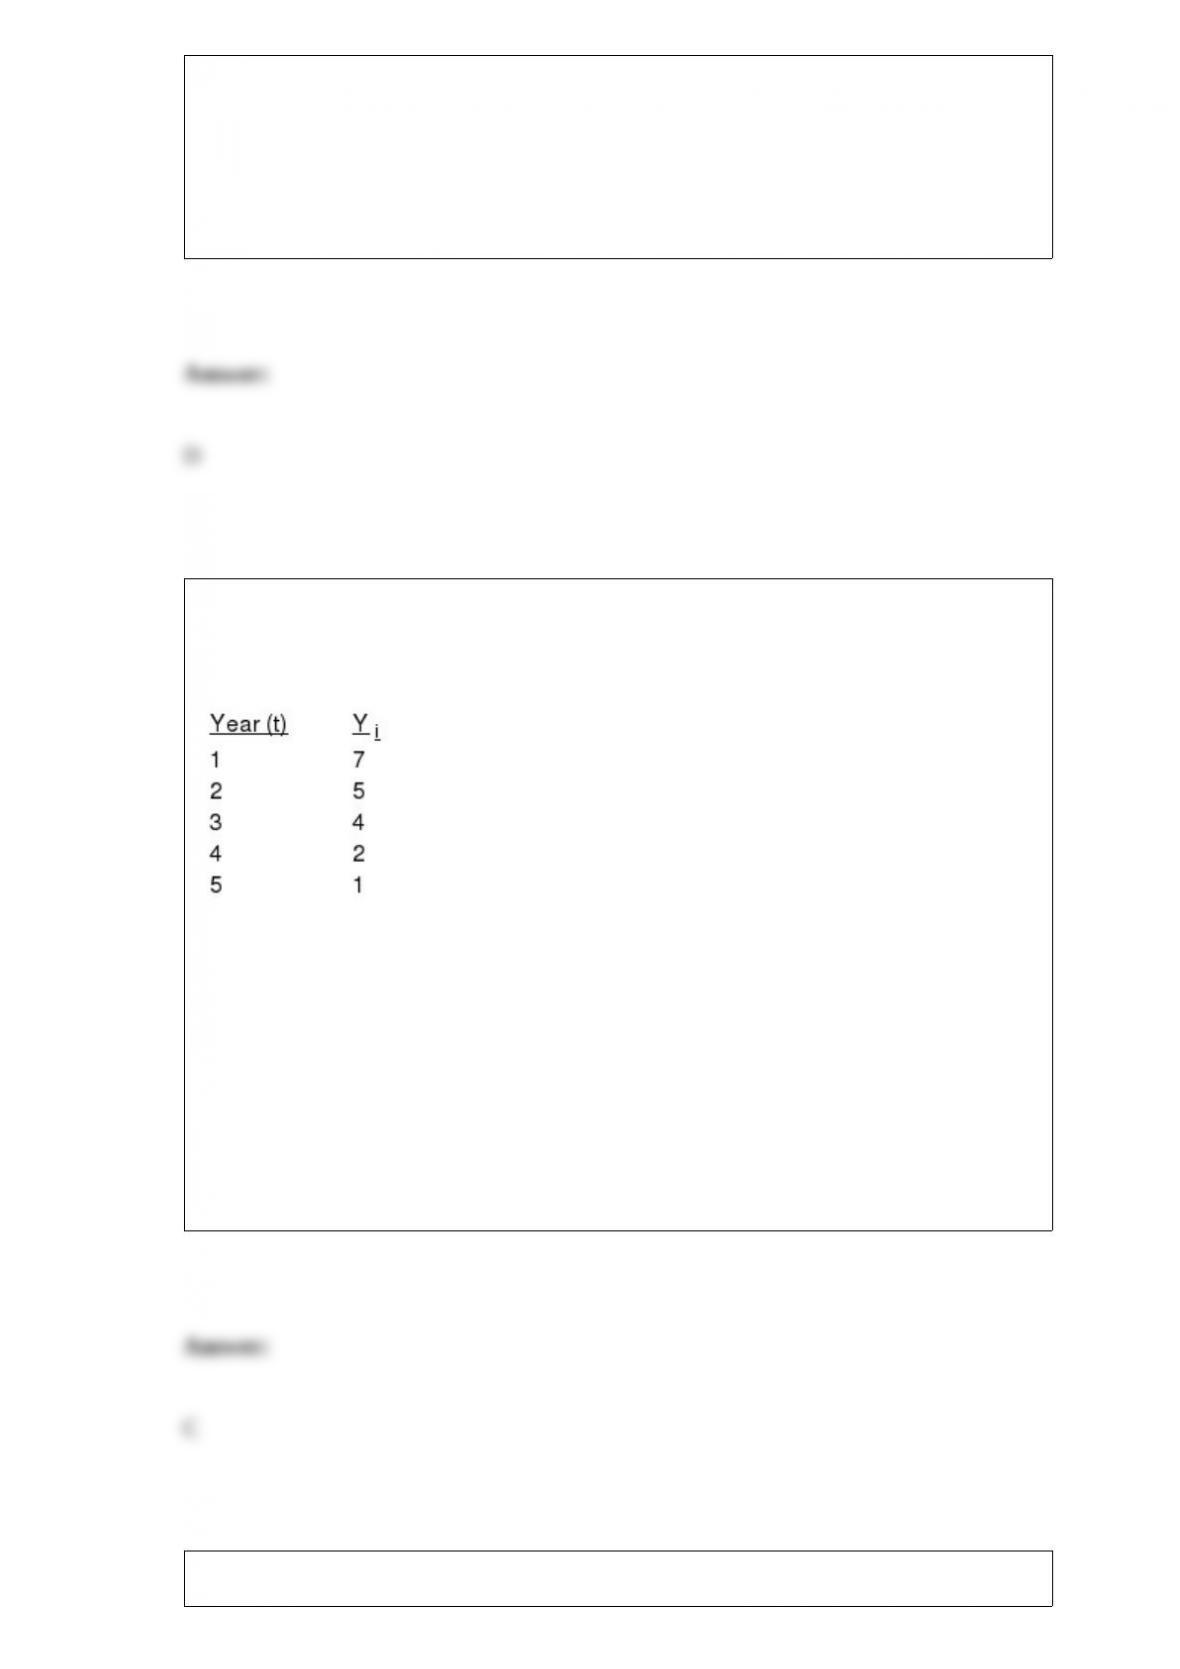
45. Exhibit 17-3
Consider the following time series.
Refer to Exhibit 17-3. The intercept, b0, is
a. -1.5
b. +1.5
c. 8.3
d. -8.3
Exhibit 16-2
In a regression model involving 30 observations, the following estimated regression
equation was obtained.
= 170 + 34x1 – 3x2 + 8x3 + 58x4 + 3x5
For this model, SSR = 1,740 and SST = 2,000.
Refer to Exhibit 16-2. The computed F value for testing the significance of the above
model is
a. 32.12
b. 6.69
c. 4.8
d. 58
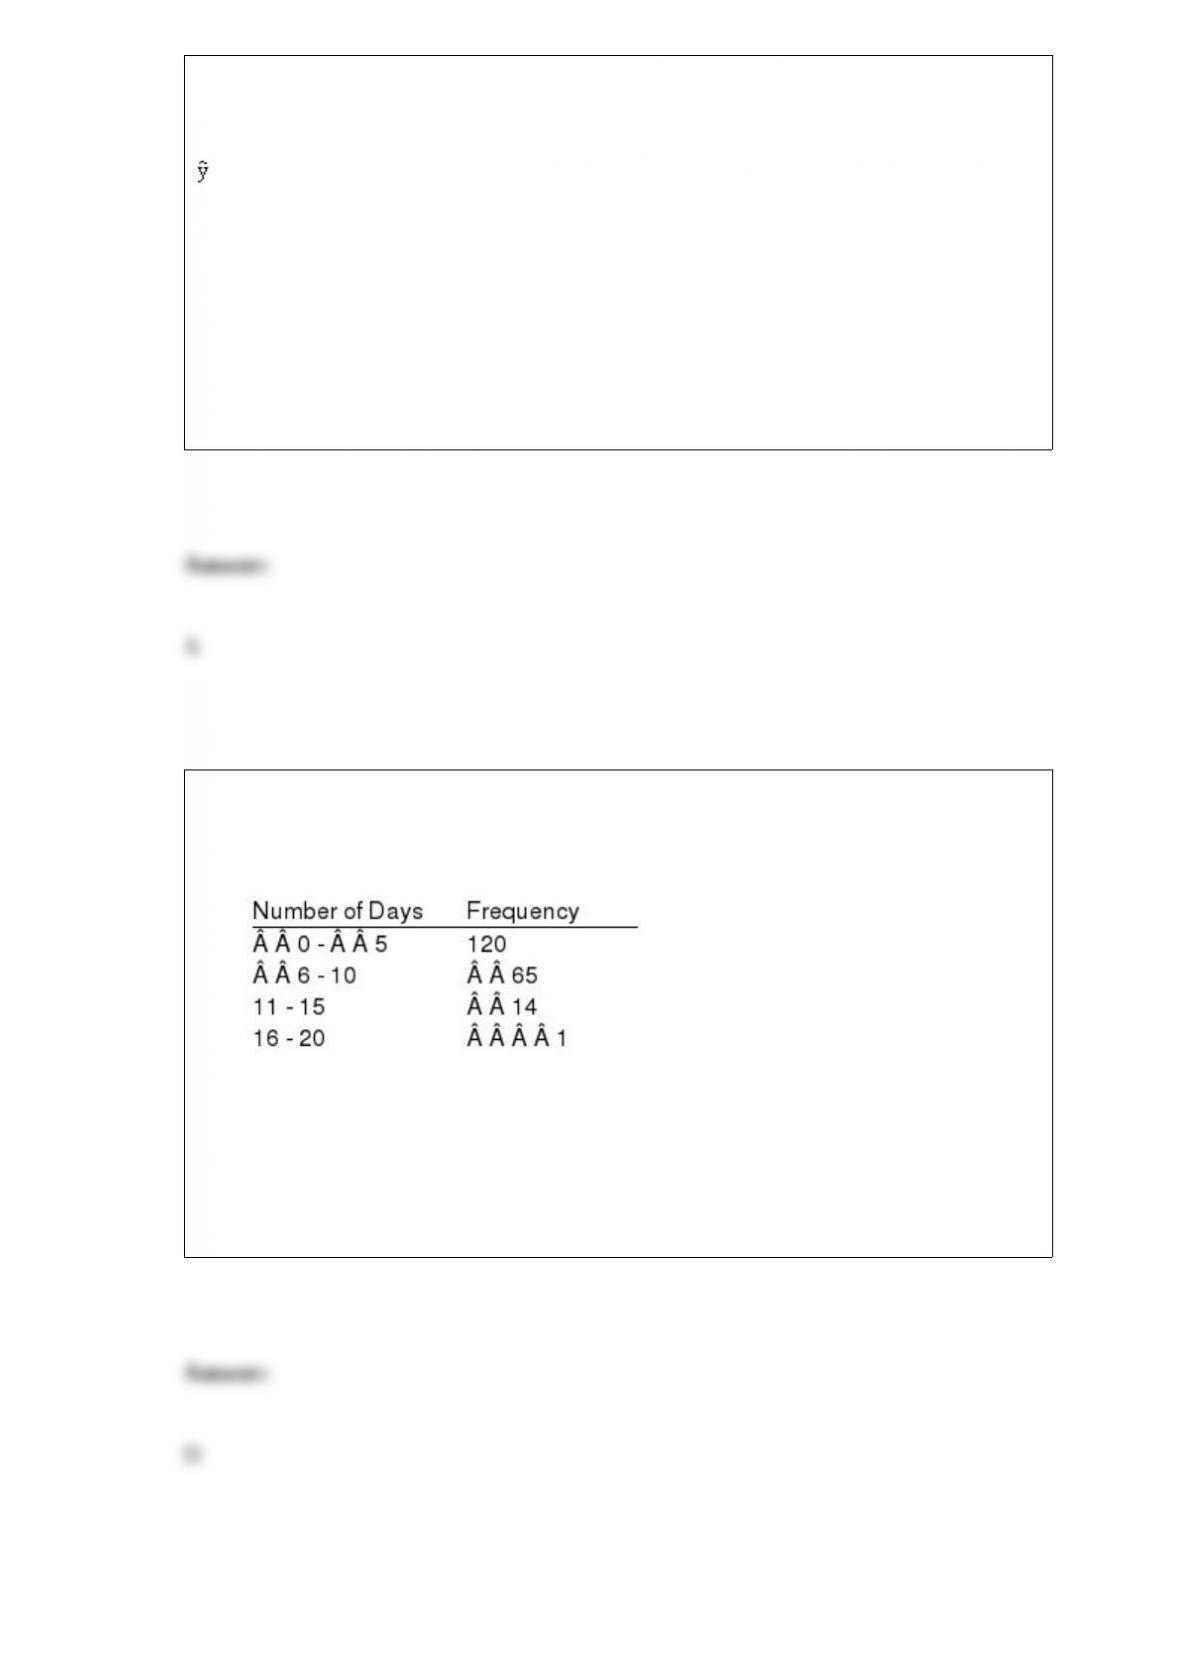
Exhibit 2-3
The number of sick days taken (per month) by 200 factory workers is summarized
below.
Refer to Exhibit 2-3. The percentage of workers who took 0 – 5 sick days per month
was
a. 20%
b. 120%
c. 75%
d. 60%
It is believed that the median age of college students is 21 years. A sample of 80 college
students is taken. Thirty of the students were under 21, 45 of the students were over 21,
and 10 were 21 years old.
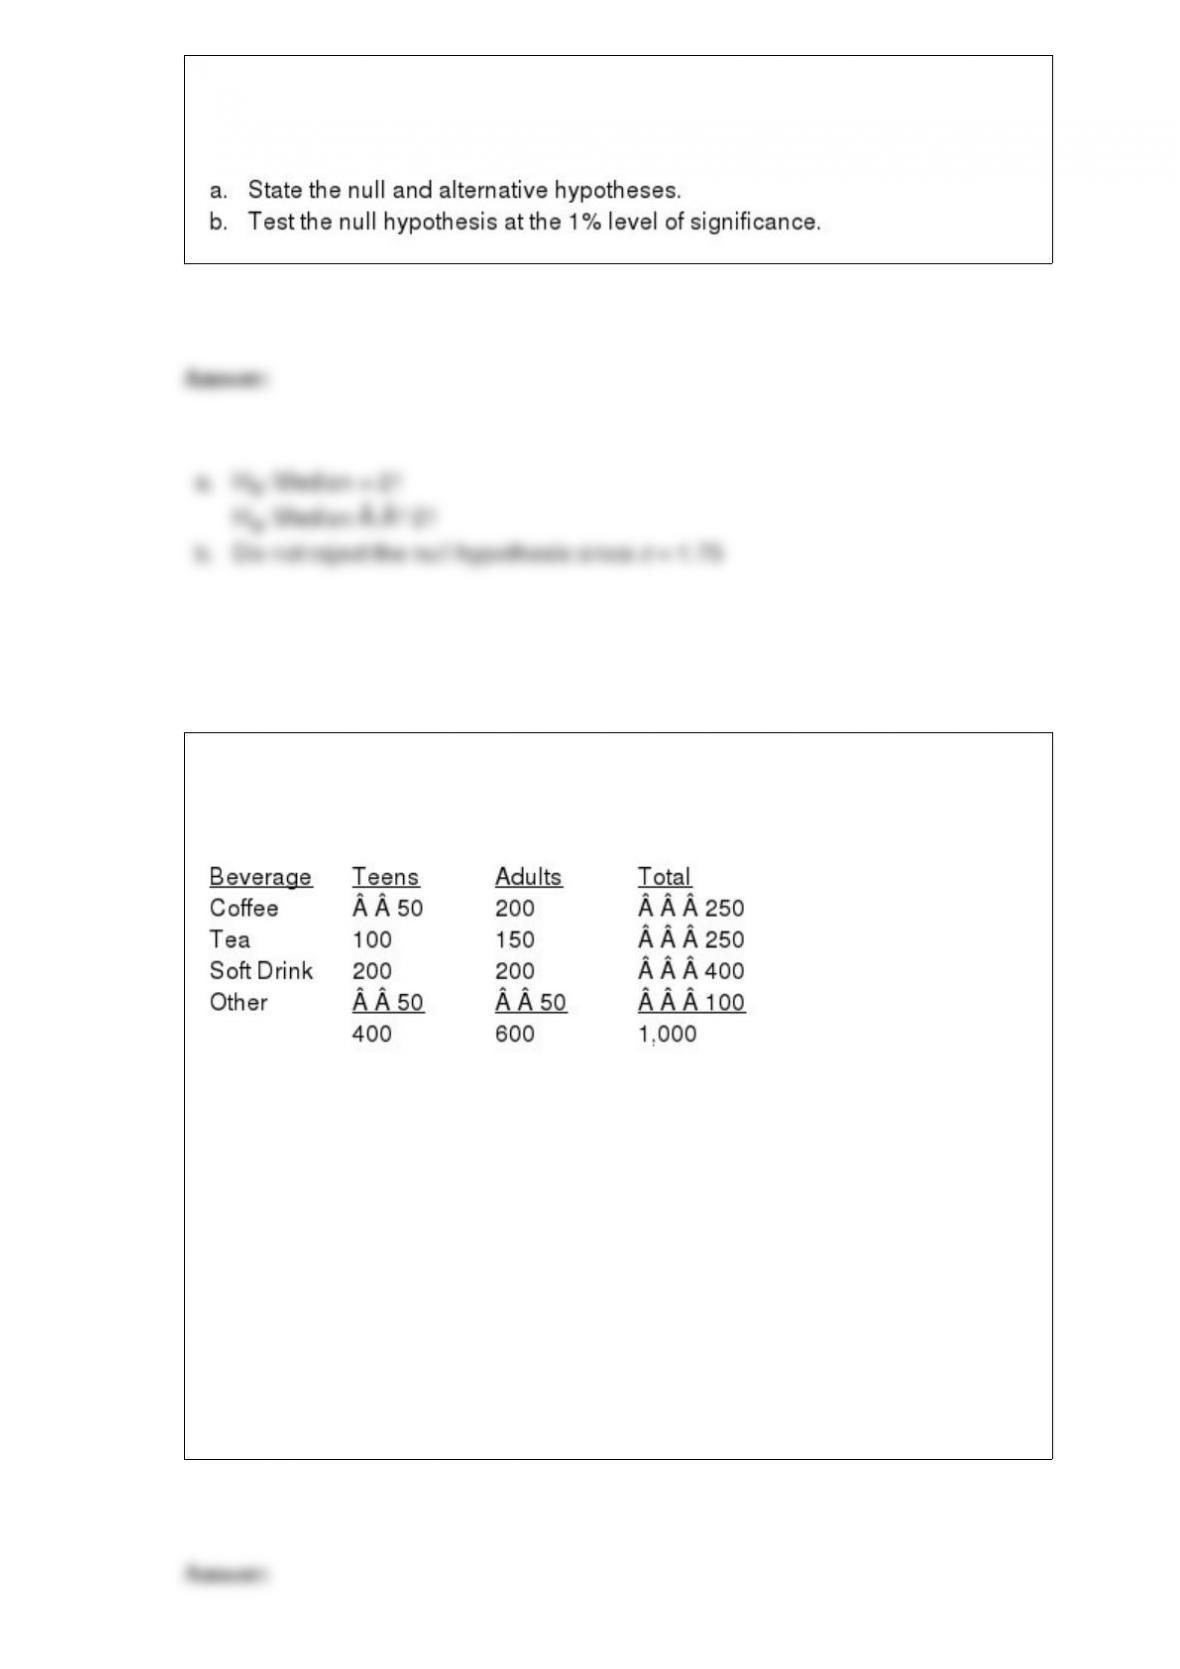
Exhibit 12-5
The table below gives beverage preferences for random samples of teens and adults.
We are asked to test for independence between age (i.e., adult and teen) and drink
preferences.
Refer to Exhibit 12-5. The result of the test is that the
a. hypothesis of independence can be rejected
b. hypothesis of independence cannot be rejected
c. test is inconclusive
d. None of these alternatives is correct.
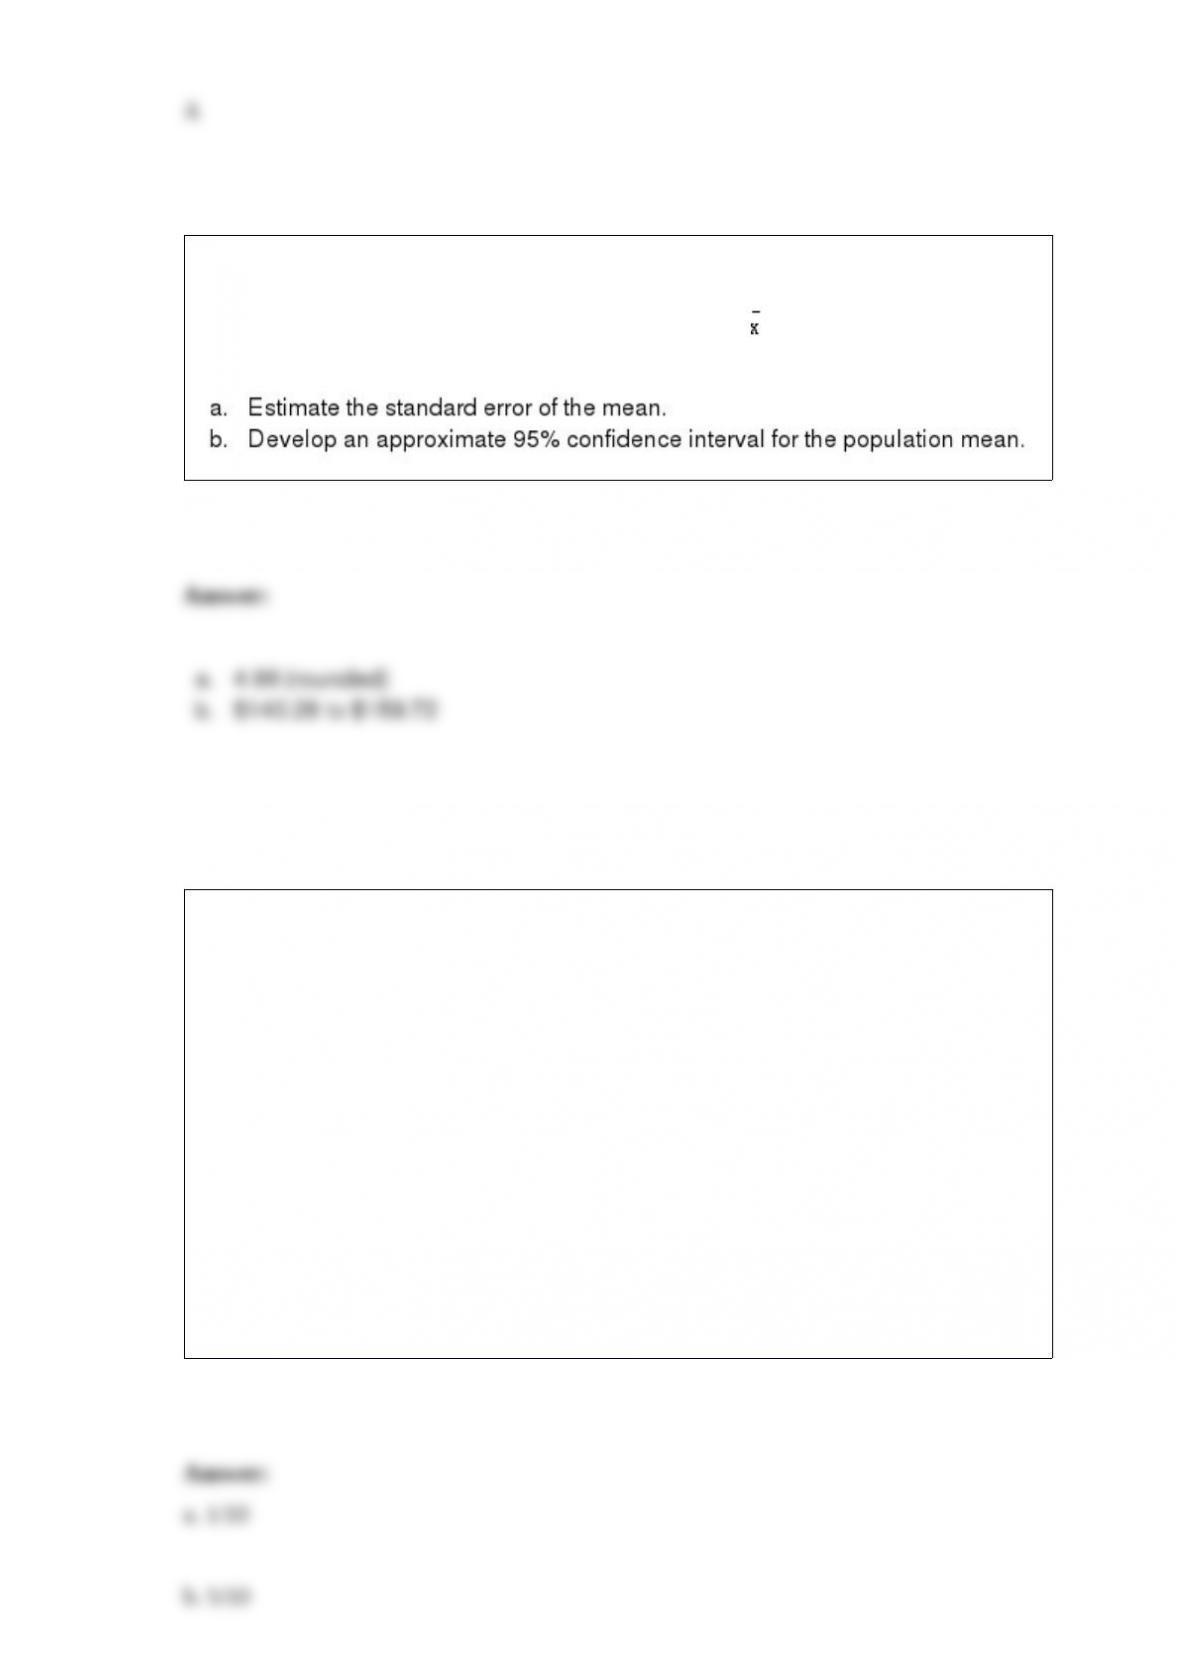
Nancy Joon, Inc. has 1500 employees. A simple random sample of 81 employees was
selected, and the individuals in the sample were asked how much they contribute
(monthly) to their retirement accounts. The sample mean, , was $150 with a standard
deviation, s, of $45.
A very short quiz has one multiple-choice question with five possible choices (a, b, c, d,
and e) and one true or false question. Assume you are taking the quiz but do not have
any idea what the correct answer is to either question, but you mark an answer anyway.
a. What is the probability that you have given the correct answer to both questions?
b. What is the probability that only one of the two answers is correct?
c. What is the probability that neither answer is correct?
d. What is the probability that only your answer to the multiple-choice question is
correct?
e. What is the probability that you have only answered the true or false question
correctly?

If you are conducting an experiment where the probability of a success is .02 and you
are interested in the probability of 4 successes in 15 trials, the correct probability
function to use is the
a. standard normal probability density function
b. normal probability density function
c. Poisson probability function
d. binomial probability function
The time it takes to completely tune an engine of an automobile follows an exponential
distribution with a mean of 40 minutes.
a. Define the random variable in words.
b. What is the probability of tuning an engine in 30 minutes or less?
c. What is the probability of tuning an engine between 30 and 35 minutes?
Ledd Electronics has received a large shipment of power supply units for the desktop
computers being assembled. The units are coming from a new supplier and Ledd is not
sure what the actual defect rate will be for this component. Ledd is considering an
acceptance sampling plan with n = 30 and c = 1.
a. Find the probability of accepting a lot when the defect rate is 2%, 4%, and 6%.
b. What happens to the producer’s risk as the defect rate increases?
c. What happens to the consumer’s risk as the defect rate increases?
In multiple regression analysis, the correlation among the independent variables is
termed
a. homoscedasticity
b. linearity
c. multicollinearity
d. adjusted coefficient of determination
Twenty percent of the applications received for a particular position are rejected. What
is the probability that among the next fourteen applications,
a. none will be rejected?
b. all will be rejected?
c. less than 2 will be rejected?
d. more than four will be rejected?
e. Determine the expected number of rejected applications and its variance.
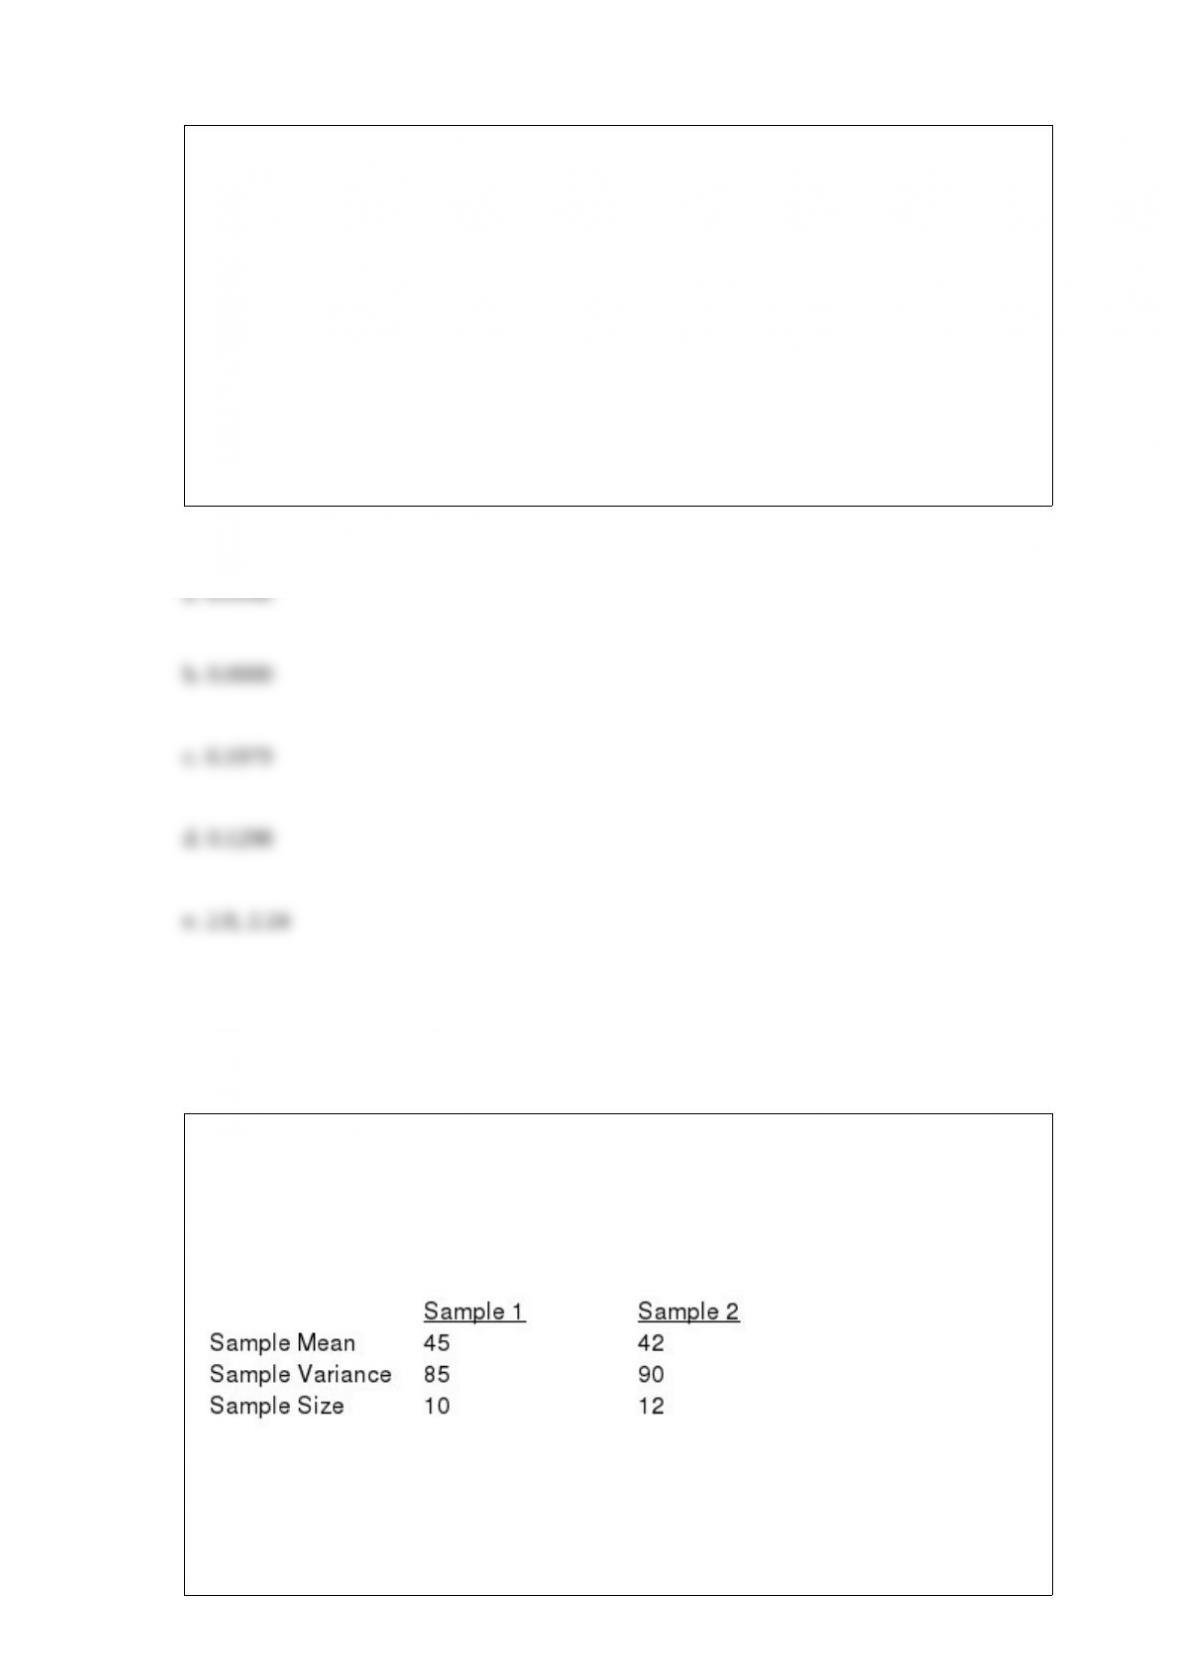
Exhibit 10-4
The following information was obtained from independent random samples.
Assume normally distributed populations with equal variances.
Refer to Exhibit 10-4. The degrees of freedom for the t-distribution are
a. 22

b. 21
c. 20
d. 19