In determining an interval estimate of a population mean when
is unknown, we use a
t distribution with
a. degrees of freedom
b. degrees of freedom
c. n 1 degrees of freedom
d. n degrees of freedom
Read the t statistic from the table of t distributions and circle the correct answer. A
two-tailed test, a sample of 20 at a .20 level of significance; t =
a. 1.328
b. 2.539
c. 1.325
d. 2.528
Exhibit 18-1
Ten people were given two types of cereal, Brand X and Brand Y. Three people
preferred Brand X, 5 people preferred Brand Y, and 2 people were undecided. We want
to determine whether or not the two products are equal.
Refer to Exhibit 18-1. The hypothesis is to be tested at the 5% level. The decision rule
is not to reject the null hypothesis if
a. -1.96 < A < 1.96
b. -2.262 < t < 2.262
c. the number of “+” signs is greater than or equal to 2 and less than or equal to 6
d. the number of “+” signs is greater than or equal to 1 and less than or equal to 7
Ralph’s Gas Station is running a giveaway promotion. With every fill-up of gasoline,
Ralph gives out a lottery ticket that has a 25% chance of being a winning ticket.
Customers who collect four winning lottery tickets are eligible for the “BIG SPIN” for
large payoffs. What is the probability of qualifying for the big spin if a customer fills
up: (a) 3 times; (b) 4 times; (c) 7 times?
In order to determine the average weight of carry-on luggage by passengers in
airplanes, a sample of 36 pieces of carry-on luggage was weighed. The average weight
was 20 pounds. Assume that we know the standard deviation of the population to be 8
pounds.
A simple random sample of 28 observations was taken from a large population. The
sample mean equaled 50. Fifty is a
a. population parameter
b. point estimator
c. sample parameter
d. point estimate
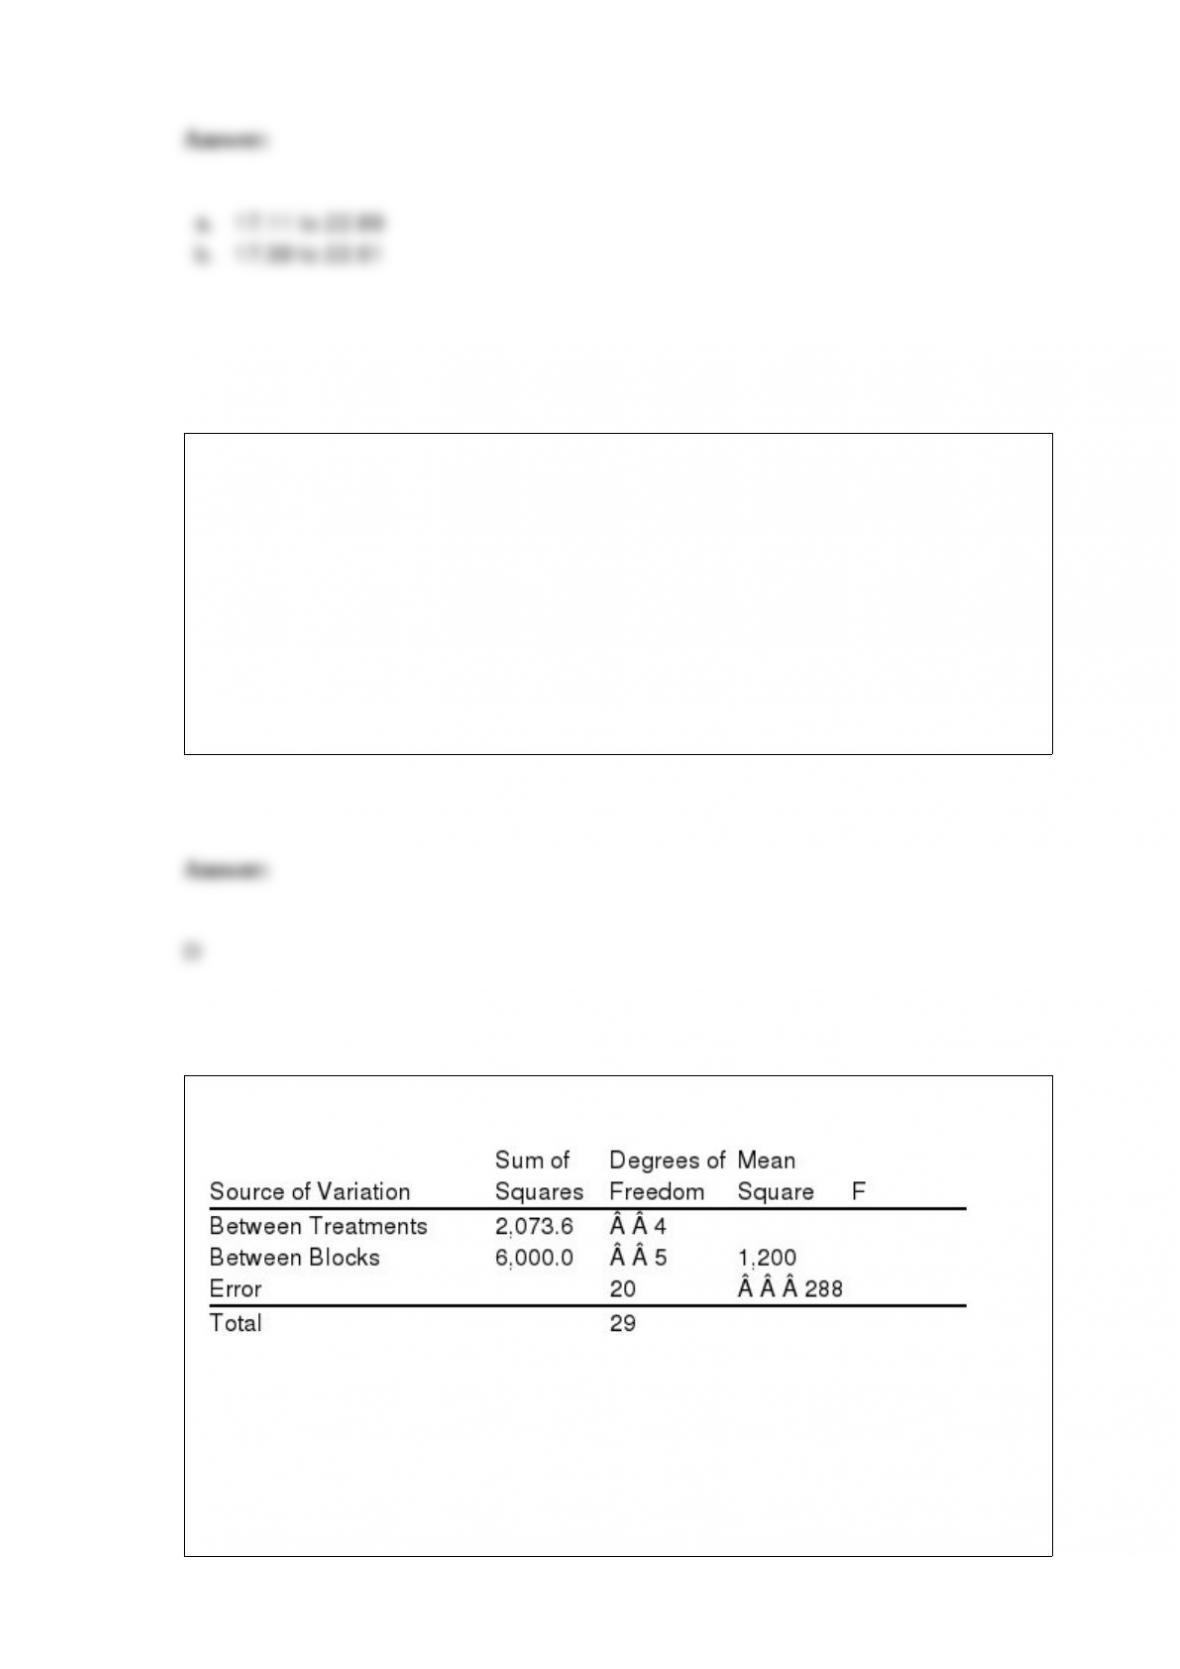
Exhibit 13-2
Refer to Exhibit 13-2. The null hypothesis for this ANOVA problem is
a. 1=2=3=4
b. 1=2=3=4=5
c. 1=2=3=4=5=6
d. 1=2= … =20

The average number of calls received by a switchboard in a 30-minute period is 15.
a. Define the random variable in words for this experiment.
b. What is the probability that between 10:00 and 10:30 the switchboard will receive
exactly 10 calls?
c. What is the probability that between 10:00 and 10:30 the switchboard will receive
more than 9 calls but fewer than 15 calls?
d. What is the probability that between 10:00 and 10:30 the switchboard will receive
fewer than 7 calls?
The Harbor Island Ferry leaves on the hour and at 15-minute intervals. The time, x, it
takes John to drive from his house to the ferry has a uniform distribution with x
between 10 and 20 minutes. One morning John leaves his house at precisely 8:00a.m.
a. What is the probability John will wait less than 5 minutes for the ferry?
b. What is the probability John will wait less than 10 minutes for the ferry?
c. What is the probability John will wait less than 15 minutes for the ferry?
d. What is the probability John will not have to wait for the ferry?

e. Suppose John leaves at 8:05a.m. What is the probability John will wait (1) less than 5
minutes for the ferry; (2) less than 10 minutes for the ferry?
f. Suppose John leaves at 8:10a.m. What is the probability John will wait (1) less than 5
minutes for the ferry; (2) less than 10 minutes for the ferry?
g. What appears to be the best time for John to leave home if he wishes to maximize the
probability of waiting less than 10 minutes for the ferry?
Exhibit 15-7
A regression model involving 4 independent variables and a sample of 15 periods
resulted in the following sum of squares.
SSR = 165
SSE = 60
Refer to Exhibit 15-7. The coefficient of determination is
a. 0.3636
b. 0.7333

c. 0.275
d. 0.5
__________ is an example of an existing source of data.
a. An experimental study
b. An uncontrolled experimental study
c. U. S. Census Bureau
d. An observational study
In multiple regression analysis,
a. there can be any number of dependent variables but only one independent variable
b. there must be only one independent variable
c. the coefficient of determination must be larger than 1
d. there can be several independent variables, but only one dependent variable
Excel provides functions for computing the
a. mean
b. median
c. mode
d. Excel provides functions for all of these.
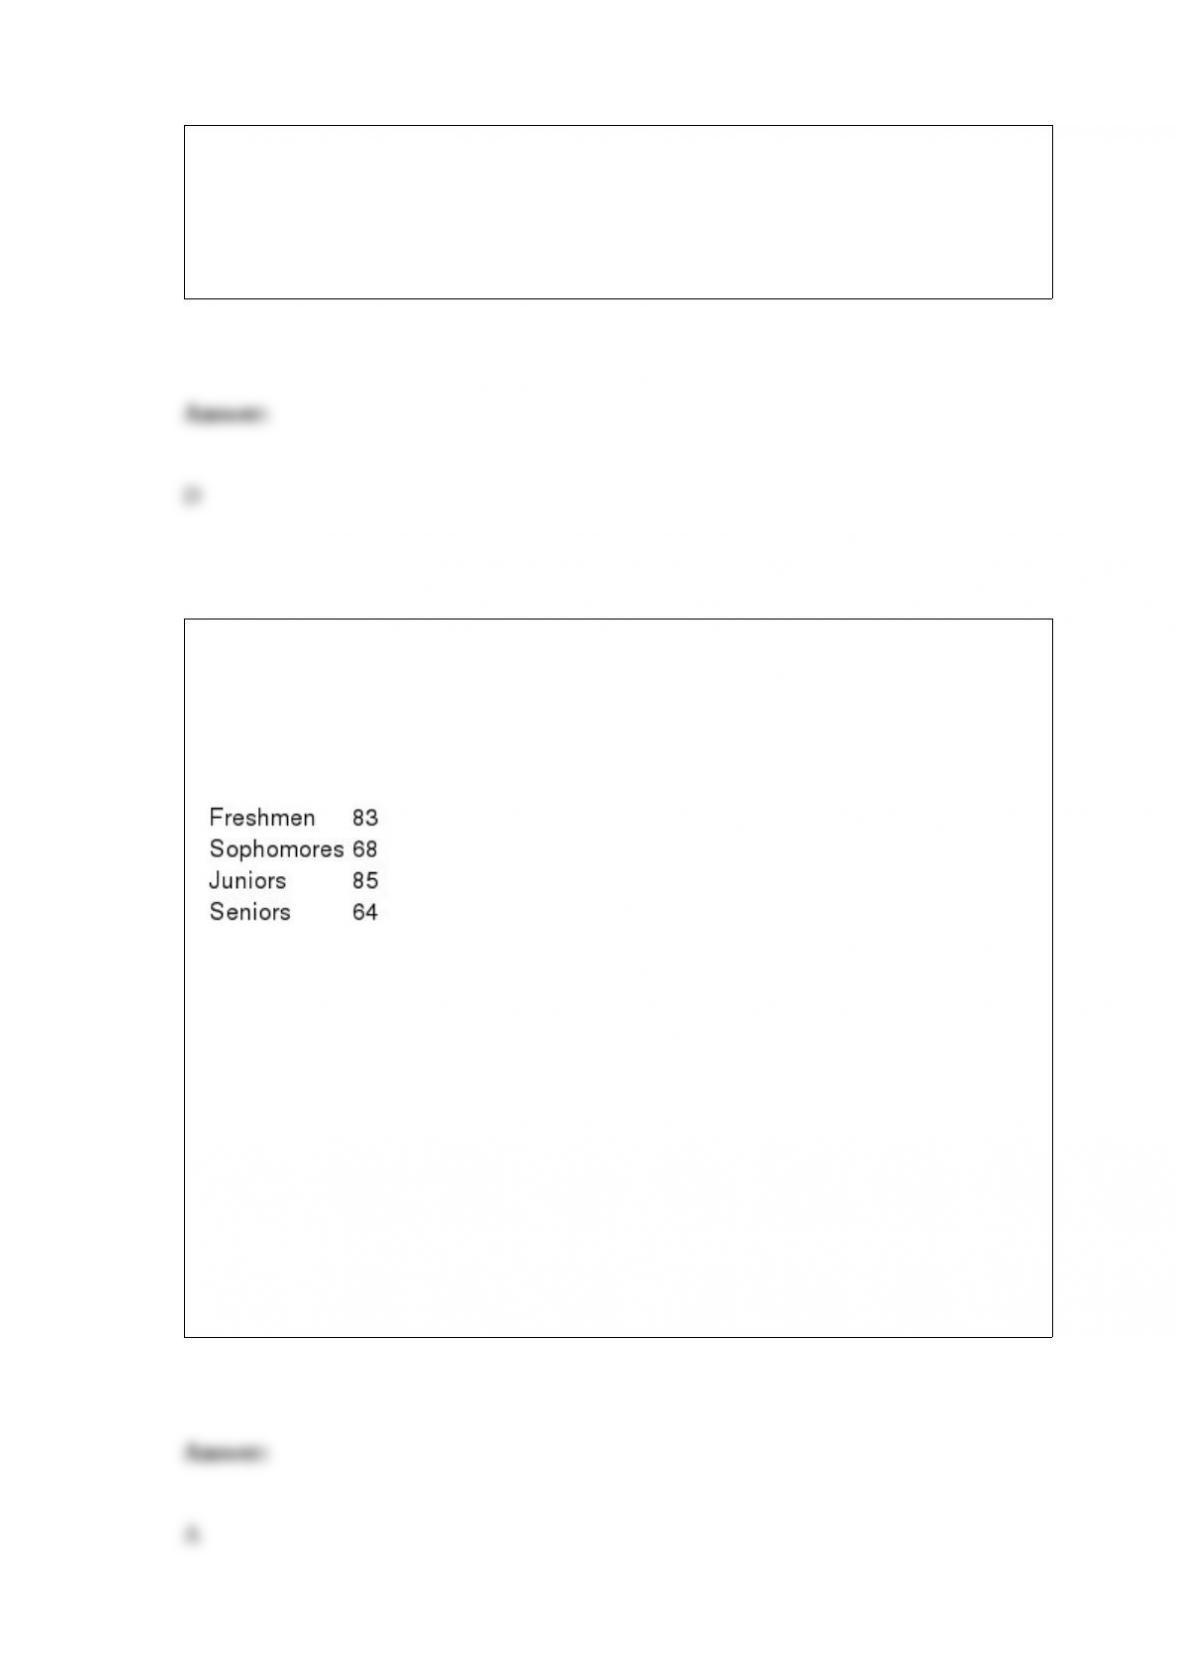
Exhibit 12-2
Last school year, the student body of a local university consisted of 30% freshmen, 24%
sophomores, 26% juniors, and 20% seniors. A sample of 300 students taken from this
year’s student body showed the following number of students in each classification.
We are interested in determining whether or not there has been a significant change in
the classifications between the last school year and this school year.
Refer to Exhibit 12-2. The expected frequency of seniors is
a. 60
b. 20%
c. 68
d. 64

Exhibit 18-2
Students in statistics classes were asked whether they preferred a 10-minute break or to
get out of class 10 minutes early. In a sample of 150 students, 40 preferred a 10-minute
break, 80 preferred to get out 10 minutes early, and 30 had no preference. We want to
determine if there is a difference in students’ preferences.
Refer to Exhibit 18-2. The test statistic based on the number of students who preferred
to get out early equals
a. -3.65
b. 0.67
c. 0.82
d. 3.65
Exhibit 16-1
In a regression analysis involving 25 observations, the following estimated regression
equation was developed.
= 10 – 18x1 + 3x2 + 14x3
Also, the following standard errors and the sum of squares were obtained.
Sb1 = 3 Sb2 = 6 Sb3 = 7
SST = 4,800 SSE = 1,296
Refer to Exhibit 16-1. The coefficient of x3
a. is significant
b. is not significant
c. cannot be tested, because not enough information is provided
d. None of these alternatives is correct.
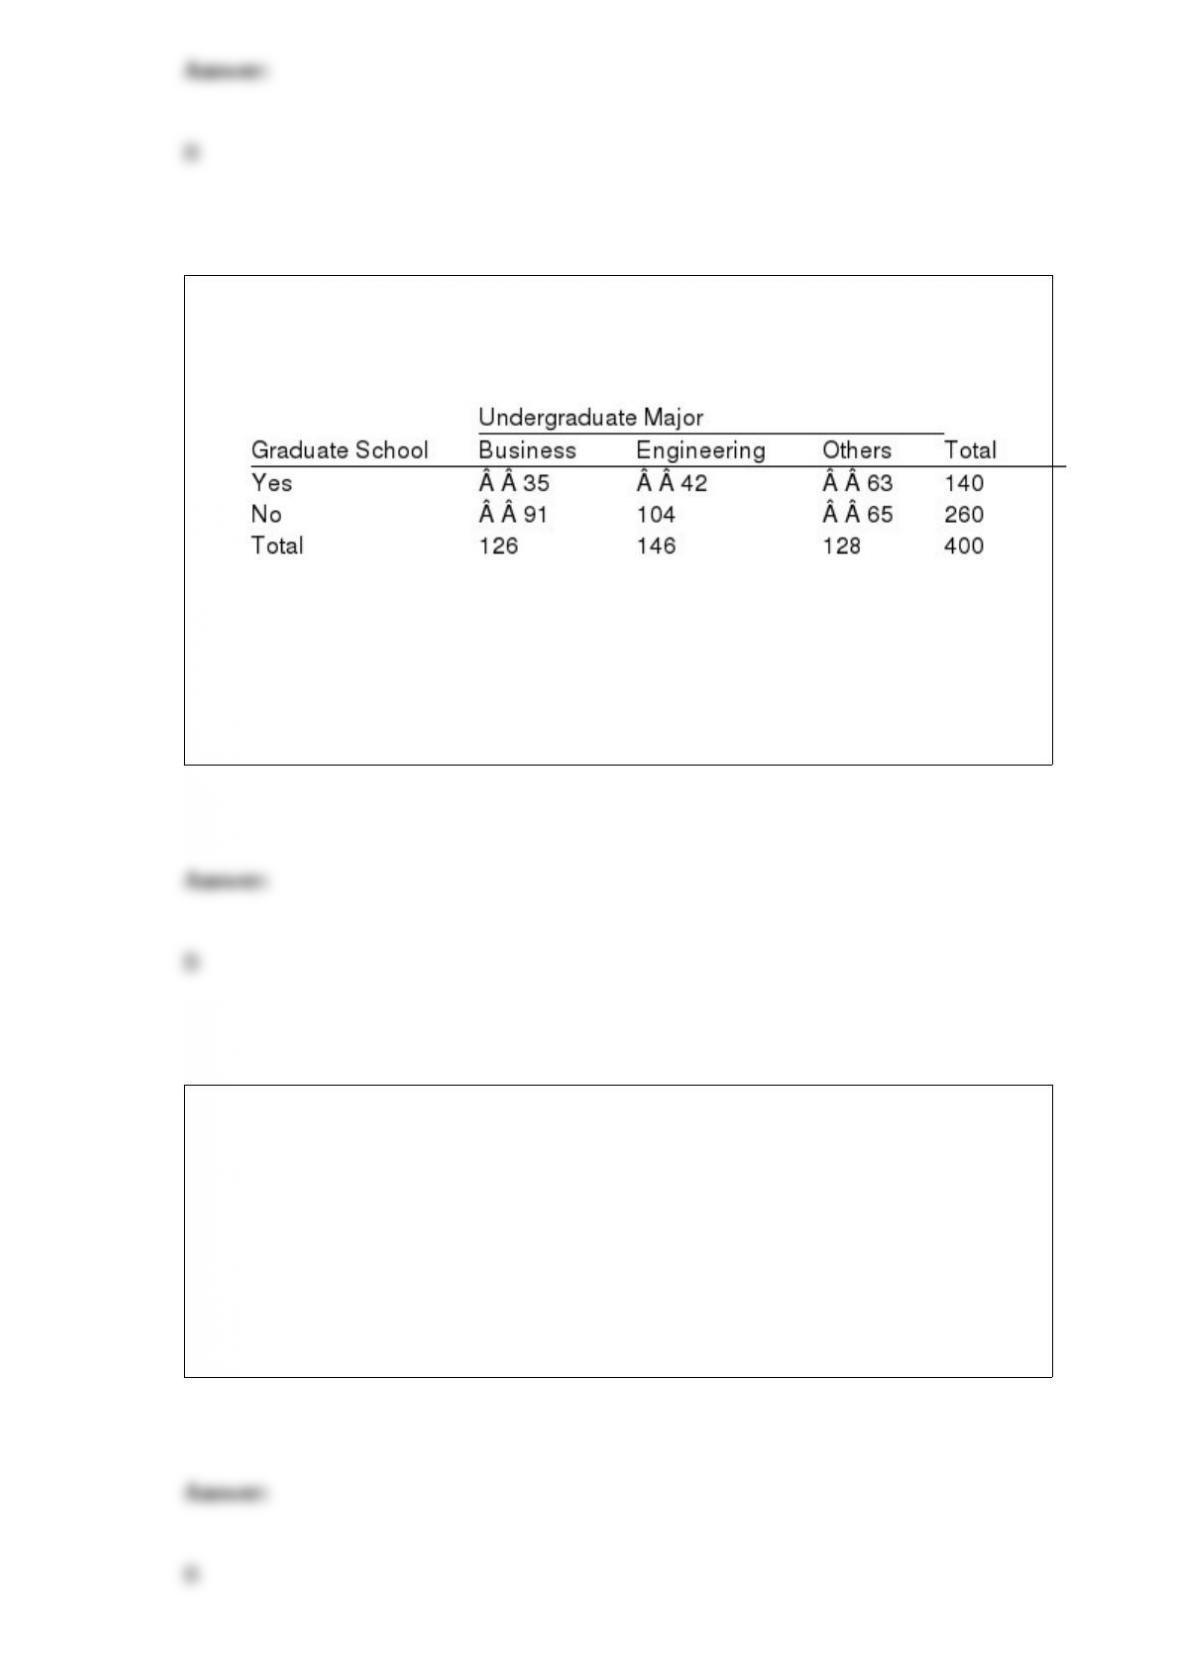
Exhibit 2-4
A survey of 400 college seniors resulted in the following crosstabulation regarding their
undergraduate major and whether or not they plan to go to graduate school.
Refer to Exhibit 2-4. Among the students who plan to go to graduate school, what
percentage indicated “Other” majors?
a. 15.75
b. 45
c. 54
d. 35
Exhibit 3-3
Suppose annual salaries for sales associates from a particular store have a bell-shaped
distribution with a mean of $32,500 and a standard deviation of $2,500.
Refer to Exhibit 3-3. The z-score for a sales associate from this store who earns $37,500
is
a. 37.5
b. 2
c. -2
d. 0.92

The interquartile range is used as a measure of variability to overcome what difficulty
of the range?
a. the sum of the range variances is zero
b. the range is difficult to compute
c. the range is influenced too much by extreme values
d. the range is negative
Which of the following does not need to be known in order to compute the p-value?
a. knowledge of whether the test is one-tailed or two-tailed
b. the value of the test statistic
c. the level of significance
d. All of these are needed.
Process control and acceptance sampling procedures are most closely related to
a. linear regression procedures
b. interval estimation procedures
c. hypothesis testing procedures
d. analysis of variance procedures
The probability of an intersection of two events is computed using the
a. addition law
b. subtraction law
c. multiplication law
d. division law
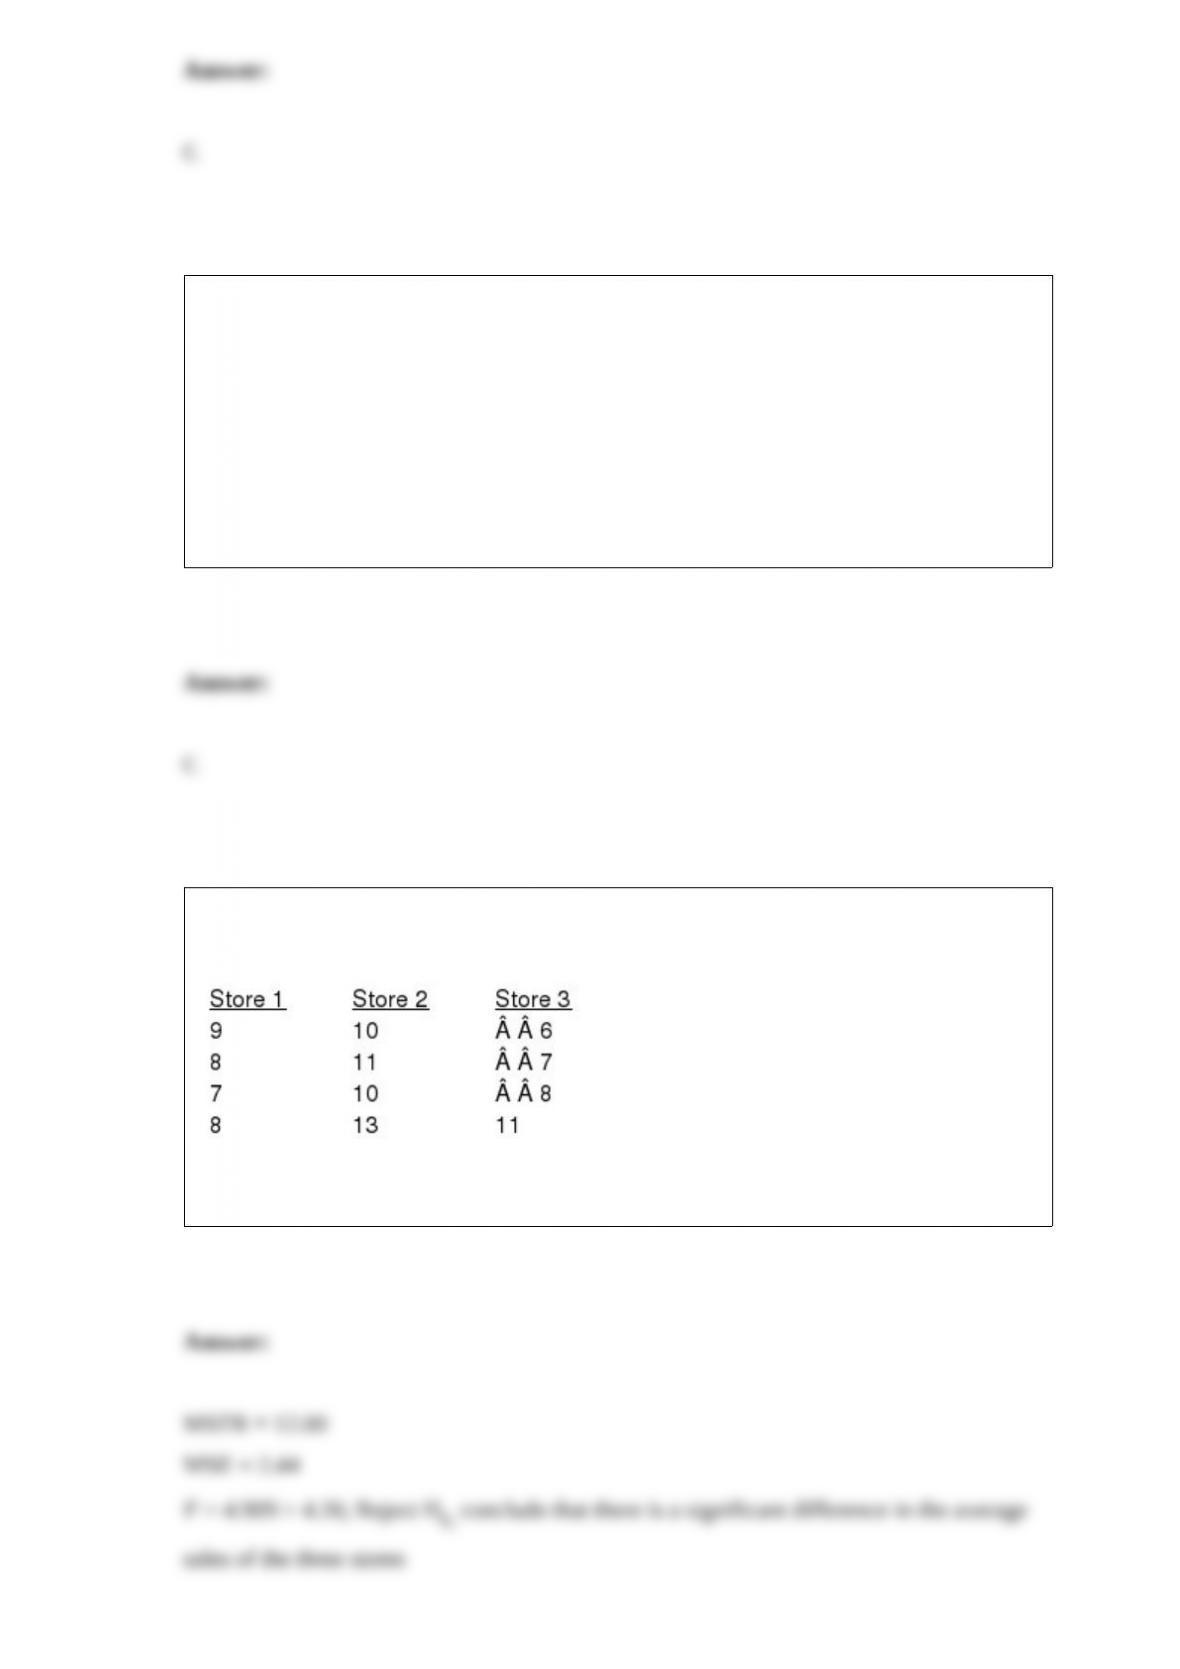
MNM, Inc. has three stores located in three different areas. Random samples of the
daily sales of the three stores (in $1,000) are shown below.
At a 5% level of significance, test to see if there is a significant difference in the
average sales of the three stores.
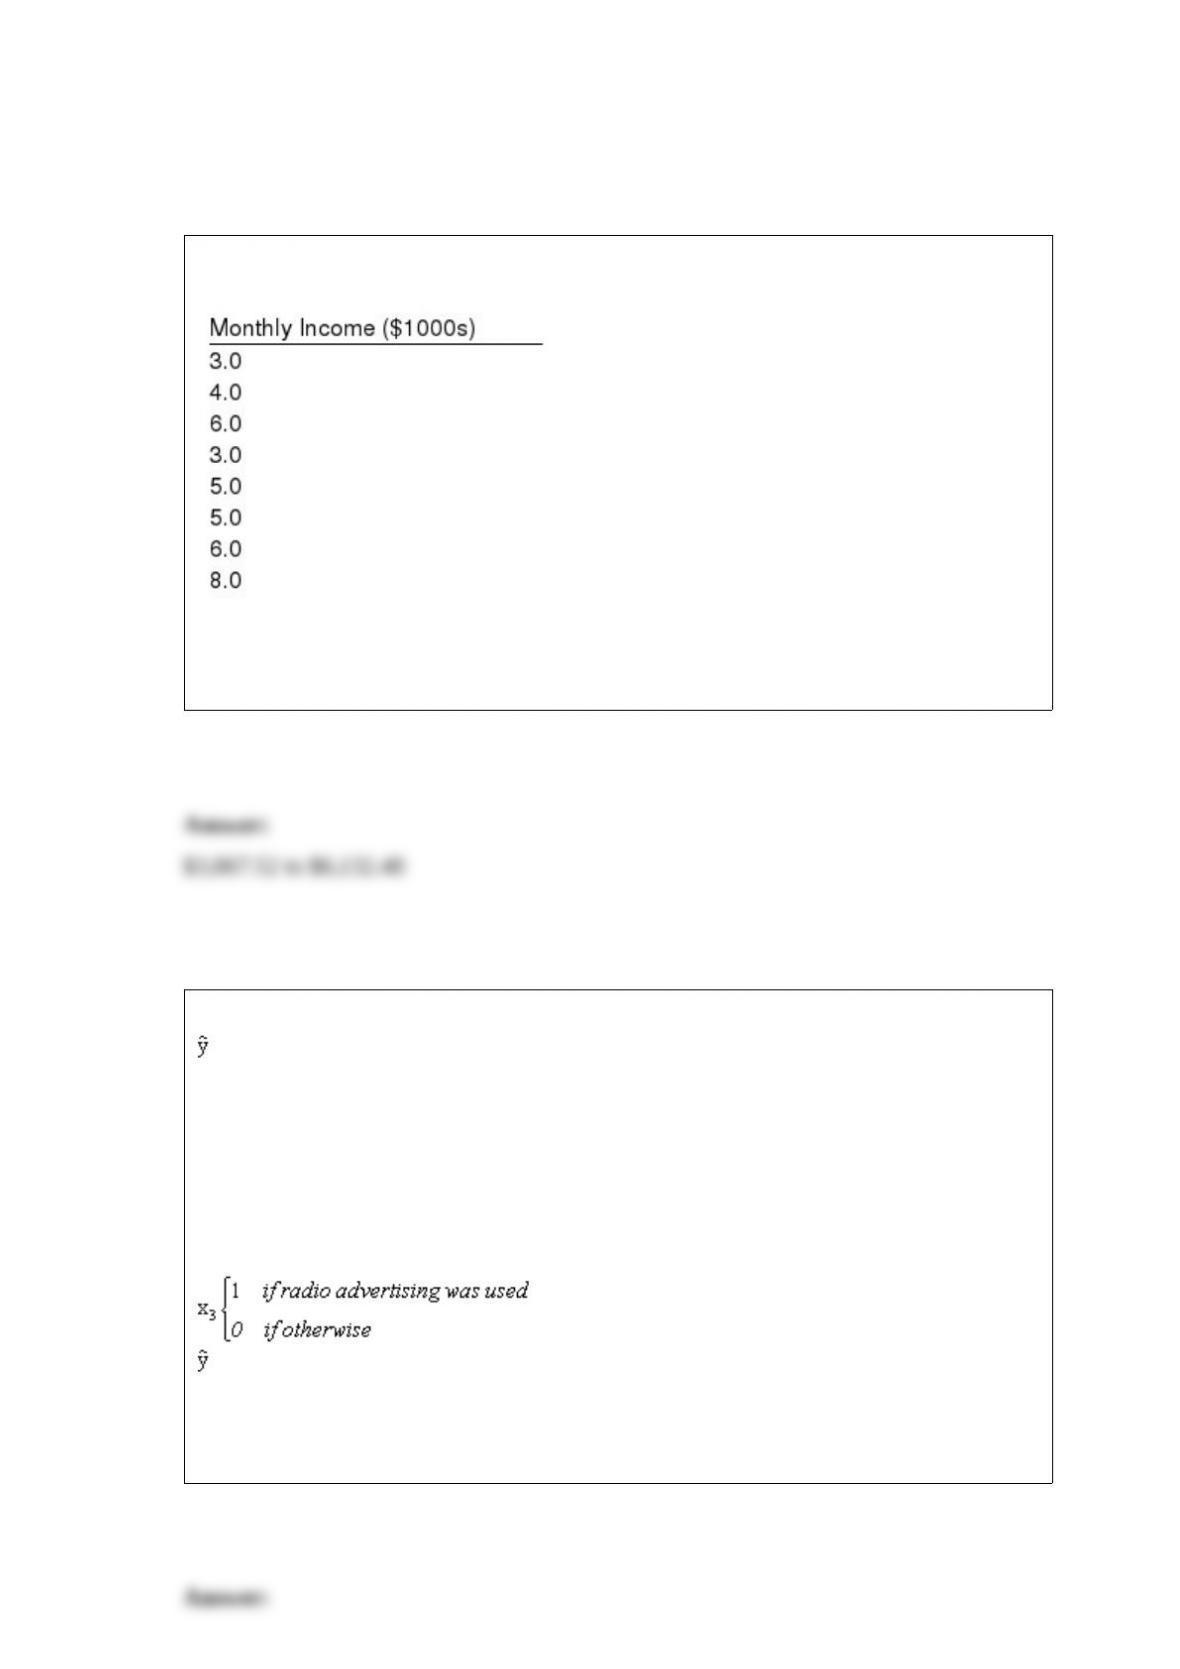
The monthly incomes from a random sample of faculty at a university are shown below.
Compute a 90% confidence interval for the mean of the population. The population of
all faculty incomes is known to be normally distributed. Give your answer in dollars.
The following regression model has been proposed to predict sales at a computer store.
= 50 – 3x1 + 20x2 + 10x3
where
x1 = competitor’s previous day’s sales (in $1,000s)
x2 = population within 1 mile (in 1,000s)
= sales (in $1000s)
Predict sales (in dollars) for a store with the competitor’s previous day’s sale of $5,000,
a population of 20,000 within 1 mile, and nine radio advertisements.
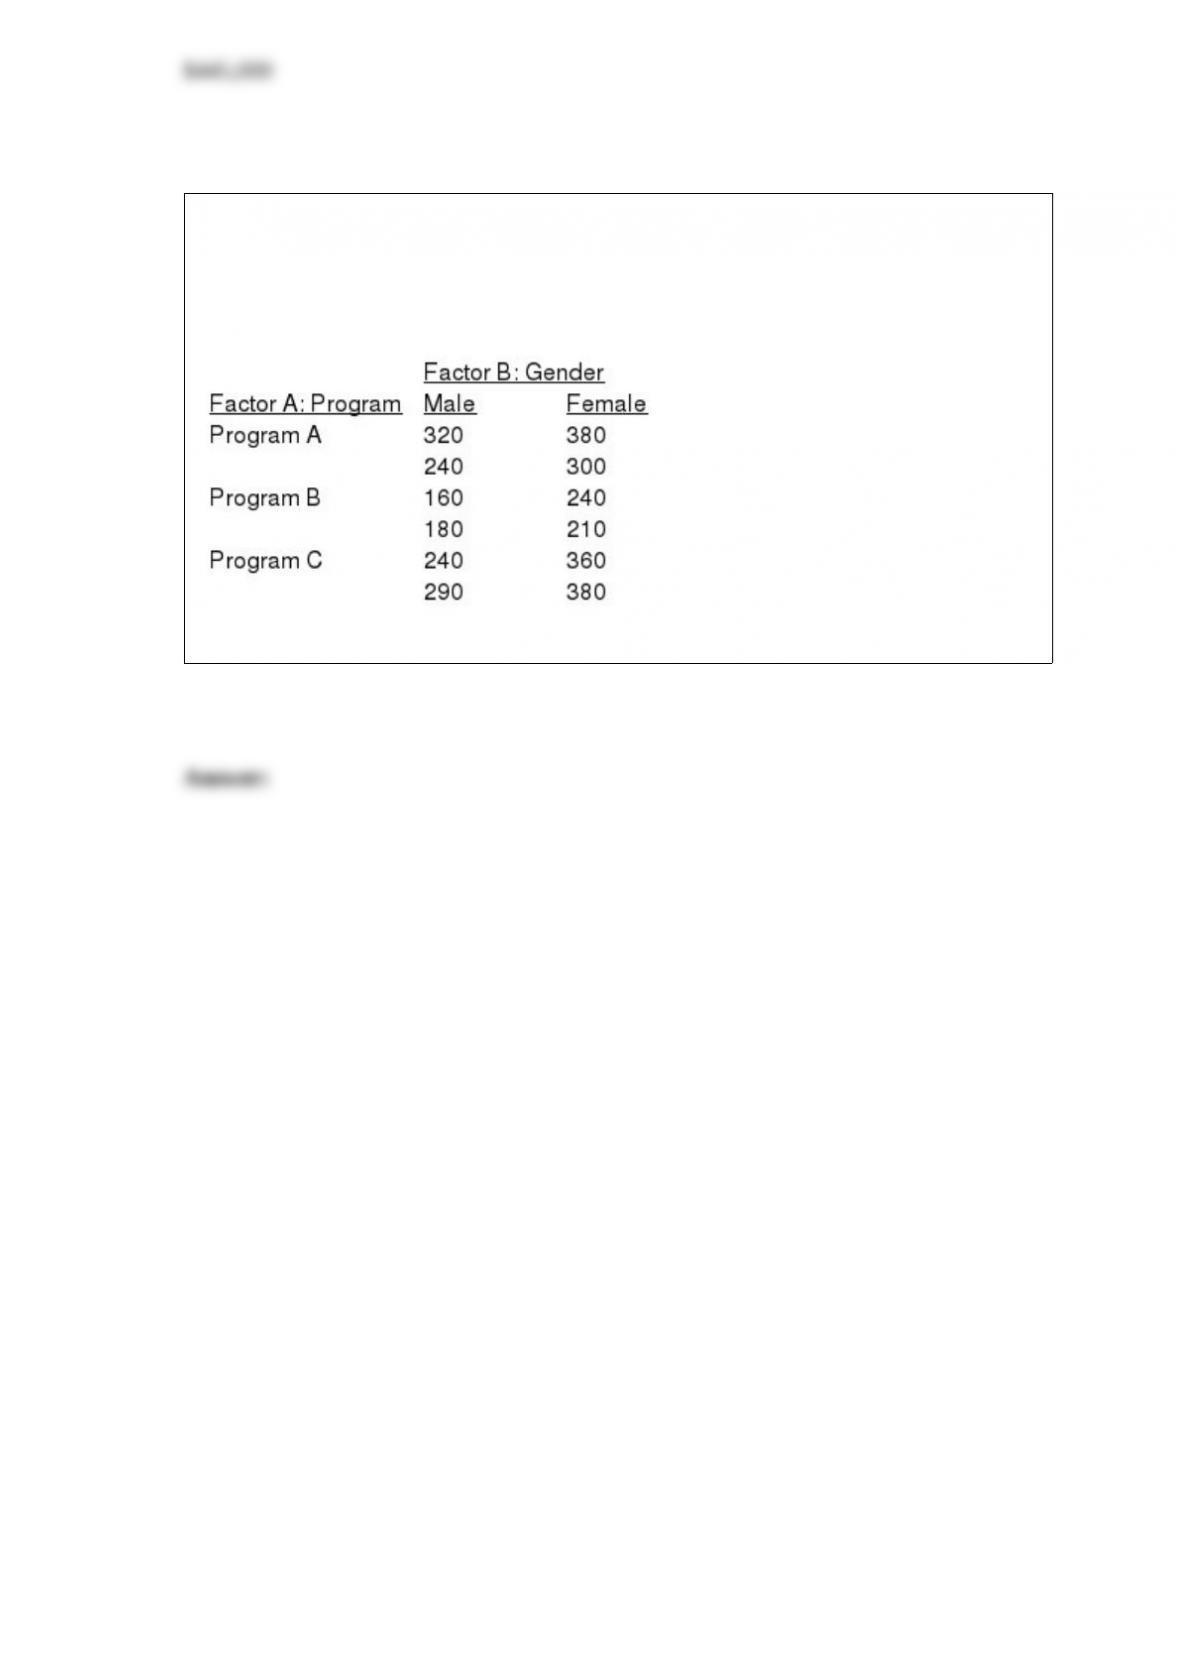
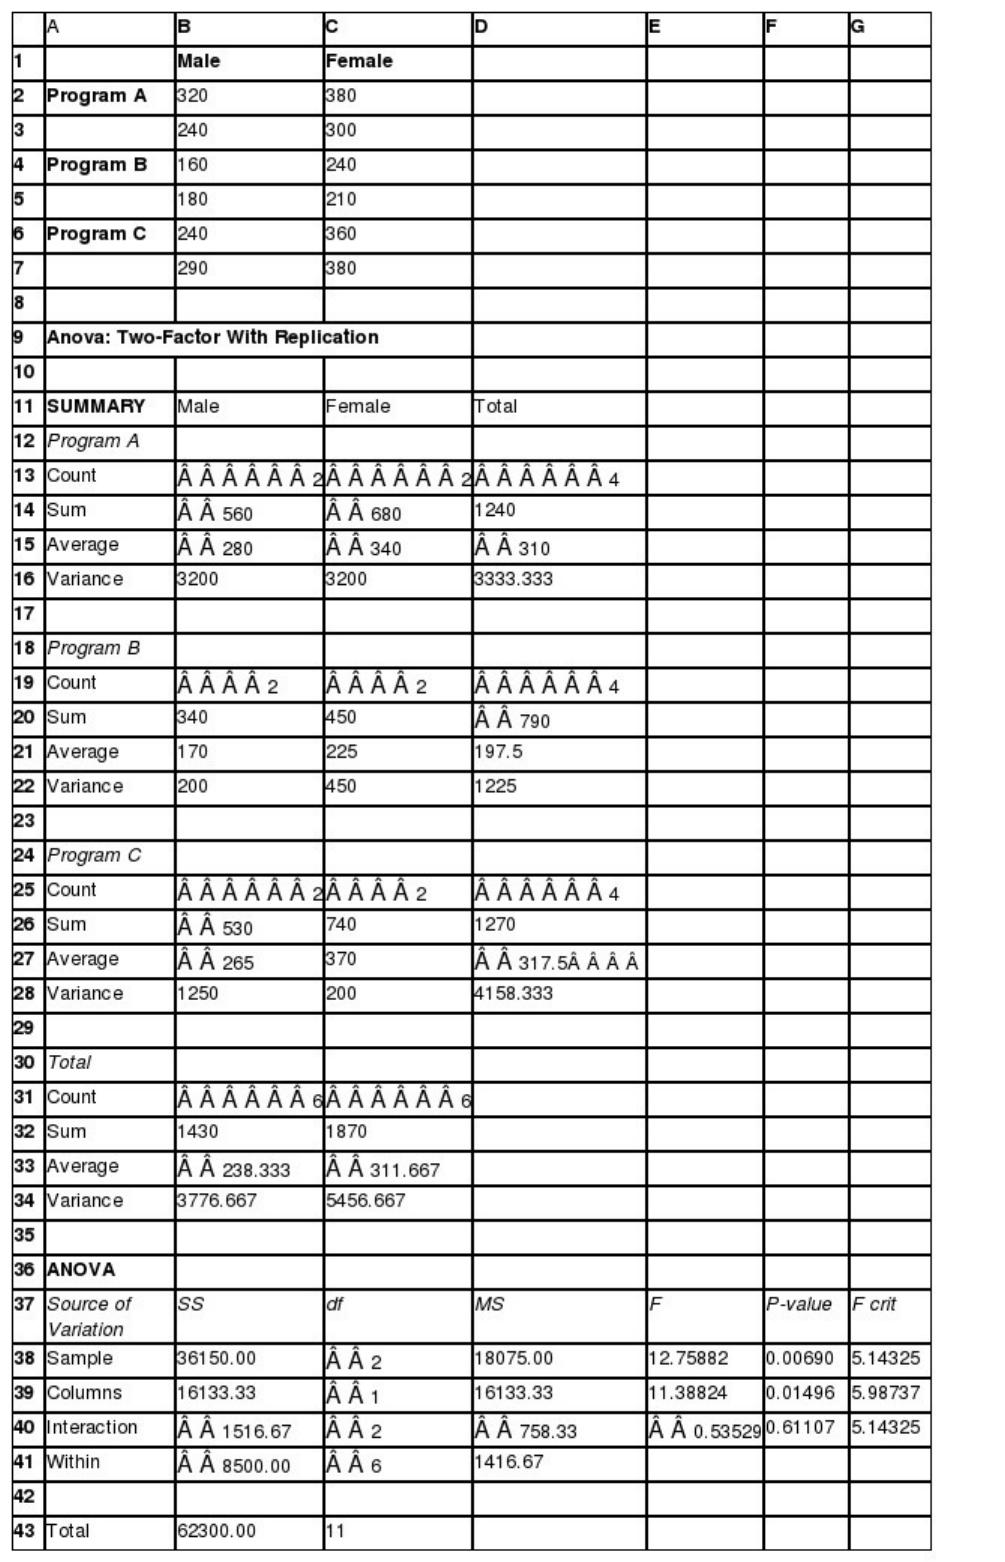
Employees of MNM Corporation are about to undergo a retraining program.
Management is trying to determine which of three programs is the best. They believe
that the effectiveness of the programs may be influenced by gender. A factorial
experiment was designed. You are given the following information.
What advice would you give MNM? Use Excel and a .05 level of significance.
The standard deviation of the ages of a sample of 16 executives from the northern states
was 8.2 years; while the standard deviation of the ages of a sample of 25 executives
from the southern states was 8 years. At = 0.1, test to see if there is any difference in
the standard deviations of the ages of all the northern and southern executives.
In grading eggs into small, medium, and large, the Linda Farms packs the eggs that
weigh more than 3.6 ounces in packages marked “large” and the eggs that weigh less
than 2.4 ounces into packages marked ‘small”; the remainder are packed in packages
marked “medium.” If a day’s packaging contained 10.2% large and 4.18% small eggs,
determine the mean and the standard deviation for the eggs’ weights. Assume that the
distribution of the weights is normal.
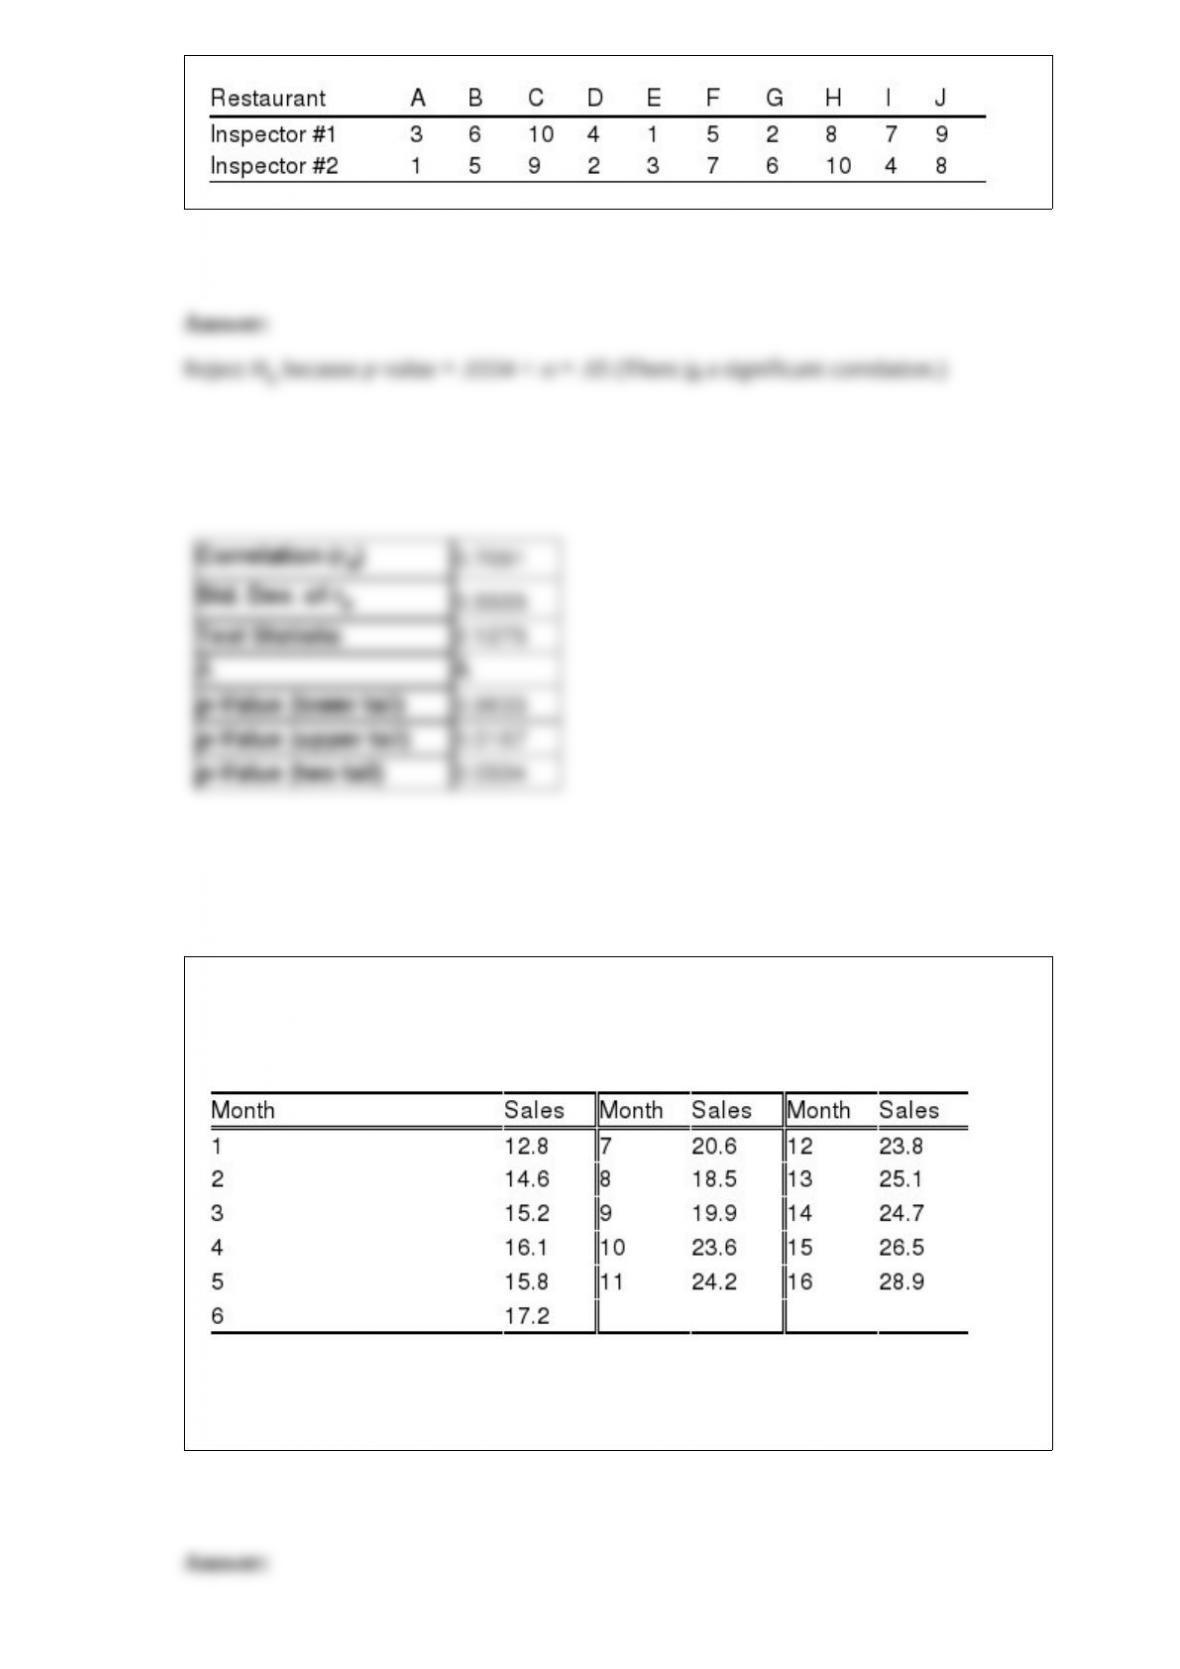
The Suburbia Health Department inspects restaurants for compliance to laws regulating
the storage, preparation, and serving of food to the public. Two of the department’s
inspectors ranked ten restaurants in terms of cleanliness as shown below (with a 1
indicating cleanest and 10 indicating least clean). Use rank correlation, with
= .05, to
comment on the agreement of the two inspectors’ rankings.
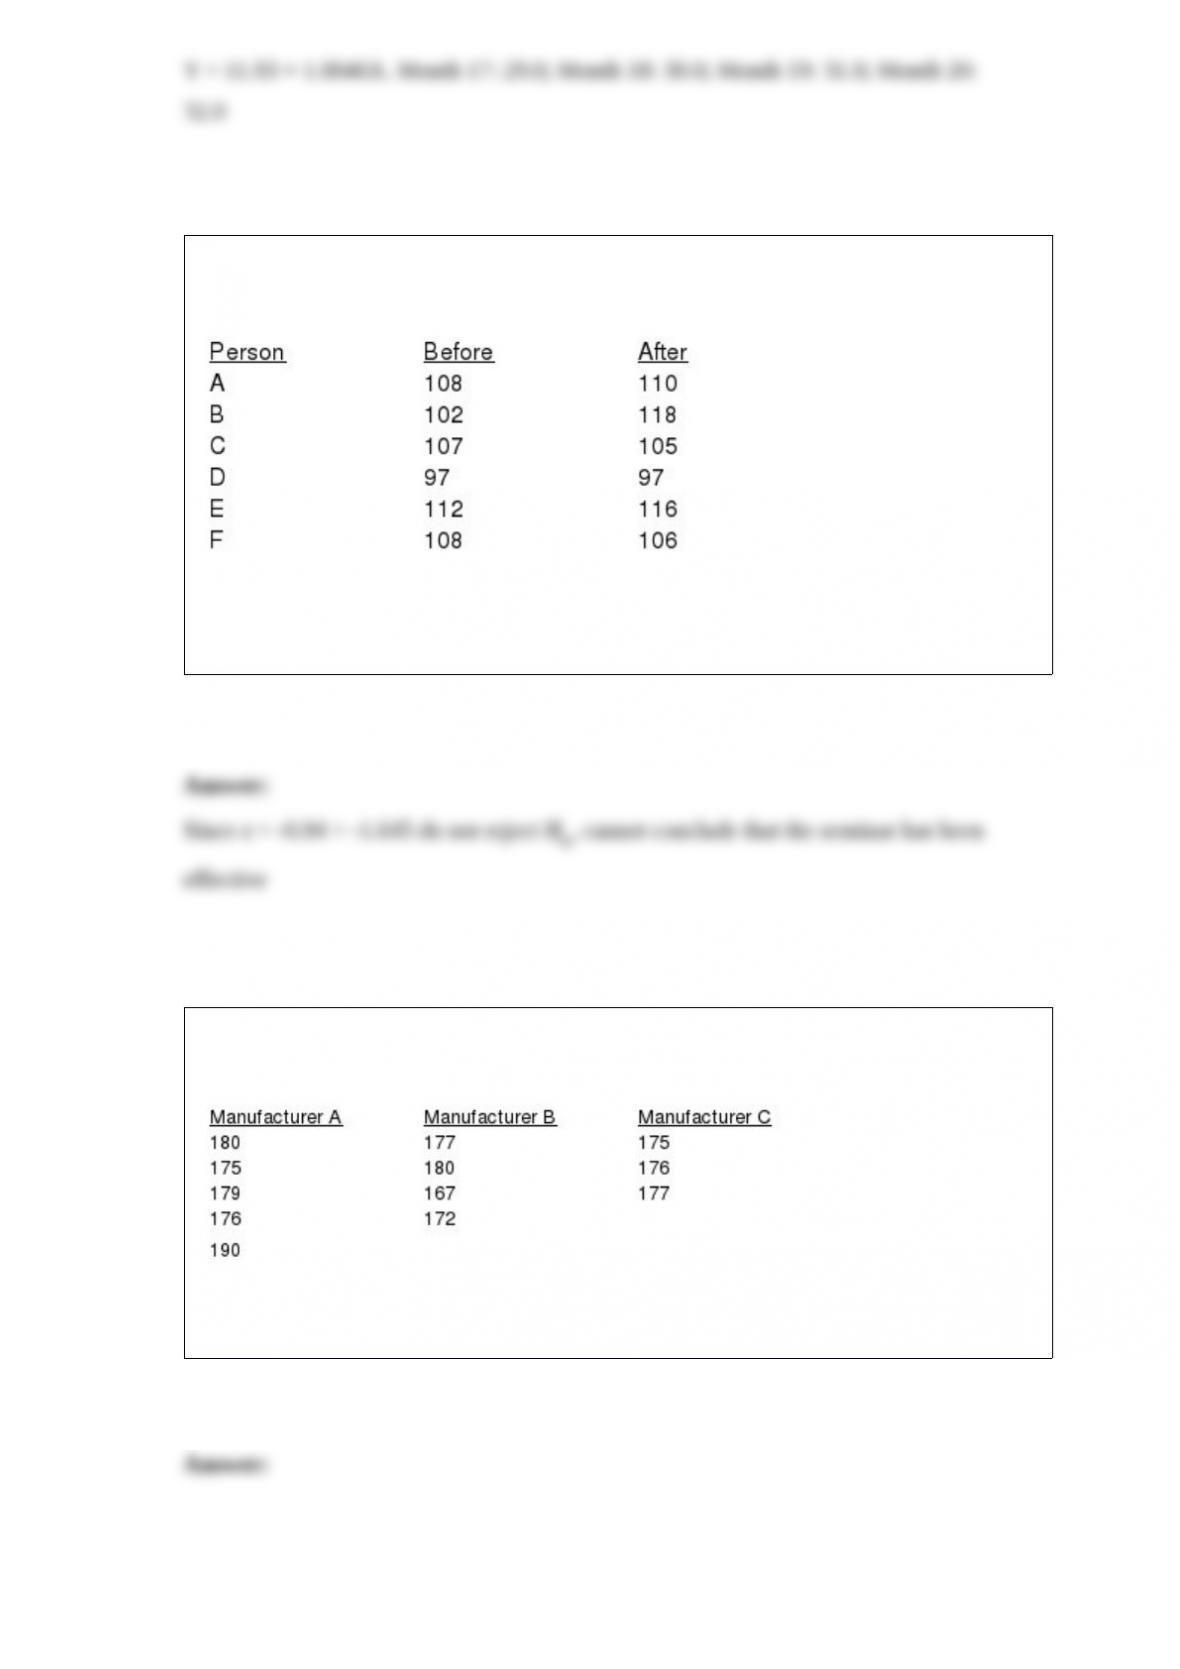
Coyote Cable has been experiencing an increase in cable service subscribers in recent
months due to increased advertising and an influx of new residents to the region. The
number of subscribers (in 1000’s) for the last 16 months are as follows:
Using simple linear regression, forecast the number of subscribers for months 17, 18,
19, and 20.
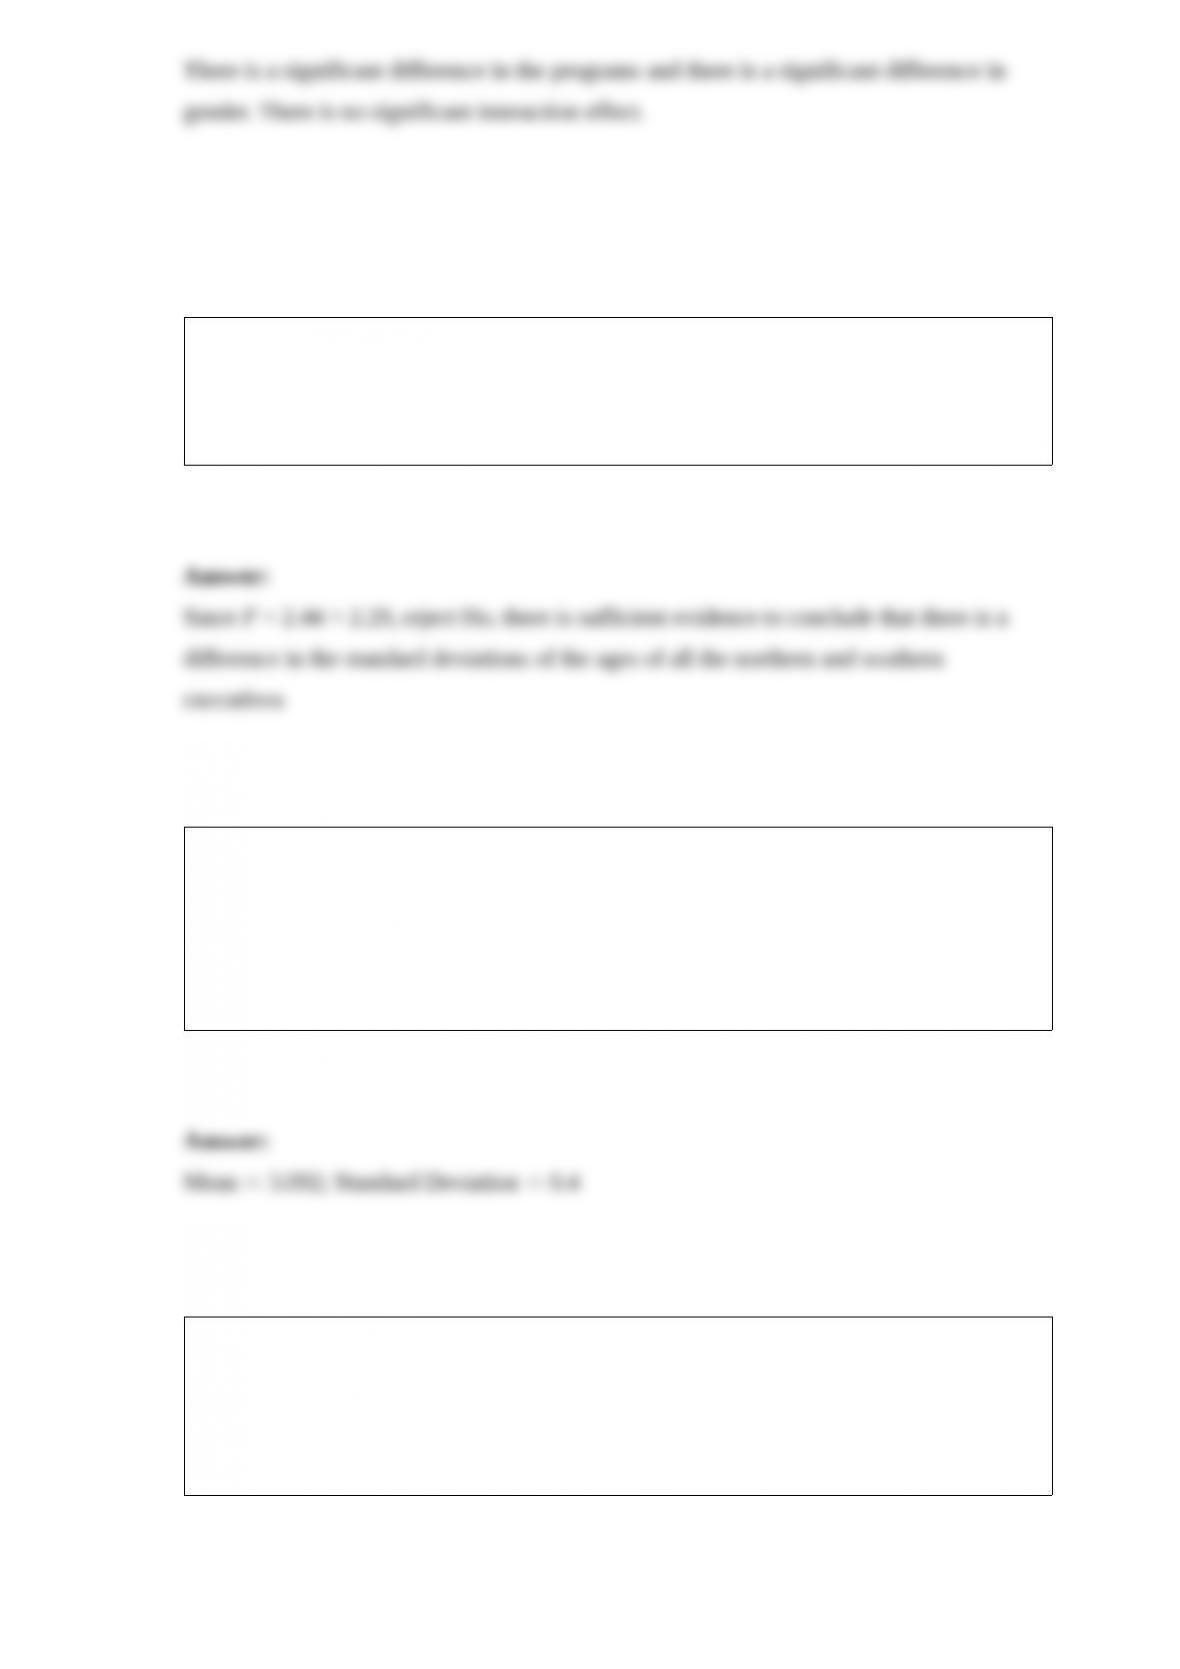
The following data show the test scores of six individuals on a standardized test before
and after attending a preparation seminar for the test.
Use Wilcoxon Signed-Rank test in order to determine whether or not the seminar has
been effective. Hint: This is a one tailed test. Let = 0.05.
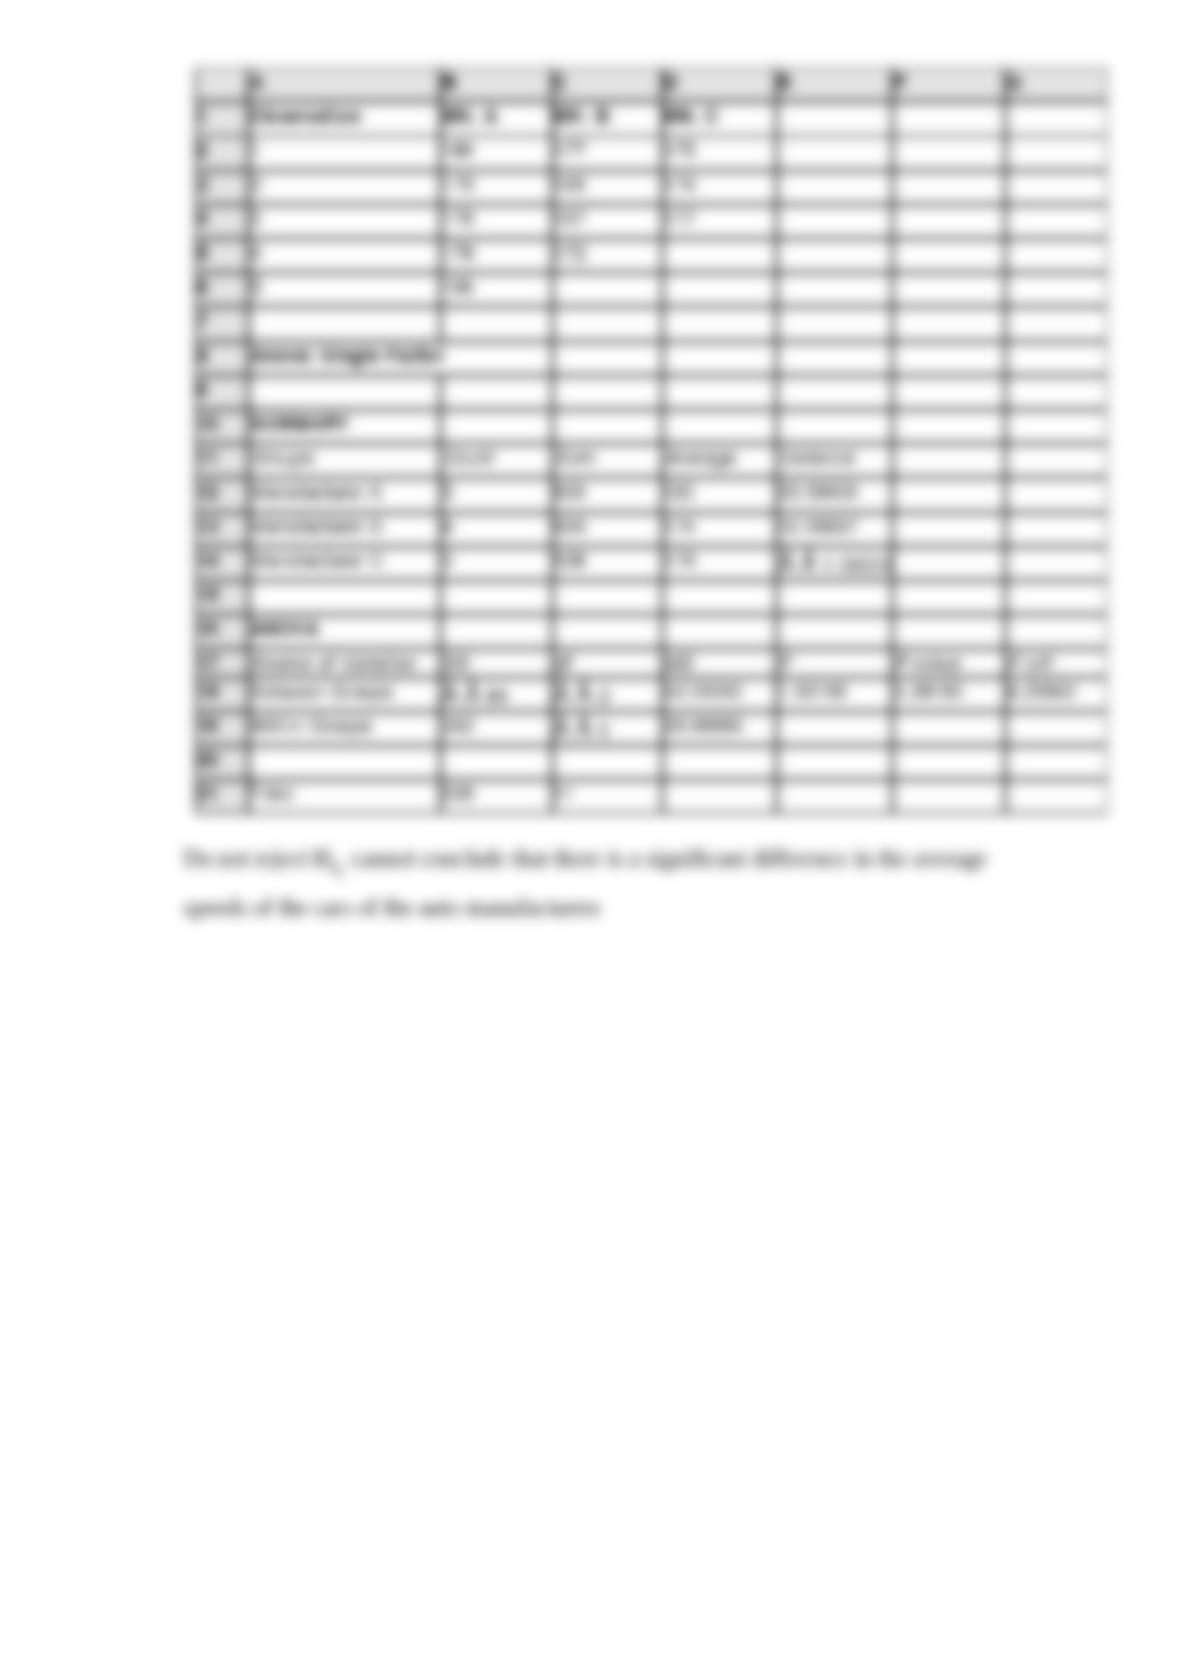
The three major automobile manufacturers have entered their cars in the Indianapolis
500 race. The speeds of the tested cars are given below.
At = .05, use Excel to test to see if there is a significant difference in the average
speeds of the cars of the auto manufacturers.