If the calculated lower-control limit of a p chart is negative,
a. a mistake has been made in the calculations
b. use the absolute value of the lower limit
c. it is set to zero
d. None of the other answers is correct.
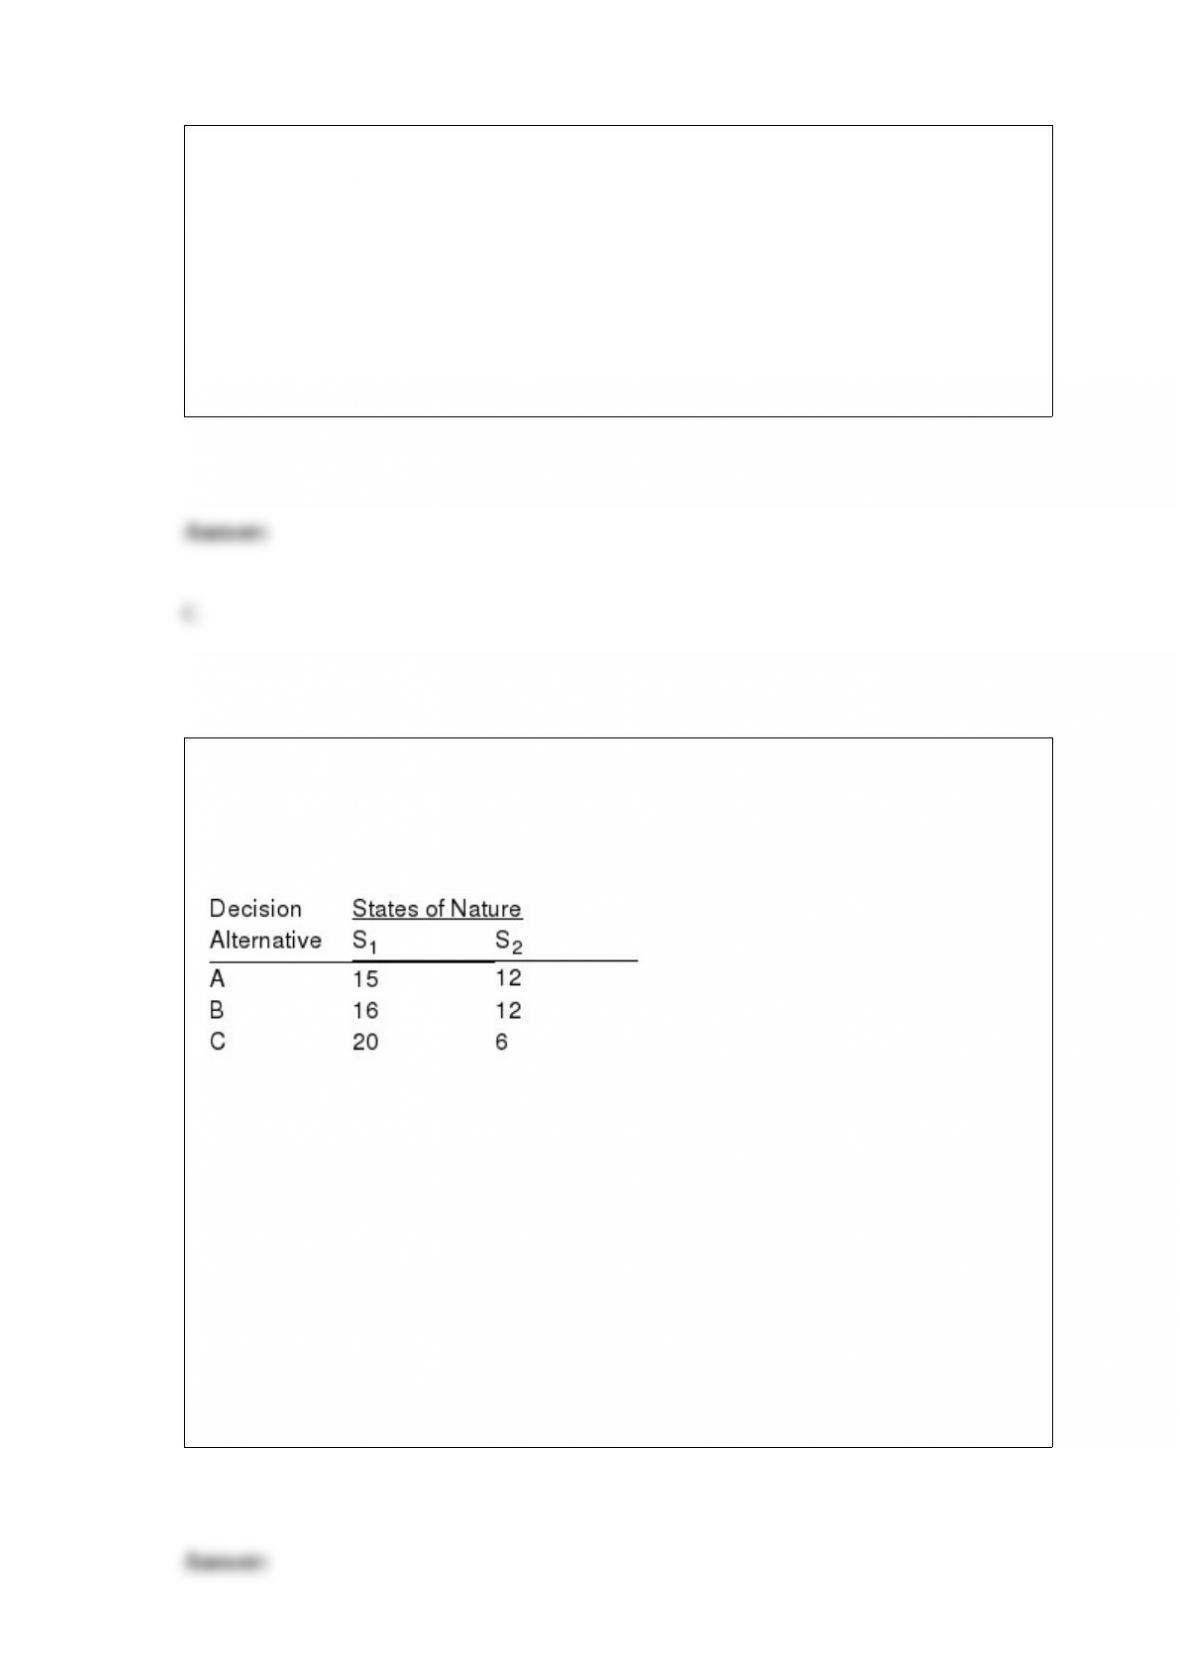
Exhibit 20-4
Below you are given a payoff table involving two states of nature and three decision
alternatives.
The probability of occurrence of S1 = 0.3.
Refer to Exhibit 20-4. The expected value of the best alternative is
a. 10.2
b. 13.2
c. 28.0
d. 51.0
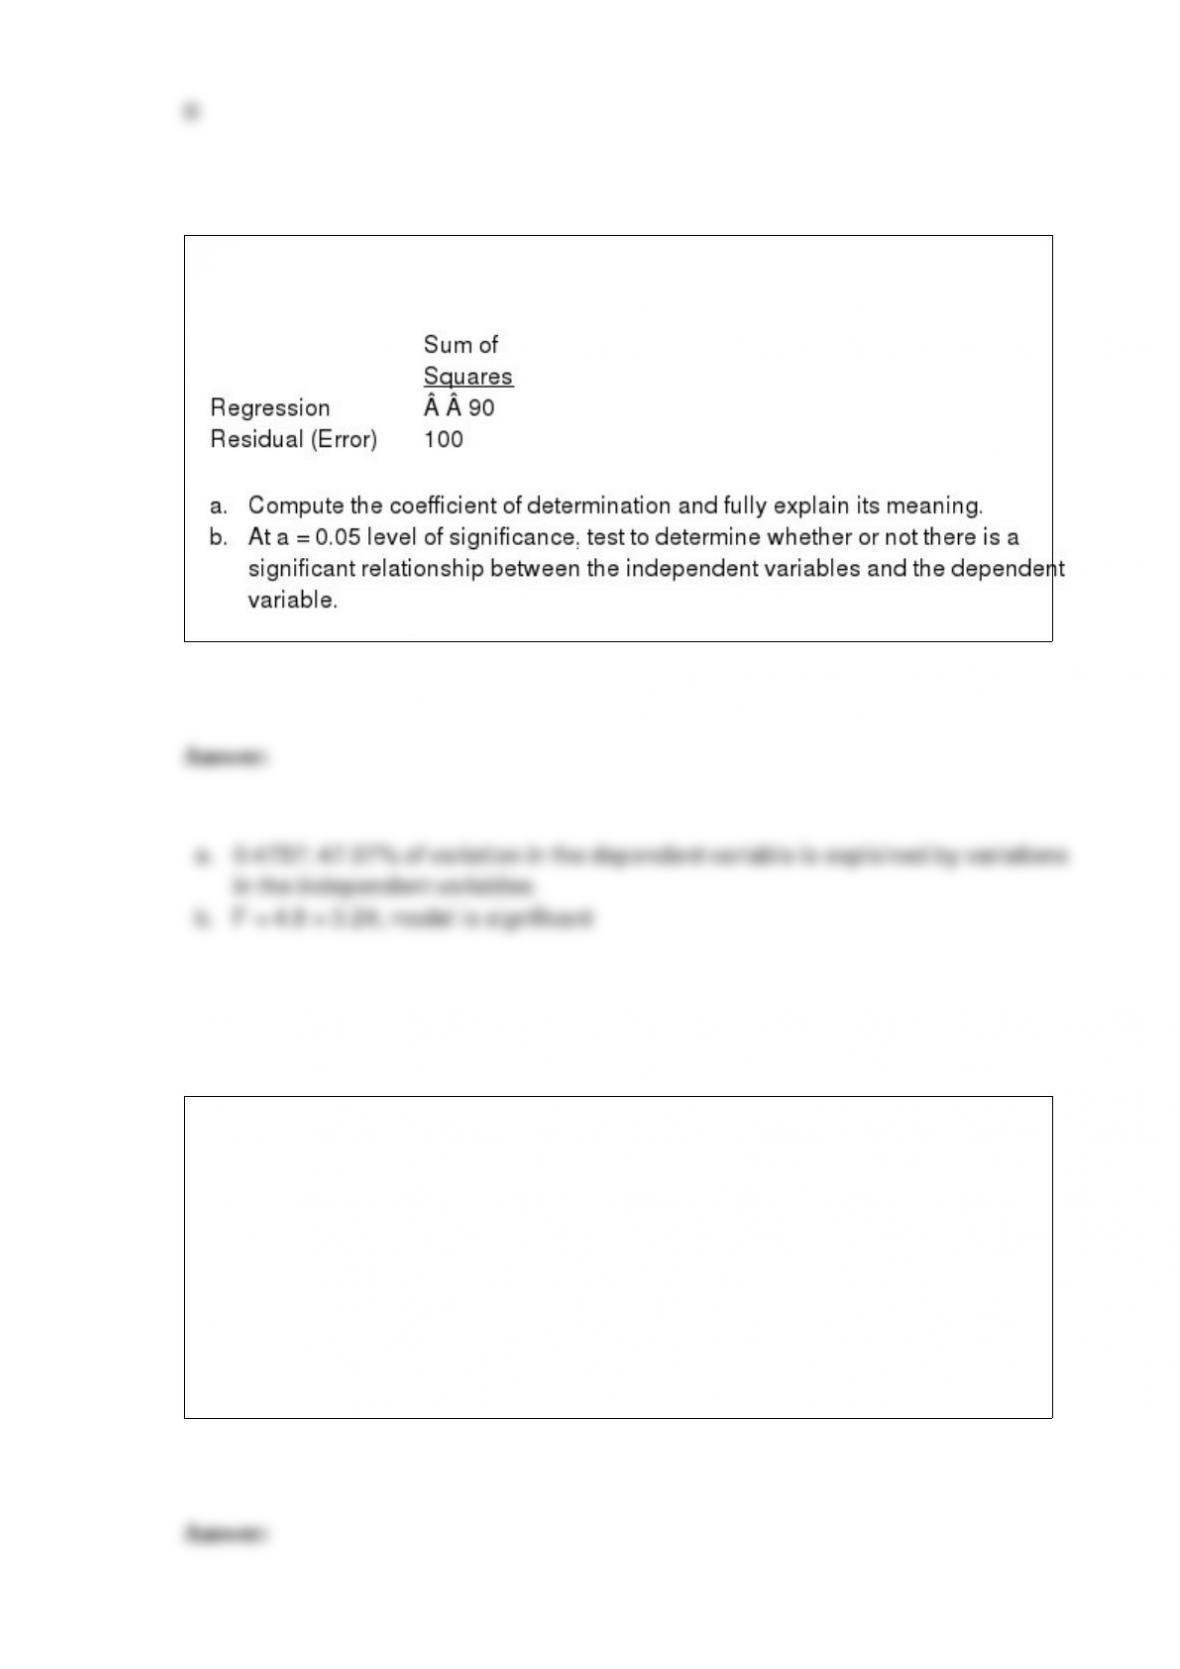
A regression model involving 3 independent variables for a sample of 20 periods
resulted in the following sum of squares.
A nonparametric test for the equivalence of two populations would be used instead of a
parametric test for the equivalence of the population parameters if
a. the samples are very large
b. the samples are not independent
c. no information about the populations is available
d. The parametric test is always used in this situation.
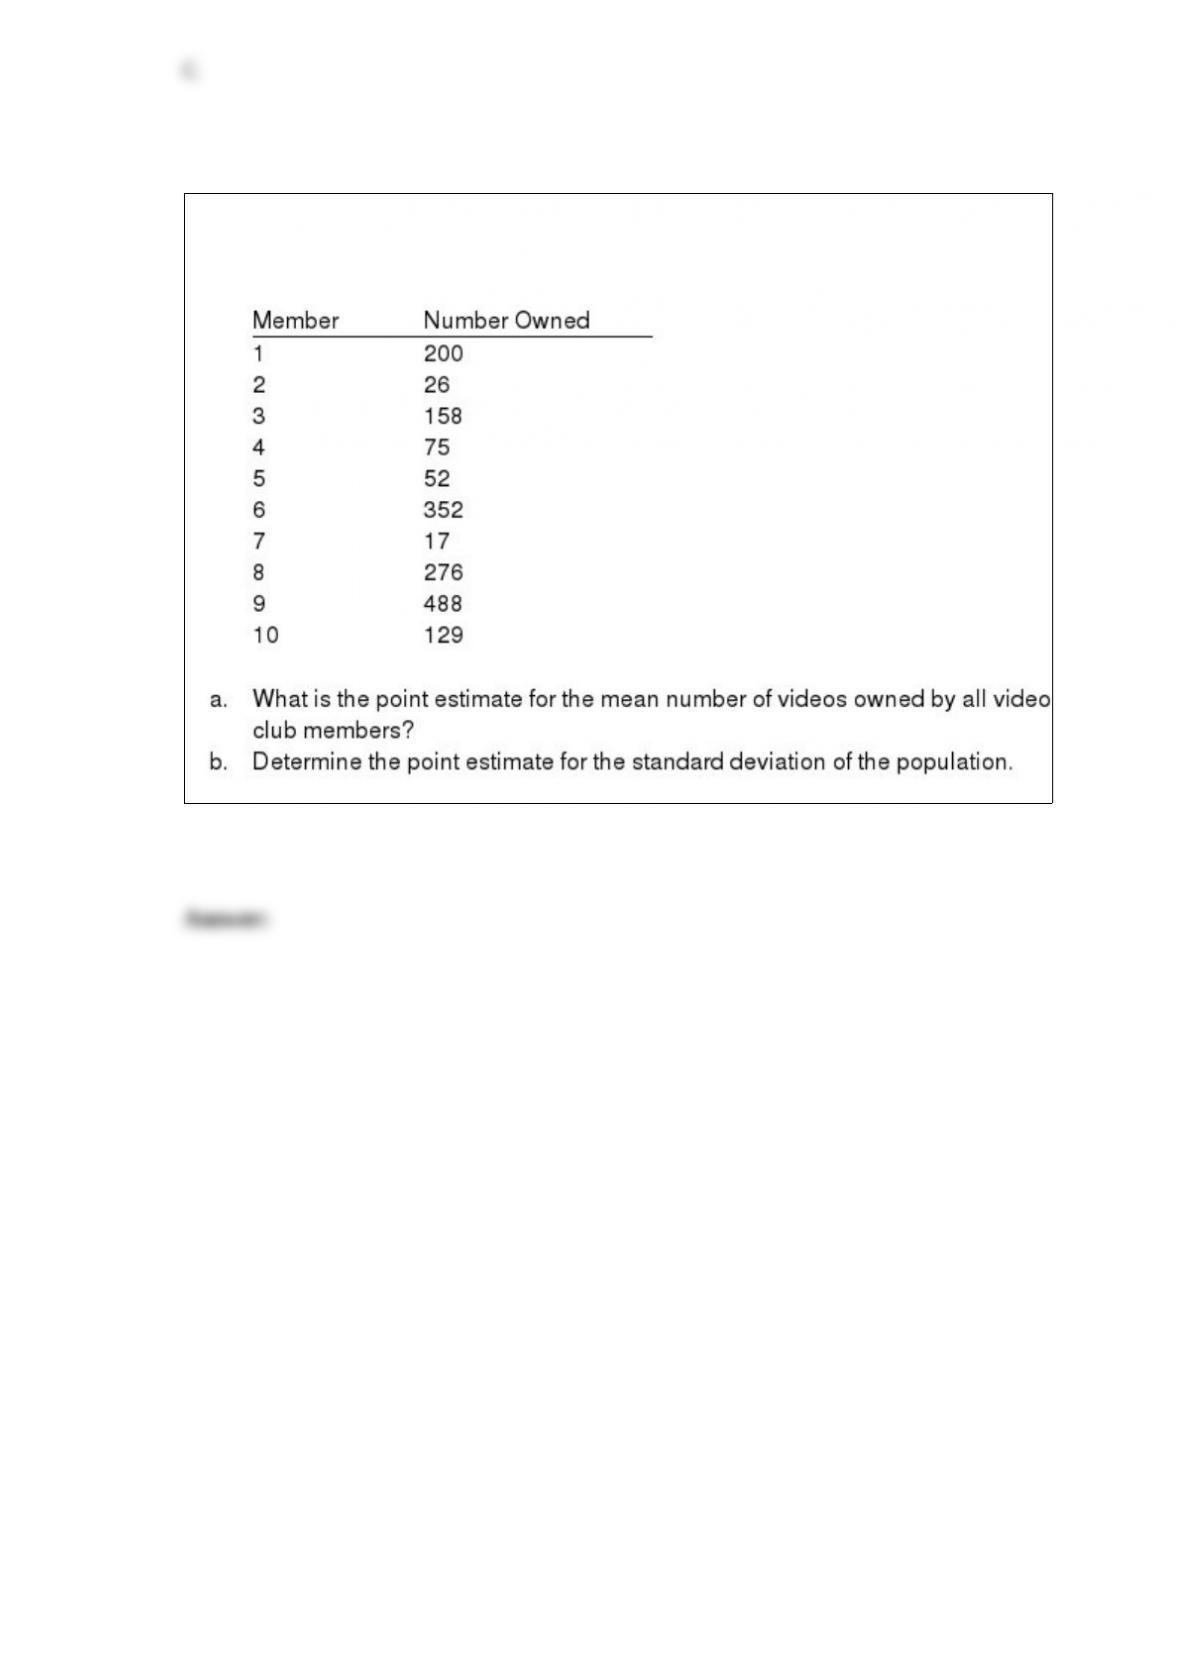
A sample of 10 members of a video club provides the following data on number of
videos they own. Use Excel to answer the questions that follow the data.

Exhibit 9-2
The manager of a grocery store has taken a random sample of 100 customers. The
average length of time it took the customers in the sample to check out was 3.1 minutes.
The population standard deviation is known to be 0.5 minutes. We want to test to
determine whether or not the mean waiting time of all customers is significantly more
than 3 minutes.
Refer to Exhibit 9-2. The test statistic is
a. 1.96
b. 1.64
c. 2.00
d. 0.056

The major applications of data mining have been made by companies with a strong
_______ focus.
a. consumer
b. manufacturing
c. exporting
d. research and development
Positive values of covariance indicate
a. a positive variance of the x values
b. a positive variance of the y values
c. the standard deviation is positive
d. a positive relation between the x and the y variables
Exhibit 20-3
Below you are given a payoff table involving two states of nature and three decision
alternatives.
The probability of the occurrence of state of nature S1 is 0.4.

Refer to Exhibit 20-3. The recommended decision based on the expected value criterion
is
a. A
b. B
c. C
d. All alternatives are the same.
A least squares regression line
a. may be used to predict a value of y if the corresponding x value is given
b. implies a cause-effect relationship between x and y
c. can only be determined if a good linear relationship exists between x and y
d. All of these answers are correct.
The Board of Directors of Bidwell Valve Company has made the following estimates
for the upcoming year’s annual earnings:
P(earnings lower than this year) = .30
P(earnings about the same as this year) = .50
P(earnings higher than this year) = .20

After talking with union leaders, the human resource department has drawn the
following conclusions:
P(Union will request wage increase | lower earnings next year) = .25
P(Union will request wage increase | same earnings next year) = .40
P(Union will request wage increase | higher earnings next year) = .90
a. Calculate the probability that the company earns the same as this year and the union
requests a wage increase.
b. Calculate the probability that the company has higher earnings next year and the
union does not request a wage increase.
c. Calculate the probability that the union requests a wage increase.
The range of the Durbin-Watson statistic is between
a. -1 to 1
b. 0 to 1
c. -infinity to + infinity
d. 0 to 4
Consider the following results for two samples randomly taken from two populations.
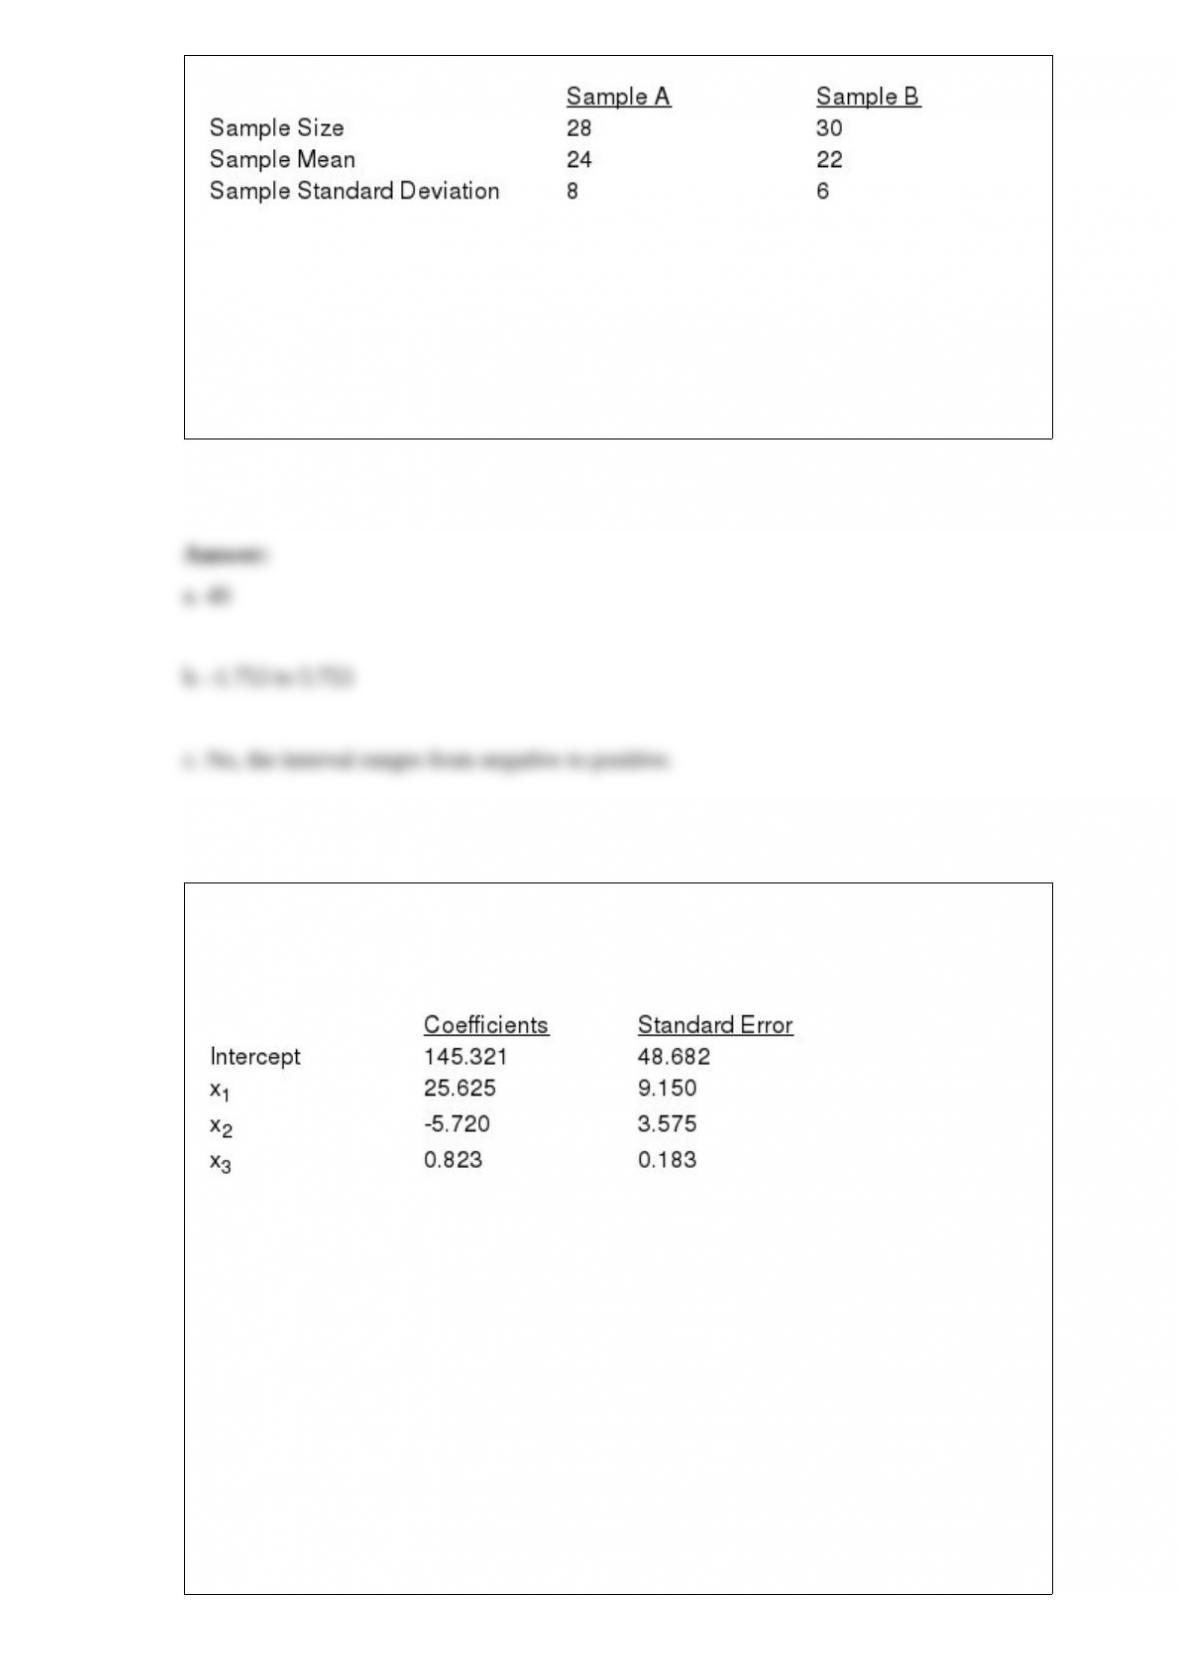
a. Determine the degrees of freedom for the t distribution.
b. Develop a 95% confidence interval for the difference between the two population
means.
c. Is there conclusive evidence that one population has a larger mean? Explain.
Exhibit 15-5
Below you are given a partial Excel output based on a sample of 25 observations.
Refer to Exhibit 15-5. The interpretation of the coefficient on x1 is that
a. a one unit change in x1 will lead to a 25.625 unit change in y
b. a one unit change in x1 will lead to a 25.625 unit increase in y when all other
variables are held constant
c. a one unit change in x1 will lead to a 25.625 unit increase in x2 when all other
variables are held constant
d. It is impossible to interpret the coefficient.

A random variable that can assume only a finite number of values is referred to as a(n)
a. infinite sequence
b. finite sequence
c. discrete random variable
d. discrete probability function