Within Treatments (Error)
40.00
12
3.33
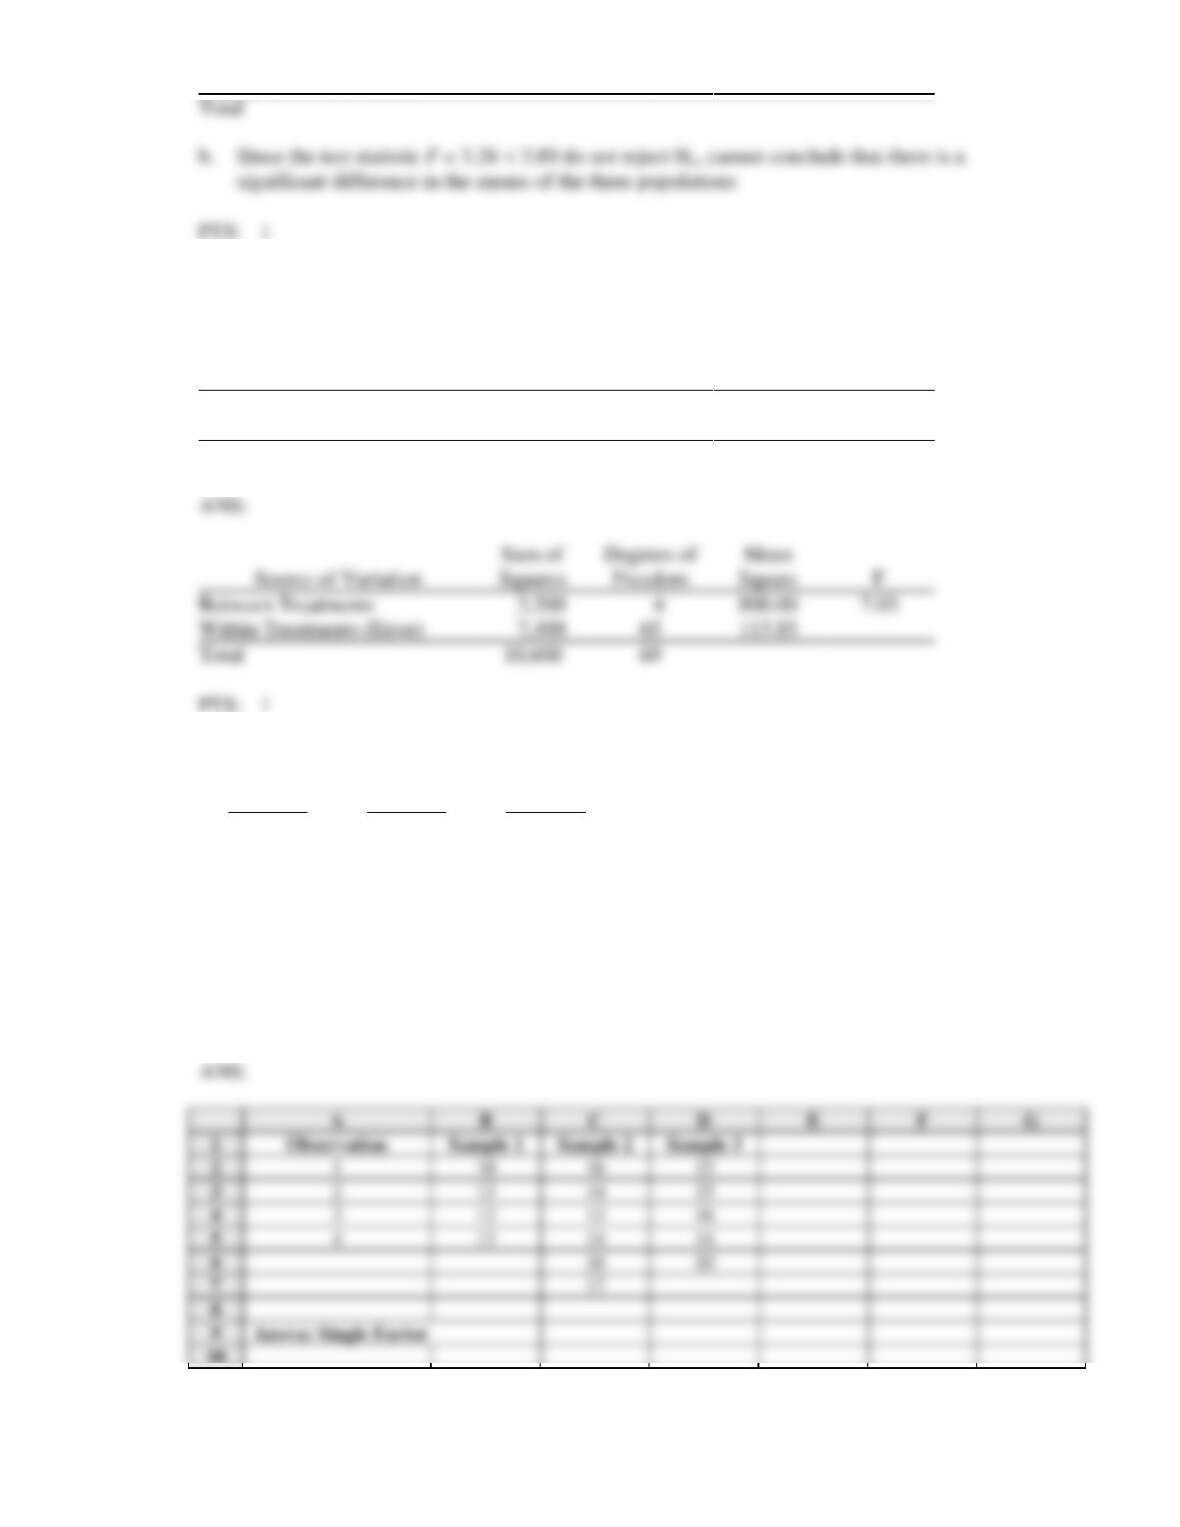
44. In a completely randomized experimental design, 14 experimental units were used for each of the 5
levels of the factor (i.e., 5 treatments). Fill in the blanks in the following ANOVA table.
Source of Variation
Sum of
Squares
Degrees of
Freedom
Mean
Square
F
Between Treatments
_____?
_____?
800
_____?
Within Treatments (Error)
_____?
_____?
_____?
Total
10,600
_____?
Sum of
Degrees of
Mean
Between Treatments
800.00
Within Treatments (Error)
65
113.85
Total
10,600
69
45. Samples were selected from three populations. The data obtained are shown below.
Sample 1
Sample 2
Sample 3
10
16
15
13
14
15
12
13
16
13
14
14
16
10
17
At a 5% level of significance, use Excel to test to determine whether there is a significant difference in
the means of the three populations.
Total
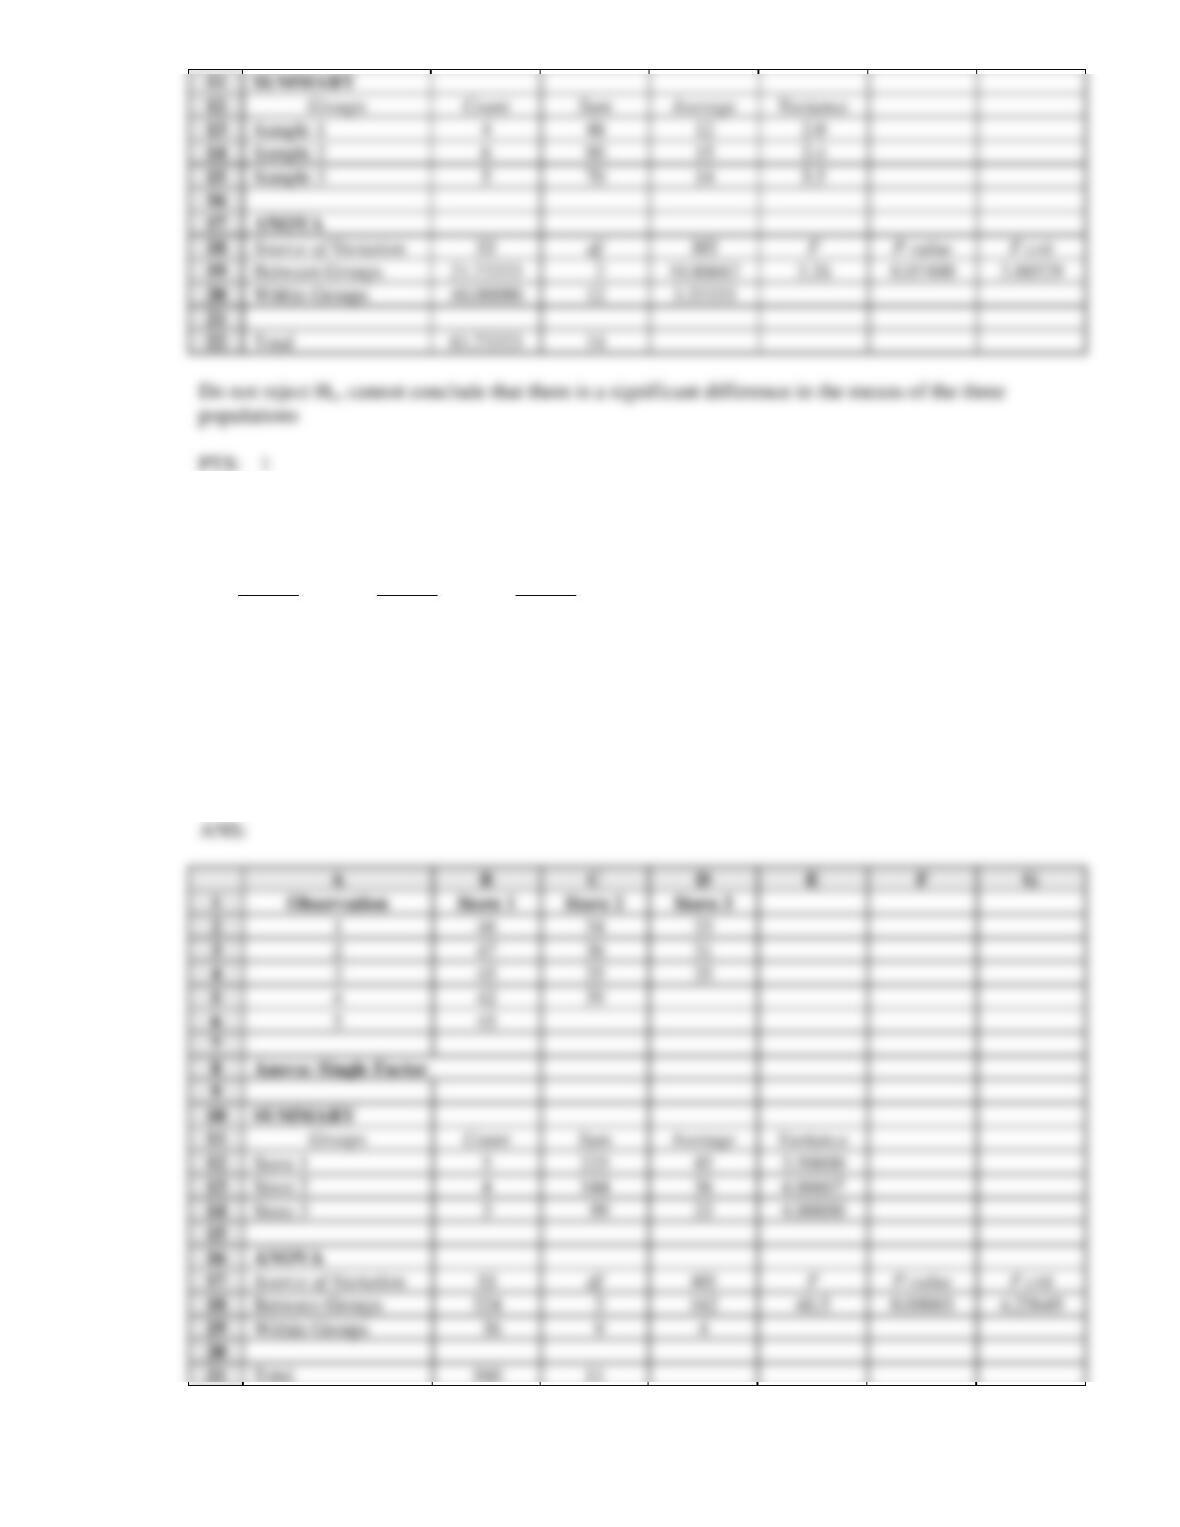
46. Halls, Inc. has three stores located in three different areas. Random samples of the sales of the three
stores (In $1,000) are shown below.
Store 1
Store 2
Store 3
46
34
33
47
36
31
45
35
35
42
39
45
At a 5% level of significance, use Excel to test to see if there is a significant difference in the average
sales of the three stores.
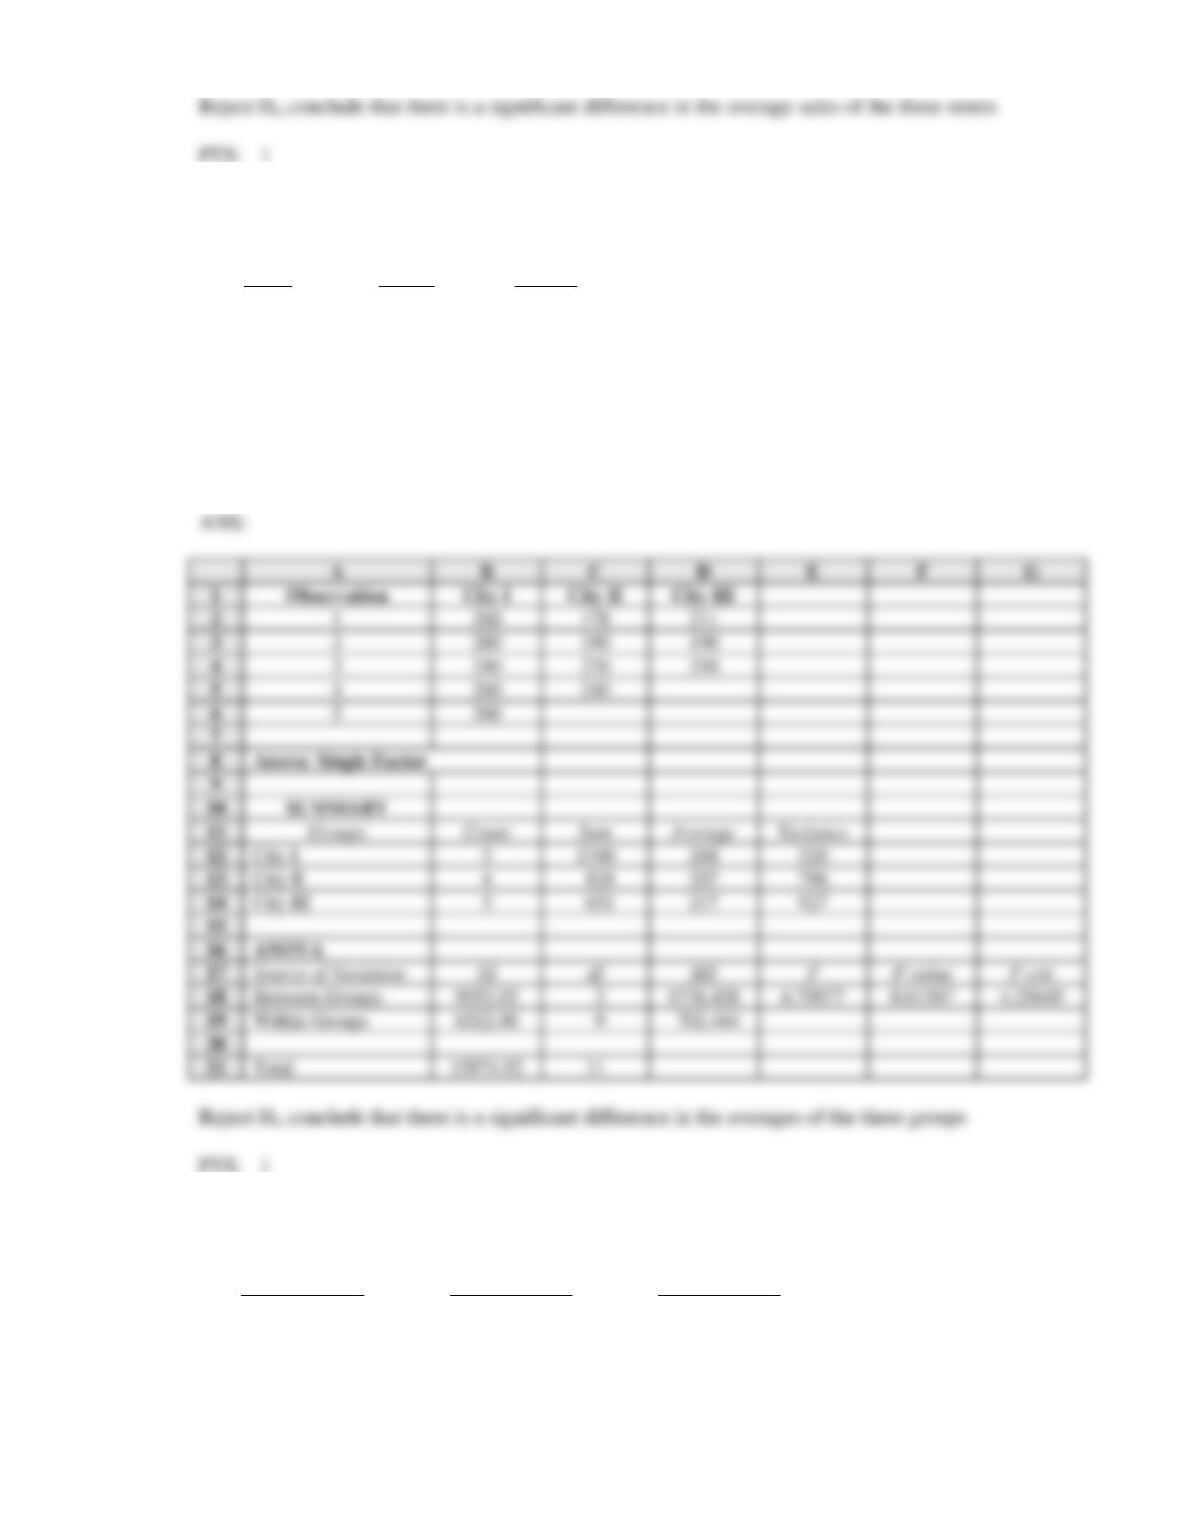
47. Random samples of individuals from three different cities were asked how much time they spend per
day watching television. The results (in minutes) for the three groups are shown below.
City I
City II
City III
260
178
211
280
190
190
240
220
250
260
240
300
At = 0.05, use Excel to test to see if there is a significant difference in the averages of the three
groups.
2
9
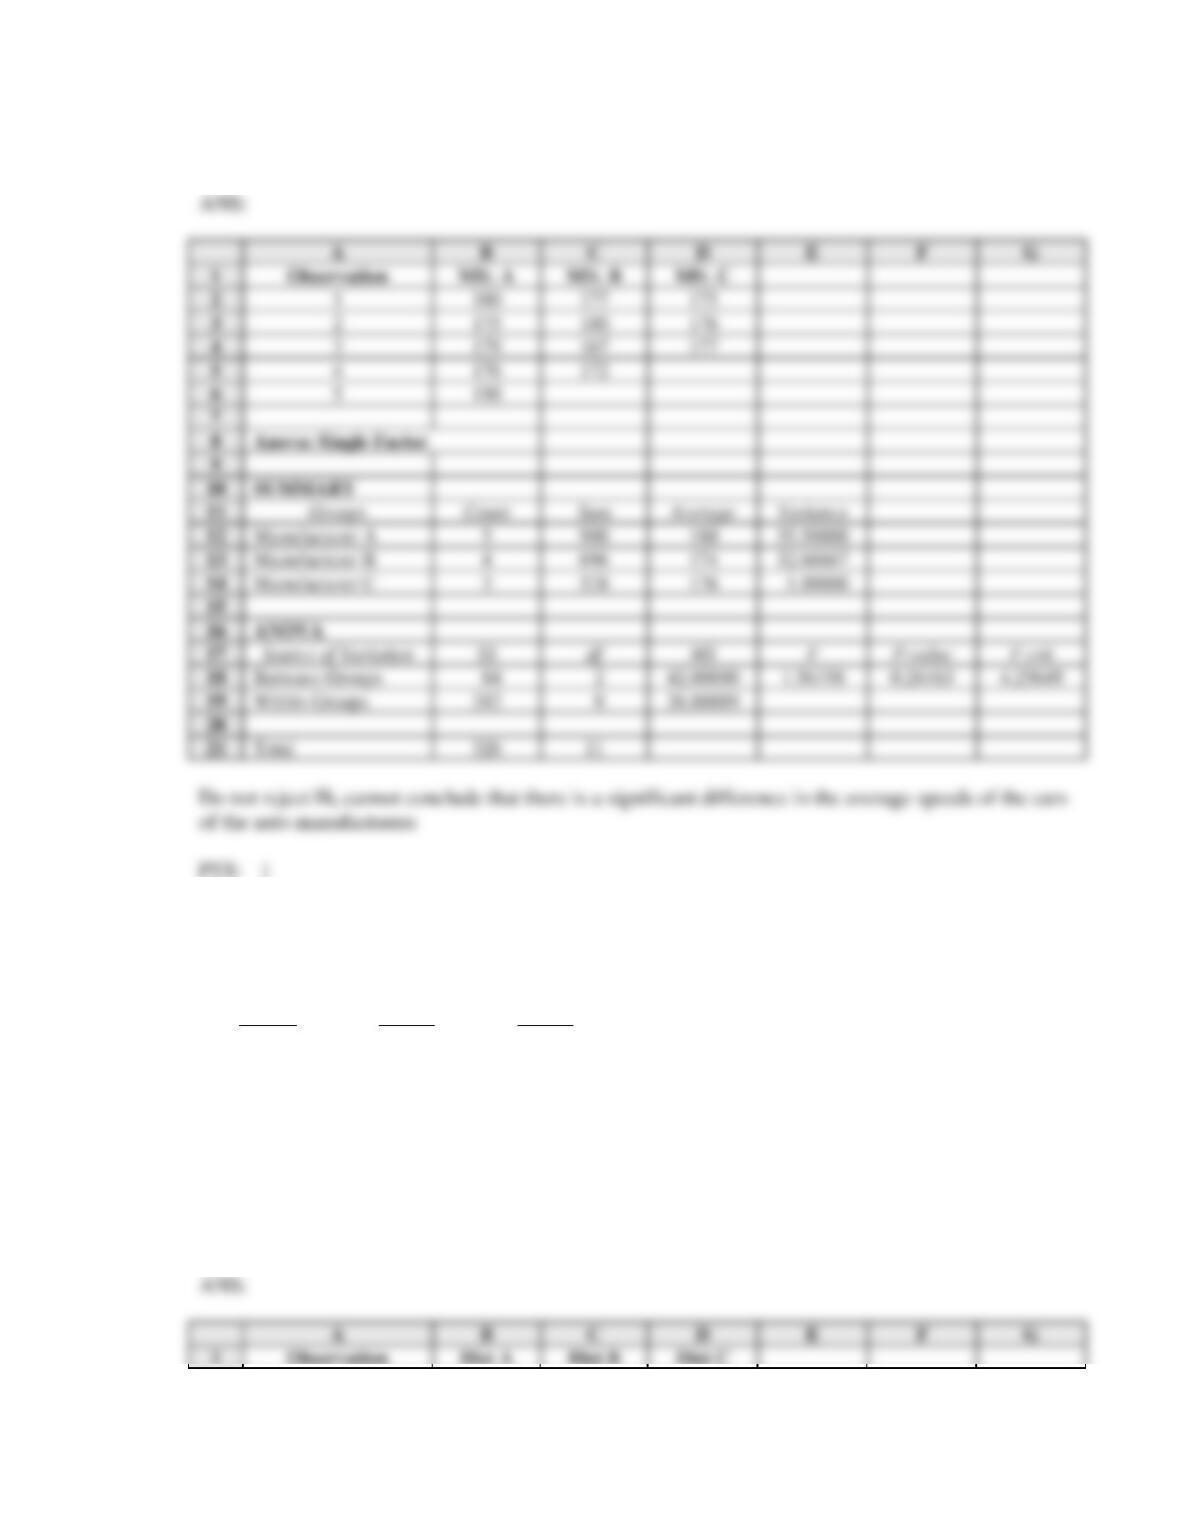
48. The three major automobile manufacturers have entered their cars in the Indianapolis 500 race. The
speeds of the tested cars are given below.
Manufacturer A
Manufacturer B
Manufacturer C
180
177
175
175
180
176
179
167
177
176
172
190
At = .05, use Excel to test to see if there is a significant difference in the average speeds of the cars
of the auto manufacturers.
49. A dietician wants to see if there is any difference in the effectiveness of three diets. Eighteen people,
comprising a sample, were randomly assigned to the three diets. Below you are given the total amount
of weight lost in a month by each person.
Diet A
Diet B
Diet C
14
12
25
18
10
32
20
22
18
12
12
14
20
16
17
18
12
14
What would you advise the dietician about the effectiveness of the three diets? Use Excel and a .05
level of significance.
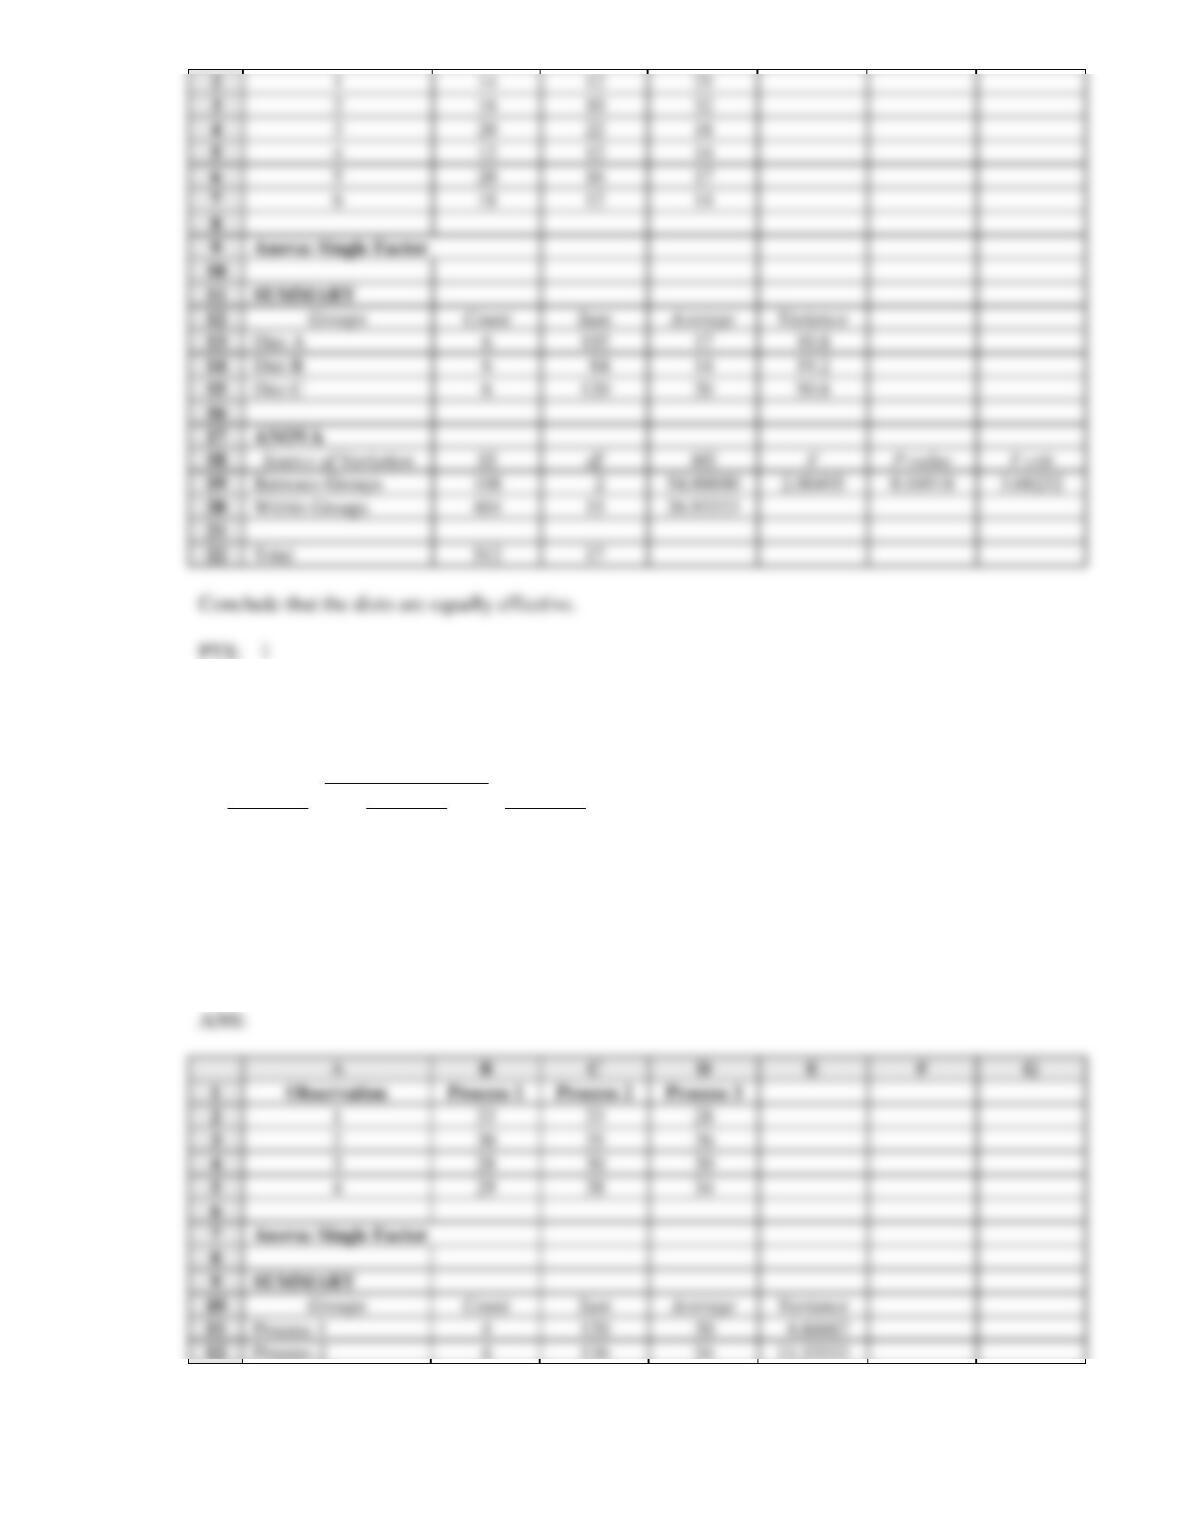
50. Individuals were randomly assigned to three different production processes. The hourly units of
production for the three processes are shown below.
Production Process
Process 1
Process 2
Process 3
33
33
28
30
35
36
28
30
30
29
38
34
Use Excel with = 0.05 to determine if there is a significant difference in the mean hourly units of
production for the three types of production processes.
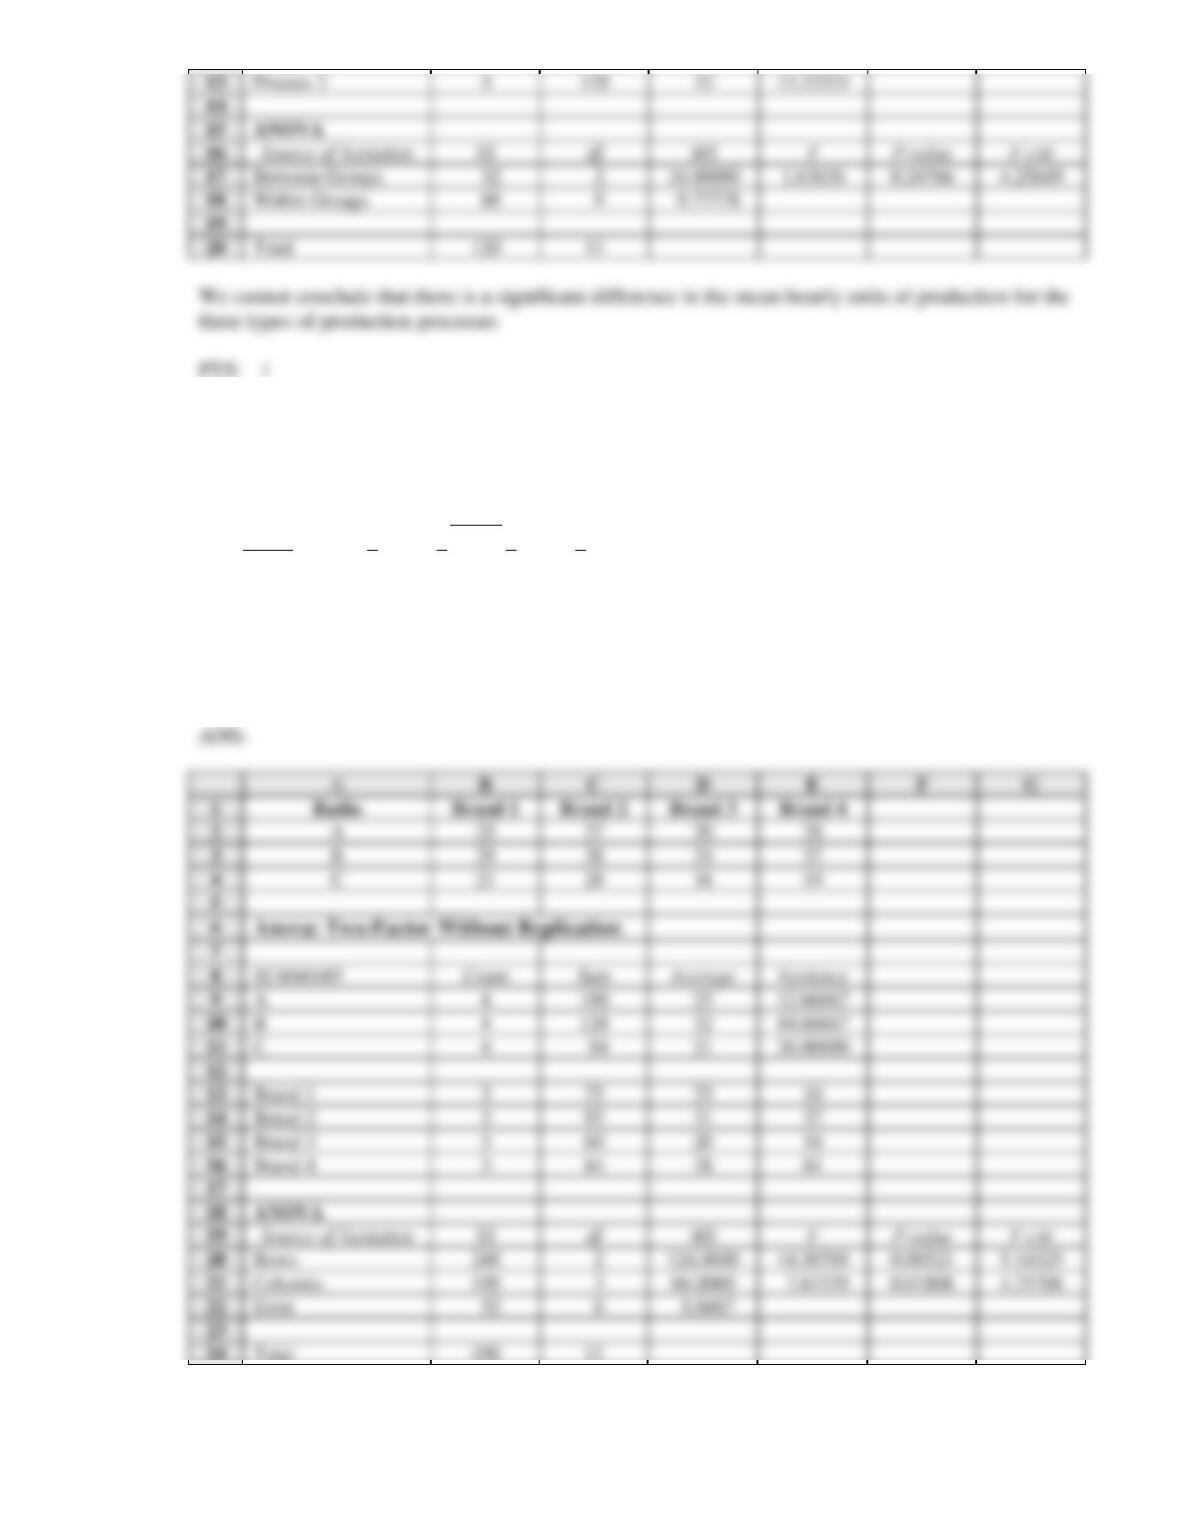
51. A research organization wishes to determine whether four brands of batteries for transistor radios
perform equally well. Three batteries of each type were randomly selected and installed in the three
test radios. The number of hours of use for each battery is given below.
Brand
Radio
1
2
3
4
A
25
27
20
28
B
29
38
24
37
C
21
28
16
19
Consider the three different test radios and use Excel to carry out the analysis of variance procedure
for a randomized block design. Use a .05 level of significance.
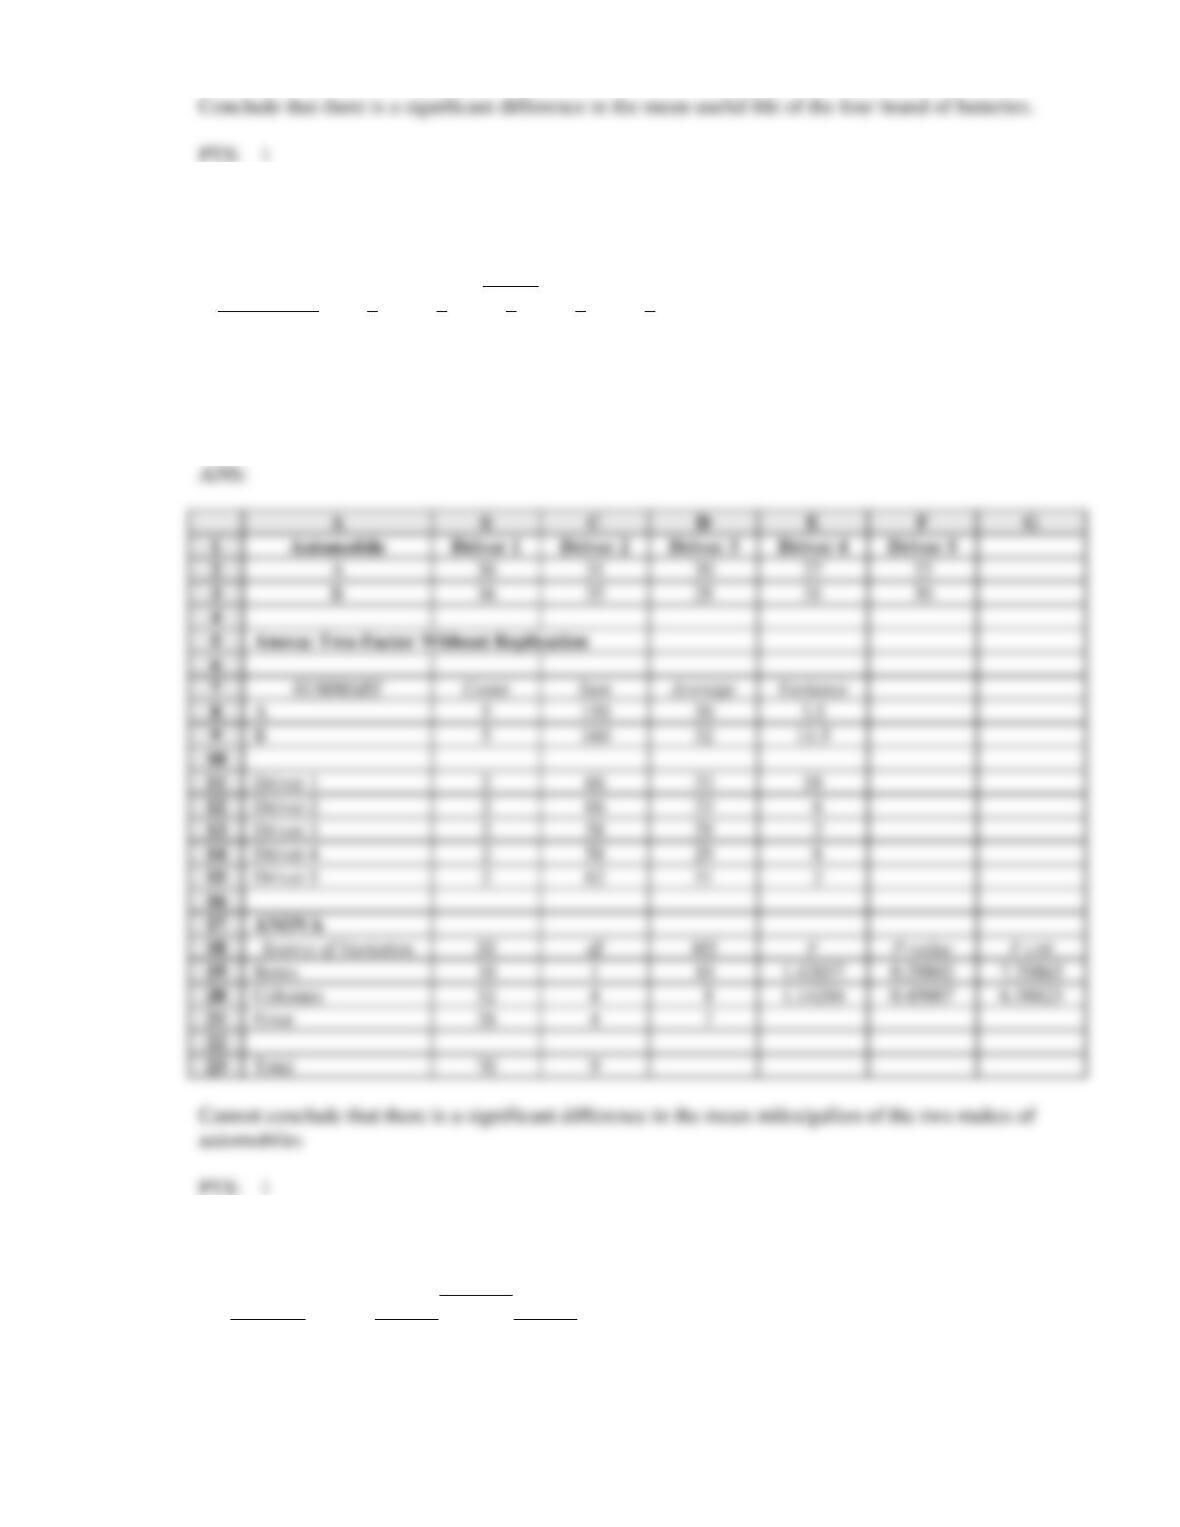
52. Five drivers were selected to test drive 2 makes of automobiles. The following table shows the number
of miles per gallon for each driver driving each car.
Driver
Automobile
1
2
3
4
5
A
30
31
30
27
32
B
36
35
28
31
30
Consider the makes of automobiles as treatments and the drivers as blocks, use Excel to test to see if
there is any difference in the miles/gallon of the two makes of automobiles. Let = .05.
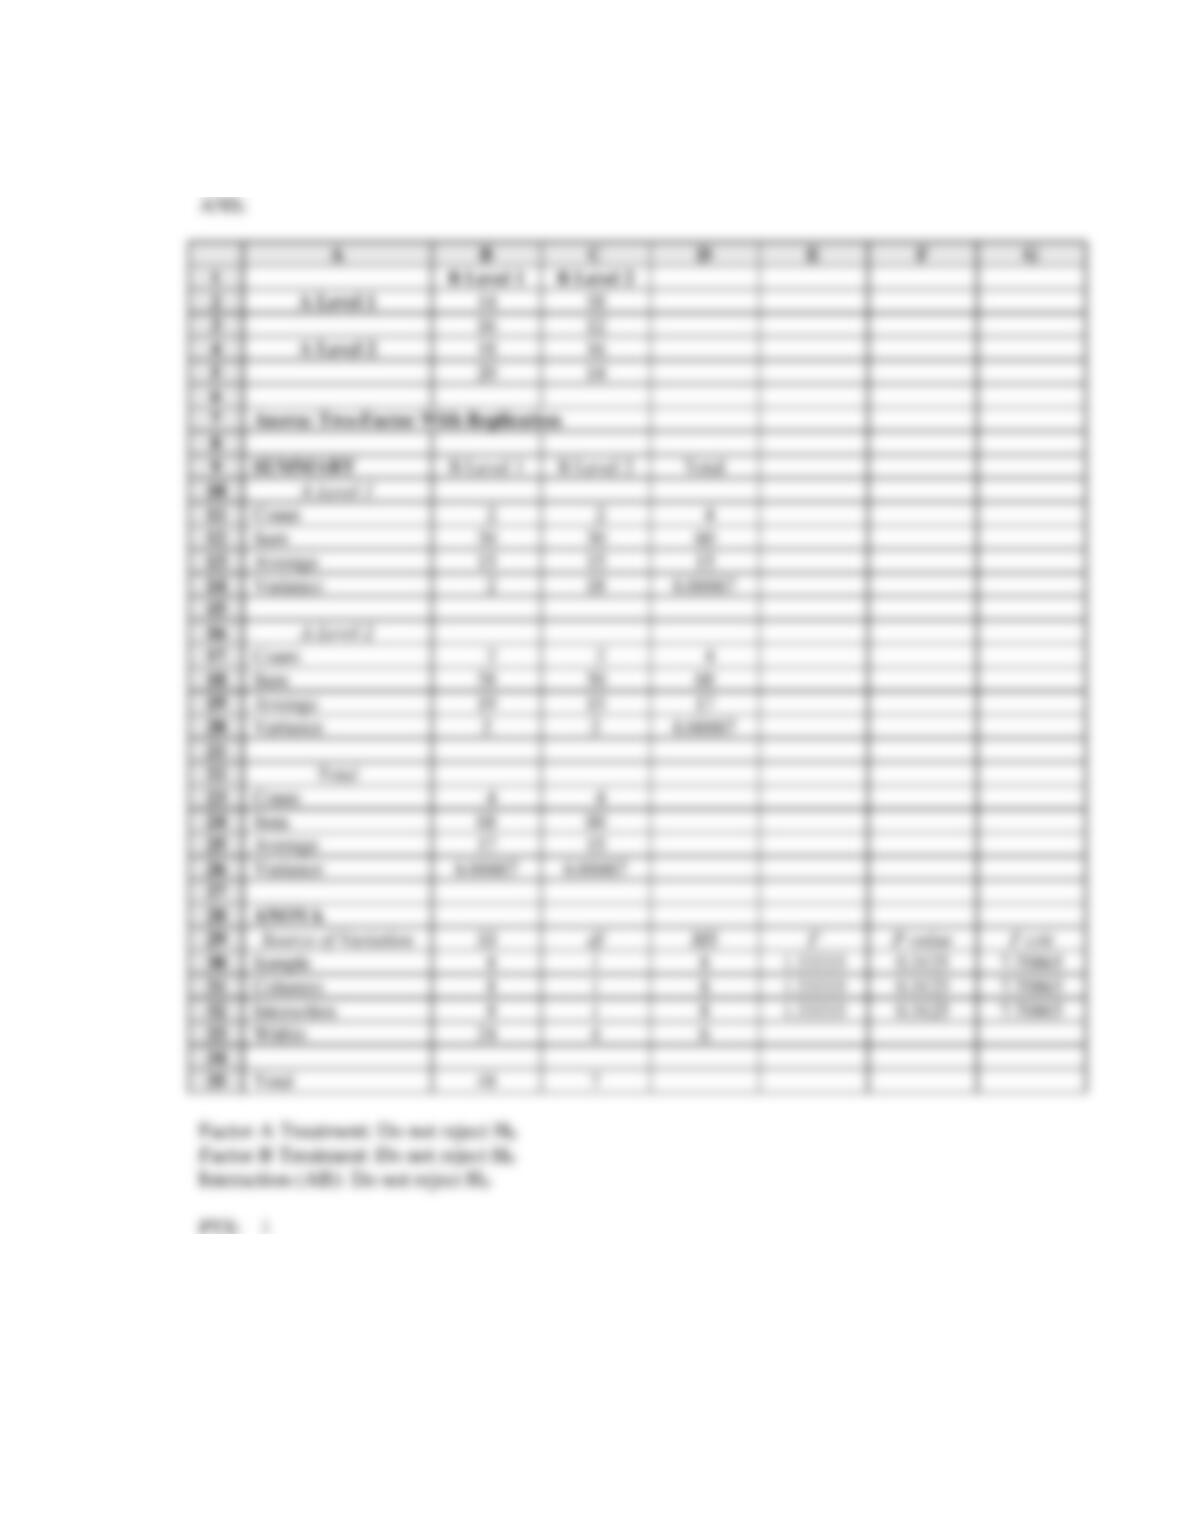
53. A factorial experiment involving 2 levels of factor A and 2 levels of factor B resulted in the following.
Factor B
Factor A
Level 1
Level 2
Level 1
14
18
16
12
Level 2
18
16
20
14
Use Excel and test for any significant main effect and any interaction effect. Use = .05.
54. Employees of MNM Corporation are about to undergo a retraining program. Management is trying to
determine which of three programs is the best. They believe that the effectiveness of the programs may
be influenced by gender. A factorial experiment was designed. You are given the following
information.
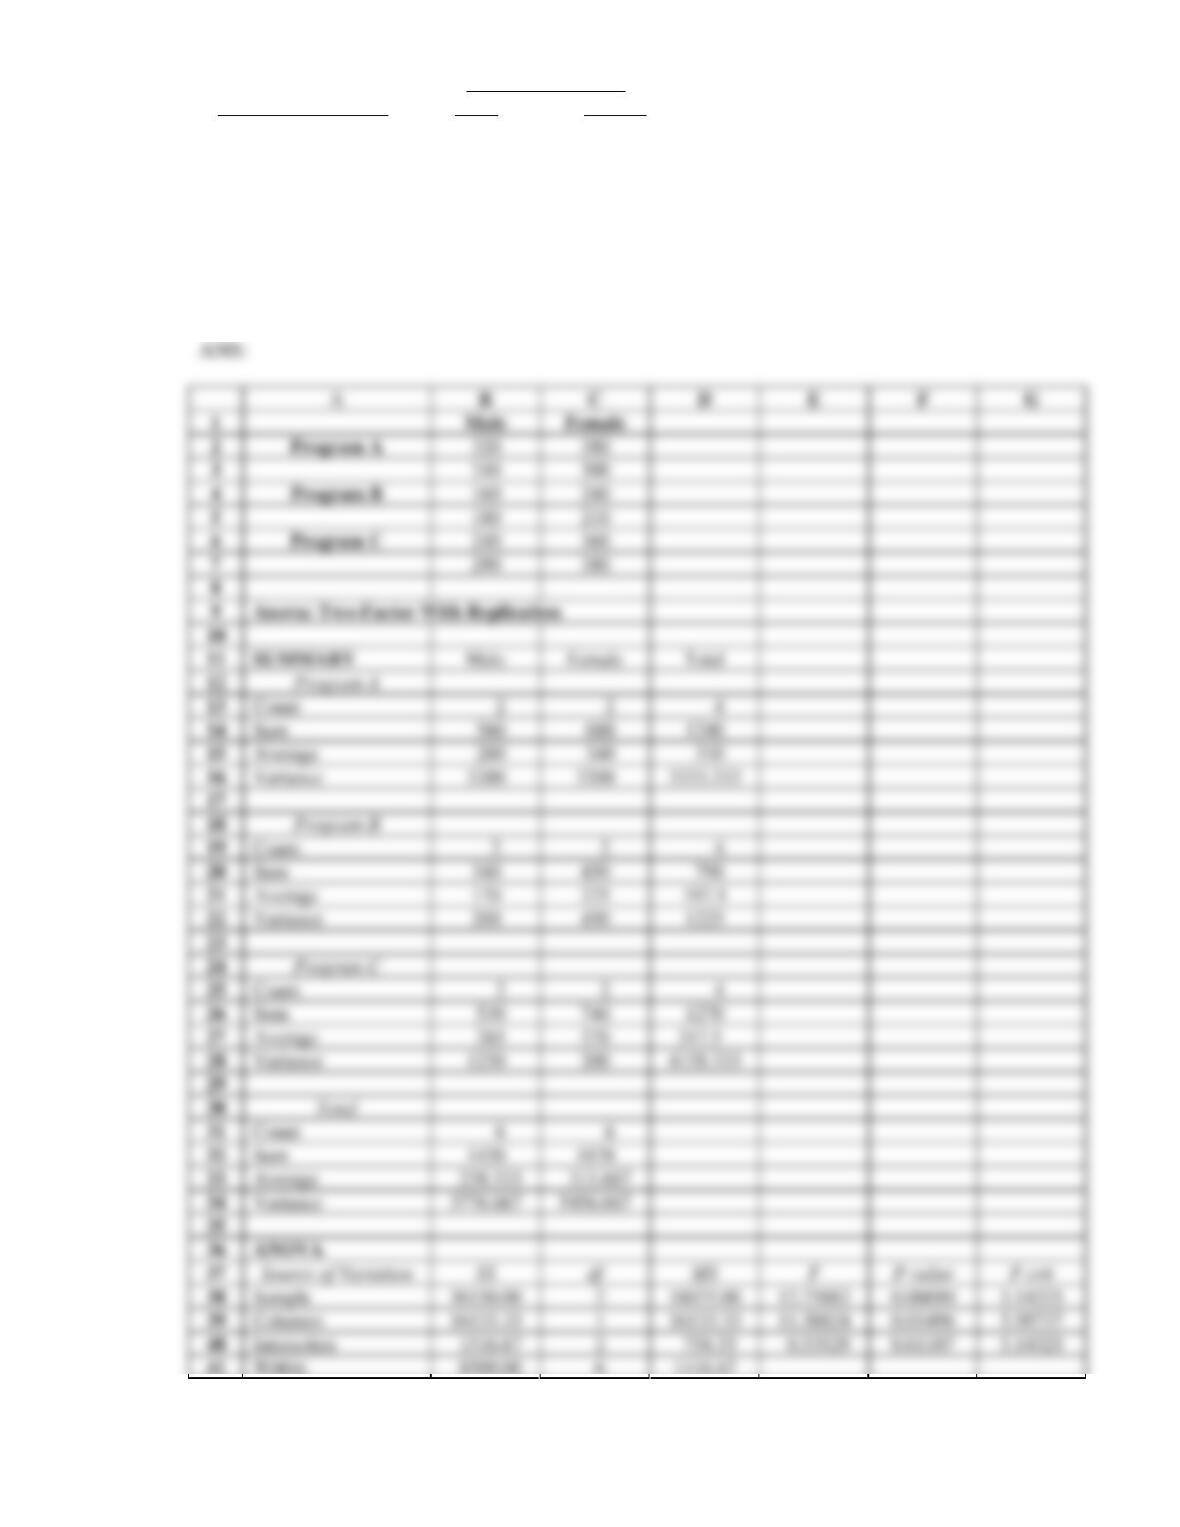
Factor B: Gender
Factor A: Program
Male
Female
Program A
320
380
240
300
Program B
160
240
180
210
Program C
240
360
290
380
What advice would you give MNM? Use Excel and a .05 level of significance.
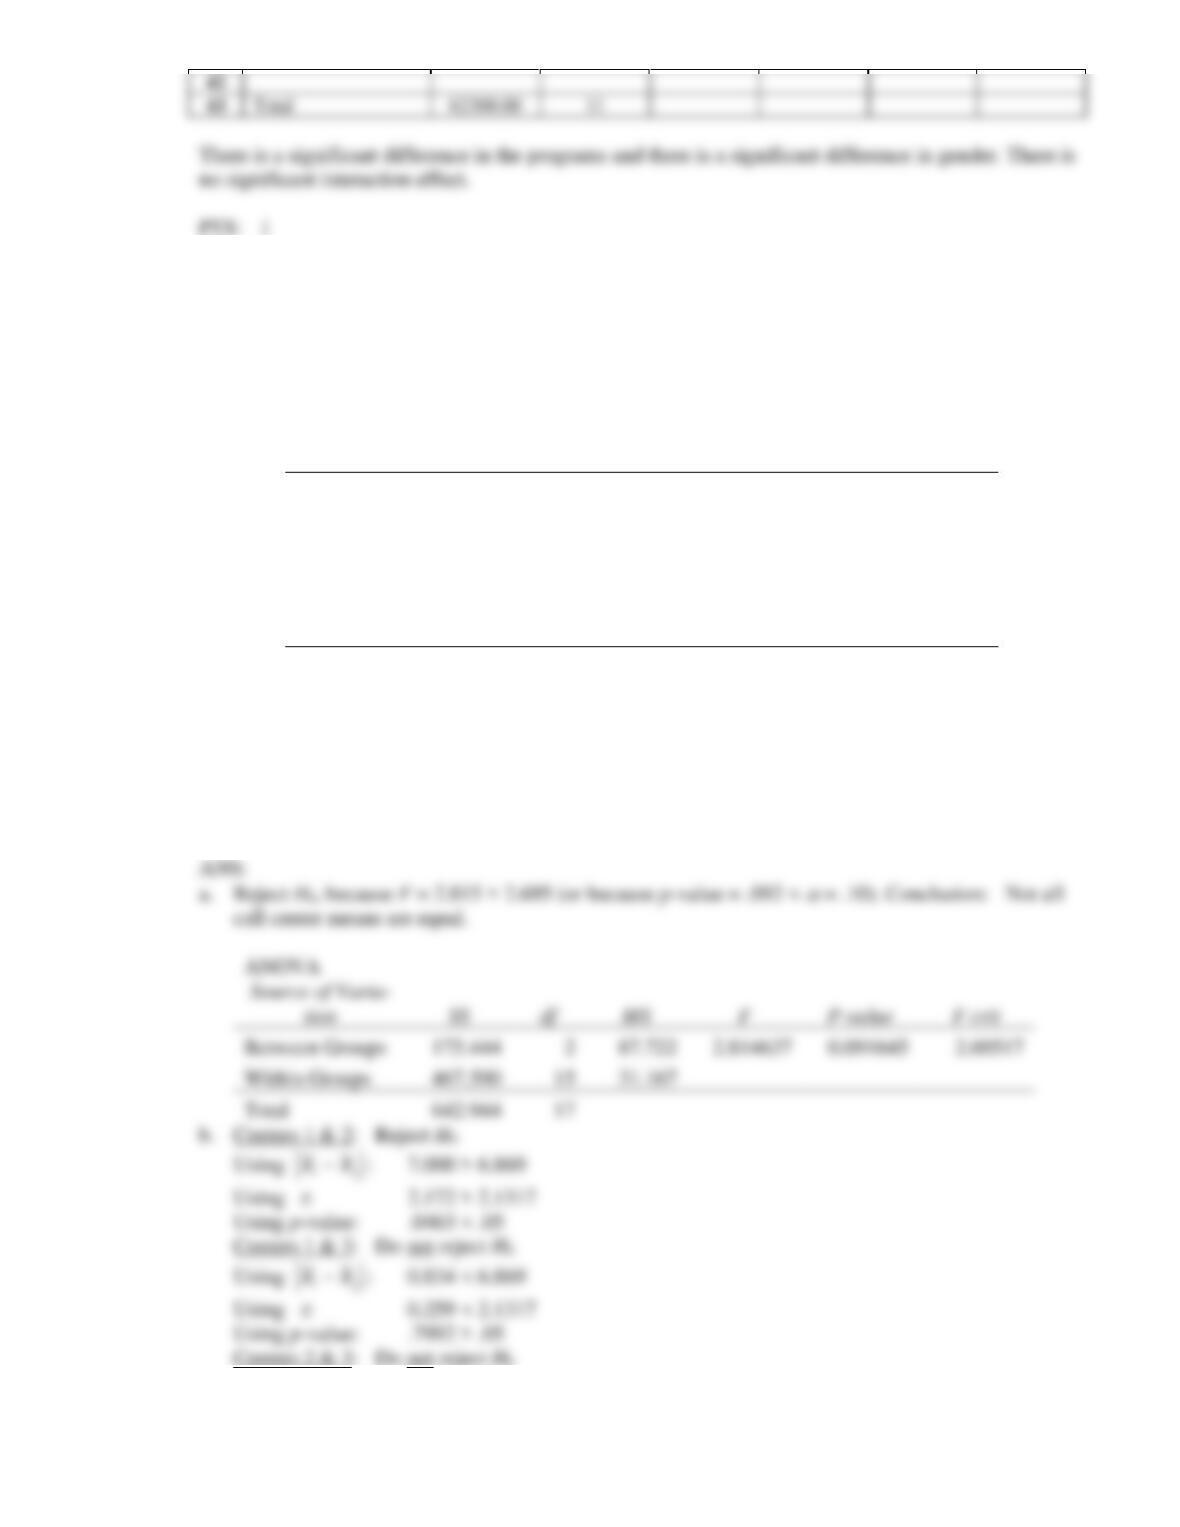
55. Regional Manager Sue Collins would like to know if the mean number of telephone calls made per
8-hour shift is the same for the telemarketers at her three call centers (Austin, Las Vegas, and Albu-
querque).
A simple random sample of 6 telemarketers from each of the three call centers was taken and the
number of telephone calls made in eight hours by each observed employee is shown below.
Observation
Center 1
Austin
Center 2
Las Vegas
Center 3
Albuquerque
1
82
72
71
2
68
63
81
3
77
74
73
4
80
60
68
5
69
70
76
6
78
73
80
Sample Mean
75.667
68.667
74.833
Sample Variance
33.867
33.467
26.167
a. Using
= .10, test for any significant difference in number of telephone calls made at the three
call centers.
b. Apply Fisher’s least significant difference (LSD) procedure to determine where the differences
occur. Use
= .05.
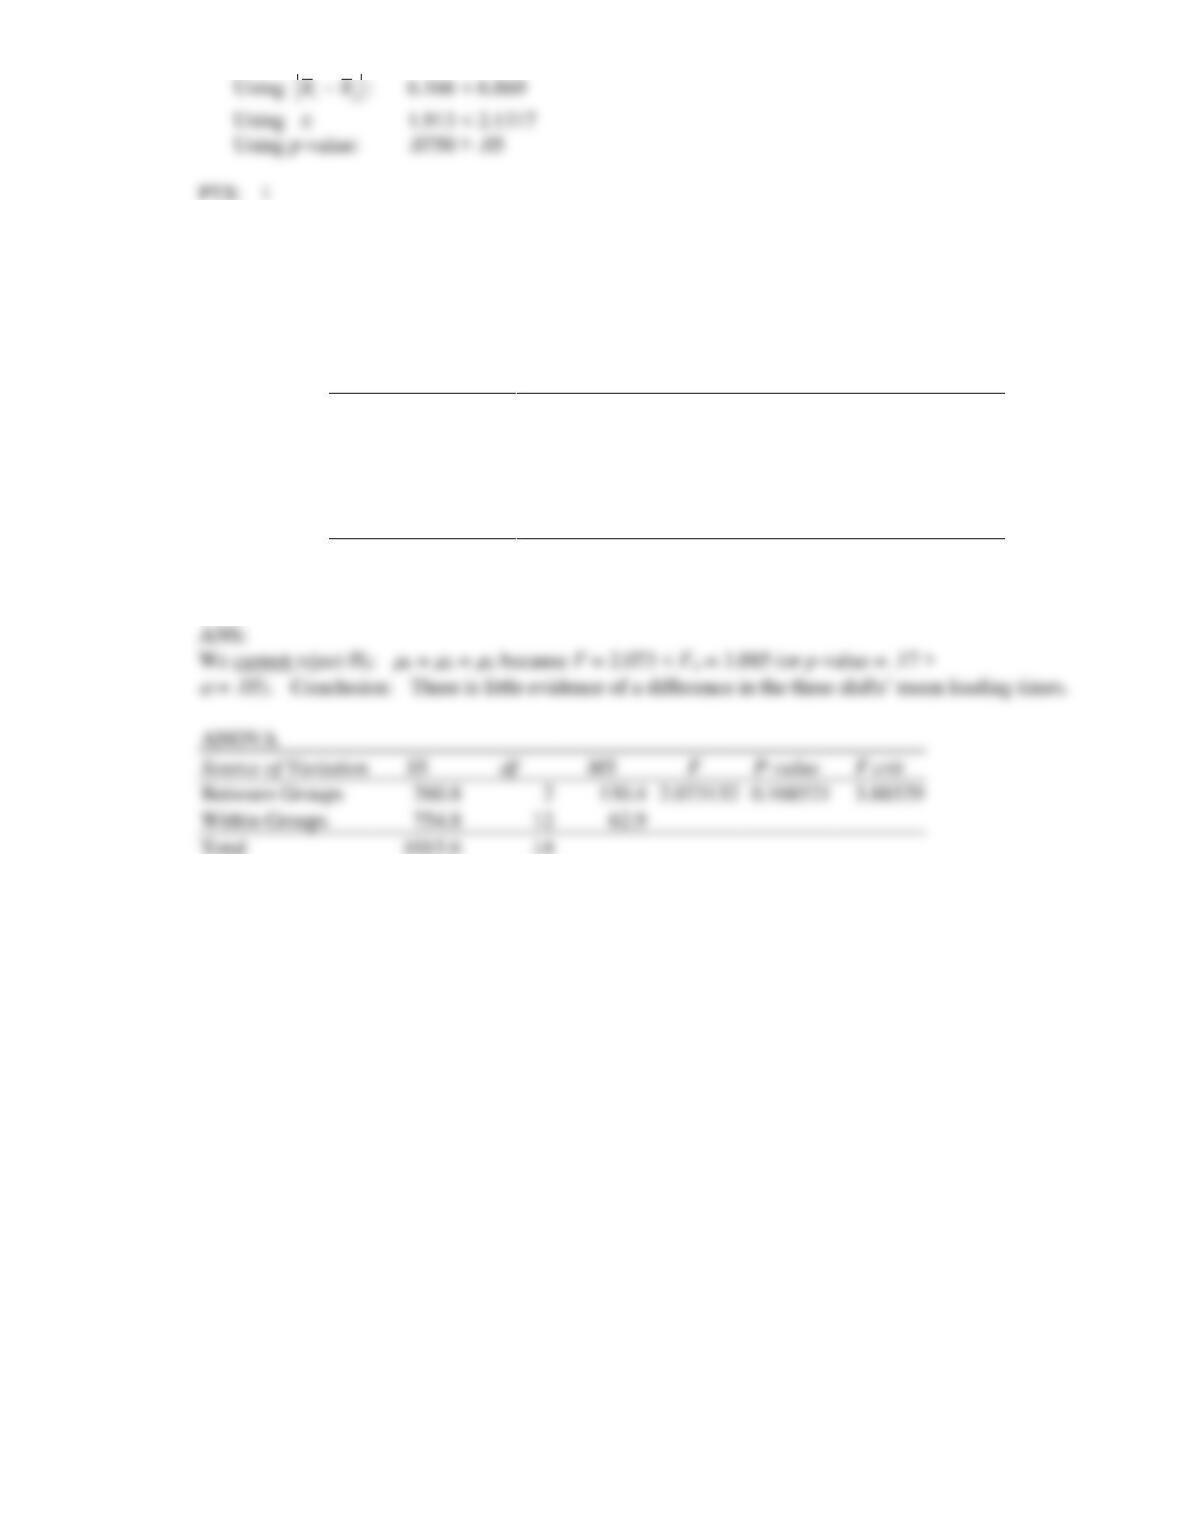
56. To test whether the time required to fully load a standard delivery truck is the same for three work
shifts (day, evening, and night), NatEx obtained the following data on the time (in minutes) needed to
pack a truck. Use these data to test whether the population mean times for loading a truck differ for
the three work shifts. Use
= .05.
Observation
Day Shift
Evening Shift
Night Shift
1
92
83
89
2
81
93
97
3
103
79
95
4
77
102
88
5
82
84
106
Sample Mean
87.0
88.2
95.0
Sample Variance
110.5
85.7
52.5