
In the analysis of variance procedure (ANOVA), factor refers to
a. the dependent variable
b. the independent variable
c. different levels of a treatment
d. the critical value of F
Scores on a recent national statistics exam were normally distributed with a mean of 80
and a standard deviation of 6.
a. What is the probability that a randomly selected exam will have a score of at least
71?
b. What percentage of exams will have scores between 89 and 92?
c. If the top 2.5% of test scores receive merit awards, what is the lowest score eligible
for an award?
d. If there were 334 exams with scores of at least 89, how many students took the
exam?
Exhibit 15-1
In a regression model involving 44 observations, the following estimated regression

equation was obtained.
= 29 + 18x1 +43x2 + 87x3
For this model SSR = 600 and SSE = 400.
Refer to Exhibit 15-1. The coefficient of determination for the above model is
a. 0.667
b. 0.600
c. 0.336
d. 0.400
Any process that generates well-defined outcomes is
a. an event
b. an experiment
c. a sample point
d. None of the other answers is correct.
In a simple regression analysis (where y is a dependent and x an independent variable),
if the y intercept is positive, then
a. there is a positive correlation between x and y
b. there is a negative correlation between x and y
c. if x is increased, y must also increase
d. None of these answers is correct.
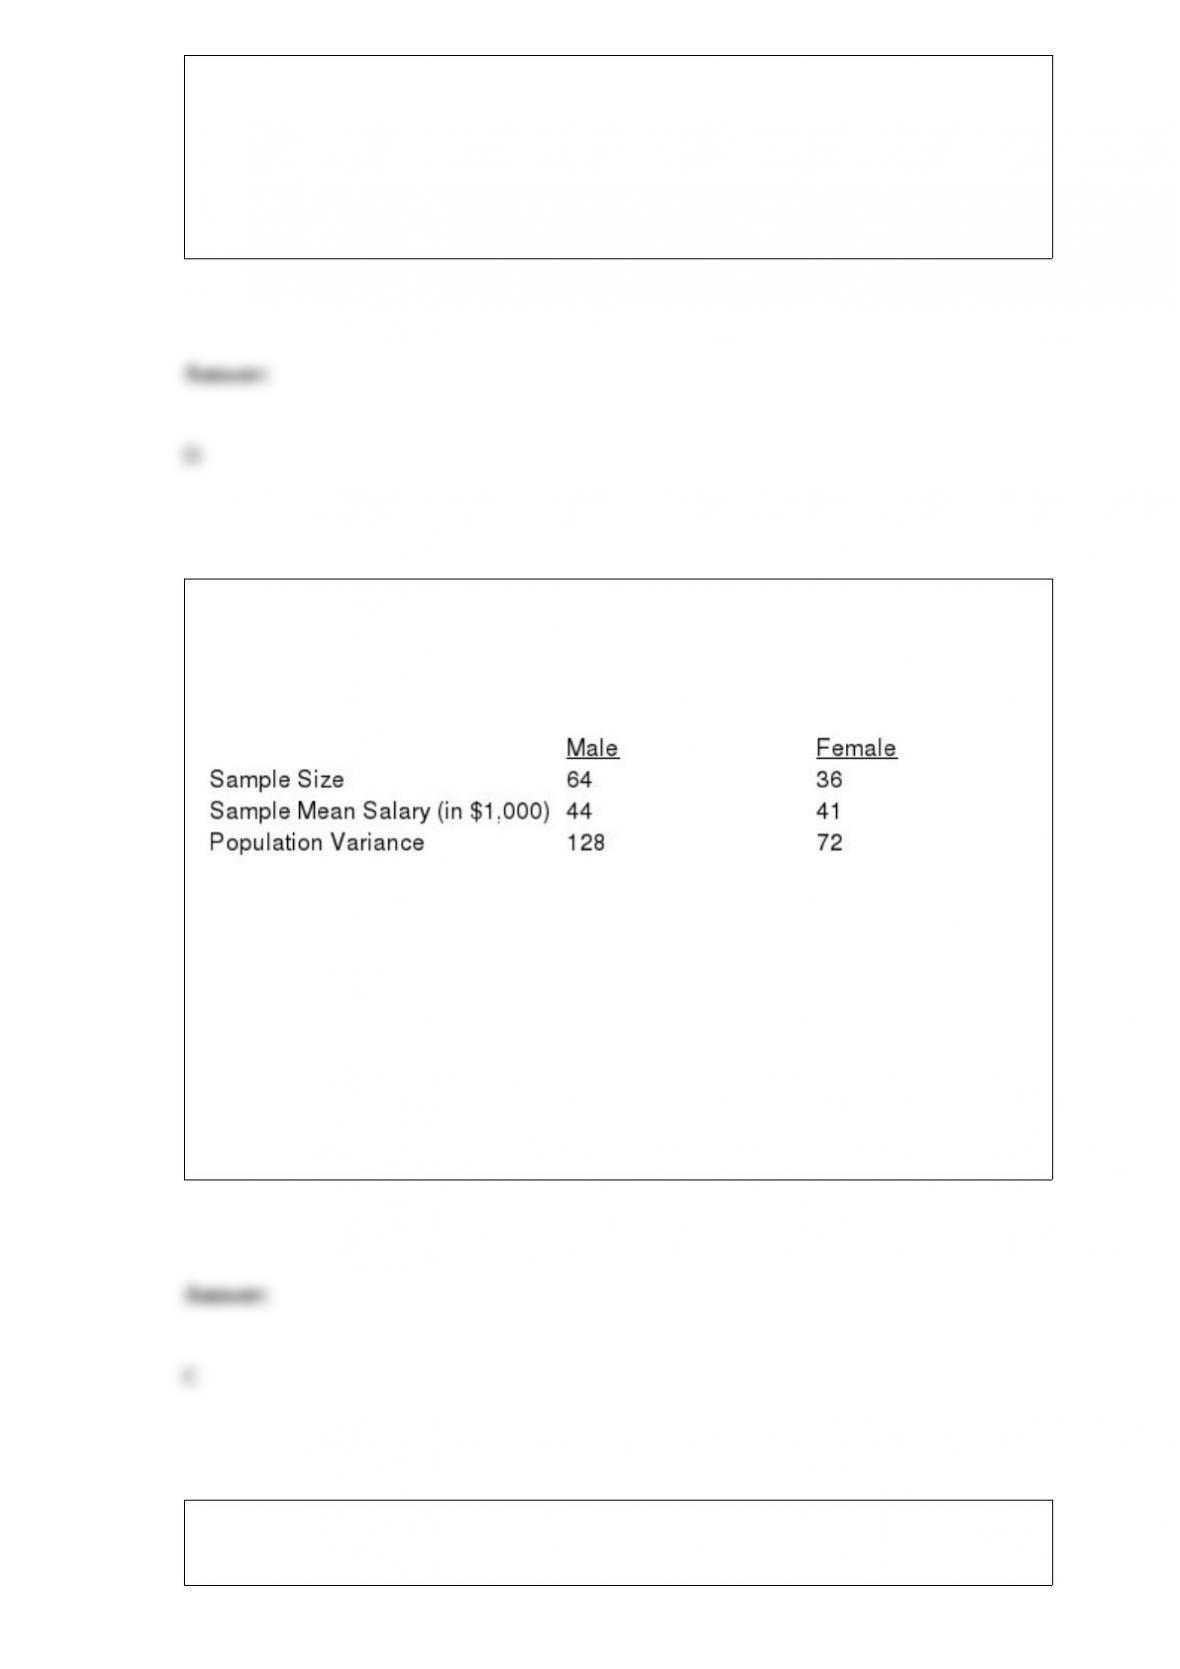
Exhibit 10-1
Salary information regarding male and female employees of a large company is shown
below.
Refer to Exhibit 10-1. At 95% confidence, the margin of error is
a. 1.96
b. 1.645
c. 3.920
d. 2.000
New information obtained through research or experimentation that enables an updating
or revision of the state-of-nature probabilities is

a. population information
b. sampling without replacement
c. sample information
d. conditional information
The school’s newspaper reported that the proportion of students majoring in business is
at least 30%. You plan on taking a sample to test the newspaper’s claim. The correct set
of hypotheses is
a. H0: p < 0.30 Ha: p 0.30
b. H0: p 0.30 Ha: p > 0.30
c. H0: p 0.30 Ha: p < 0.30
d. H0: p > 0.30 Ha: p 0.30
To compute an interval estimate for the difference between the means of two
populations, the t distribution
a. is restricted to small sample situations
b. is not restricted to small sample situations

c. can be applied when the populations have equal means
d. None of these alternatives is correct.
The life expectancy in the United States is 75 with a standard deviation of 7 years. A
random sample of 49 individuals is selected.
a. What is the probability that the sample mean will be larger than 77 years?
b. What is the probability that the sample mean will be less than 72.7 years?
c. What is the probability that the sample mean will be between 73.5 and 76 years?
d. What is the probability that the sample mean will be between 72 and 74 years?
e. What is the probability that the sample mean will be larger than 73.46 years?
Exhibit 12-5
The table below gives beverage preferences for random samples of teens and adults.
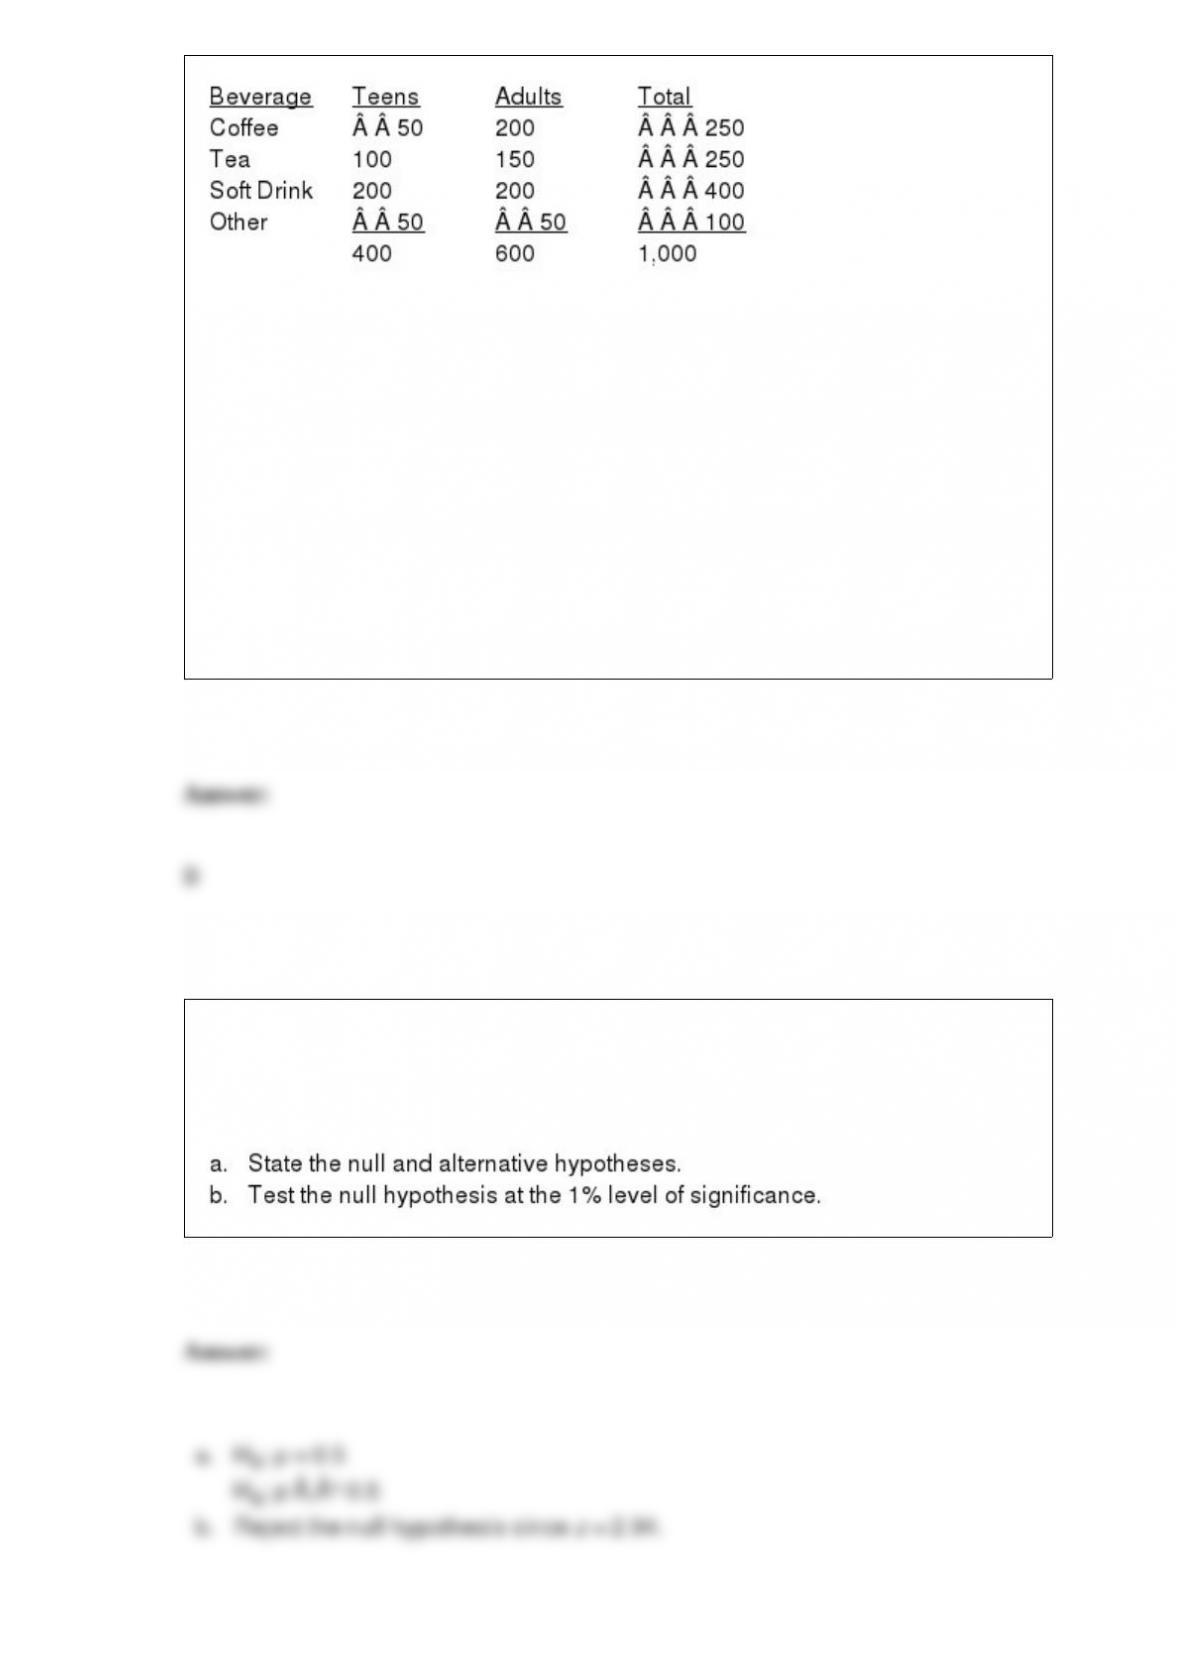
We are asked to test for independence between age (i.e., adult and teen) and drink
preferences.
Refer to Exhibit 12-5. With a .05 level of significance, the critical value for the test is
a. 1.645
b. 7.815
c. 14.067
d. 15.507
The president of a company wants to see if the new anti-smoking campaign is having
any influence on his employees. A sample of 100 employees who smoked prior to the
campaign is taken. Thirty-six employees said they smoked less, 15 employees said they
smoked more, and 49 employees said there was no change.
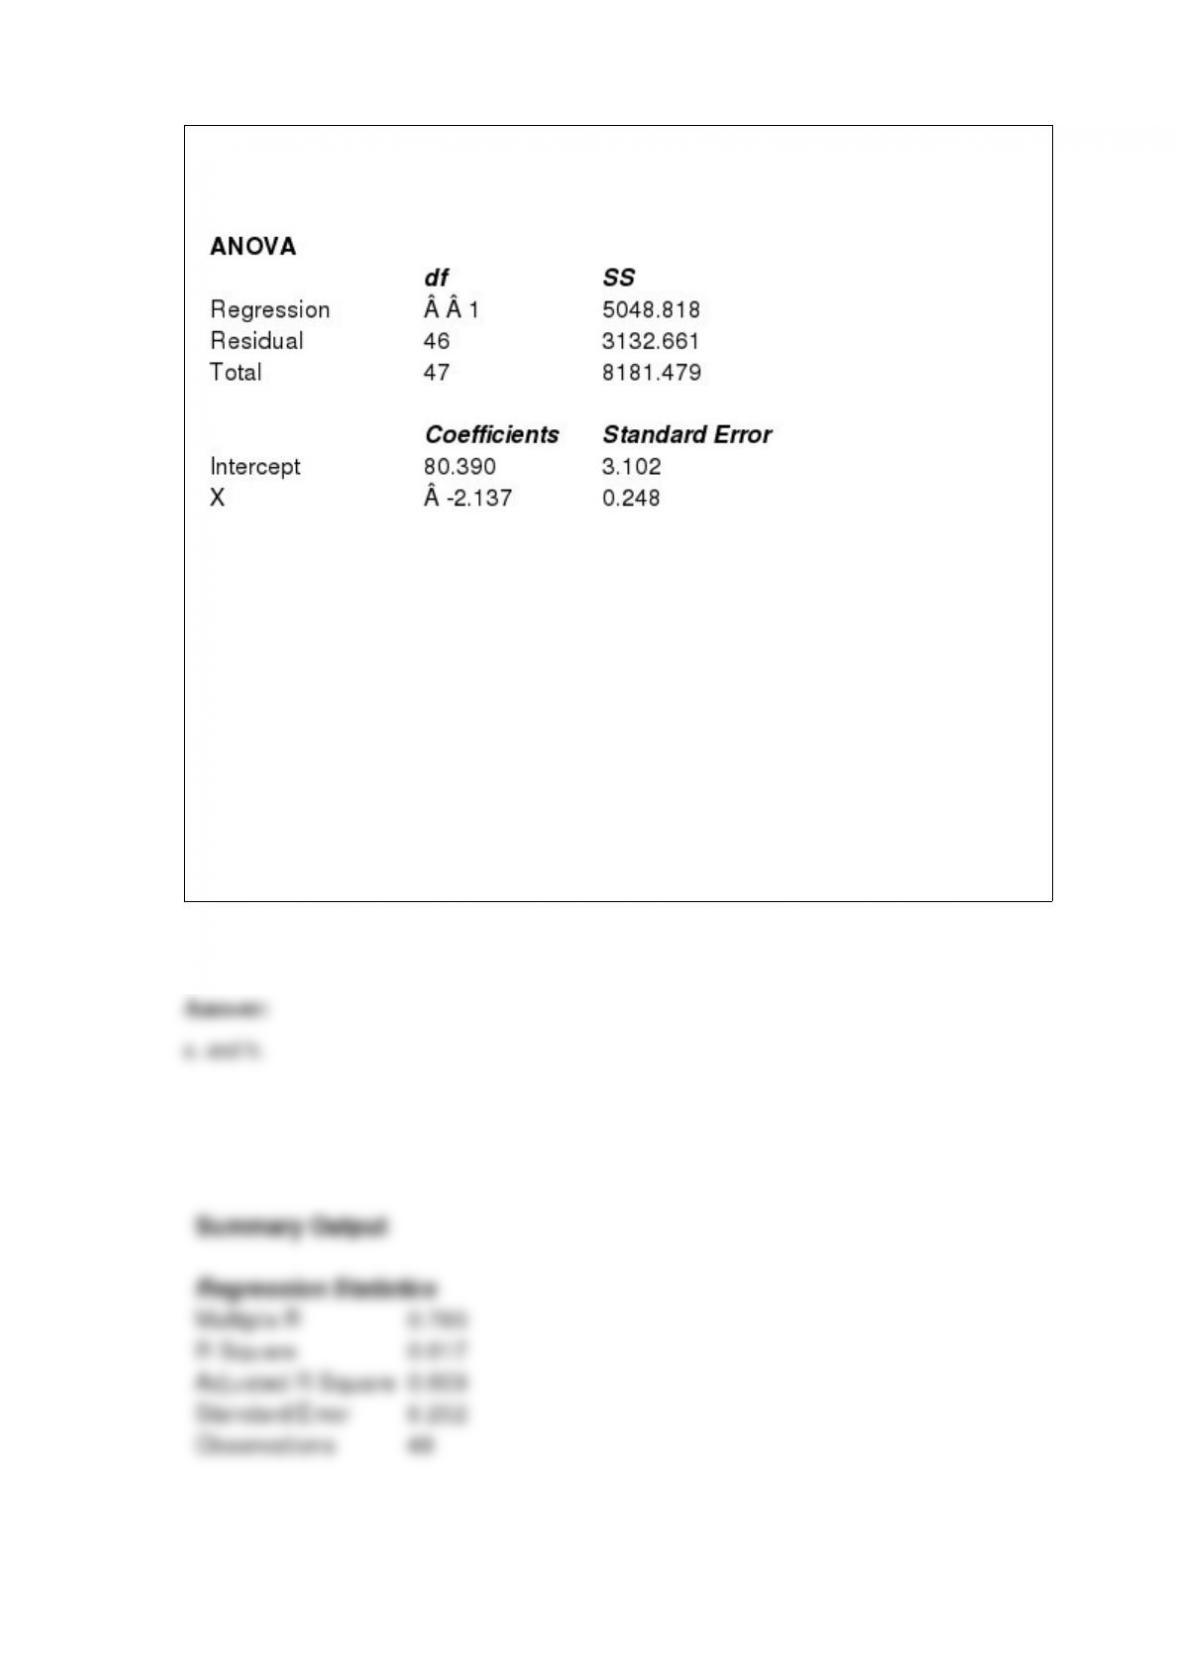
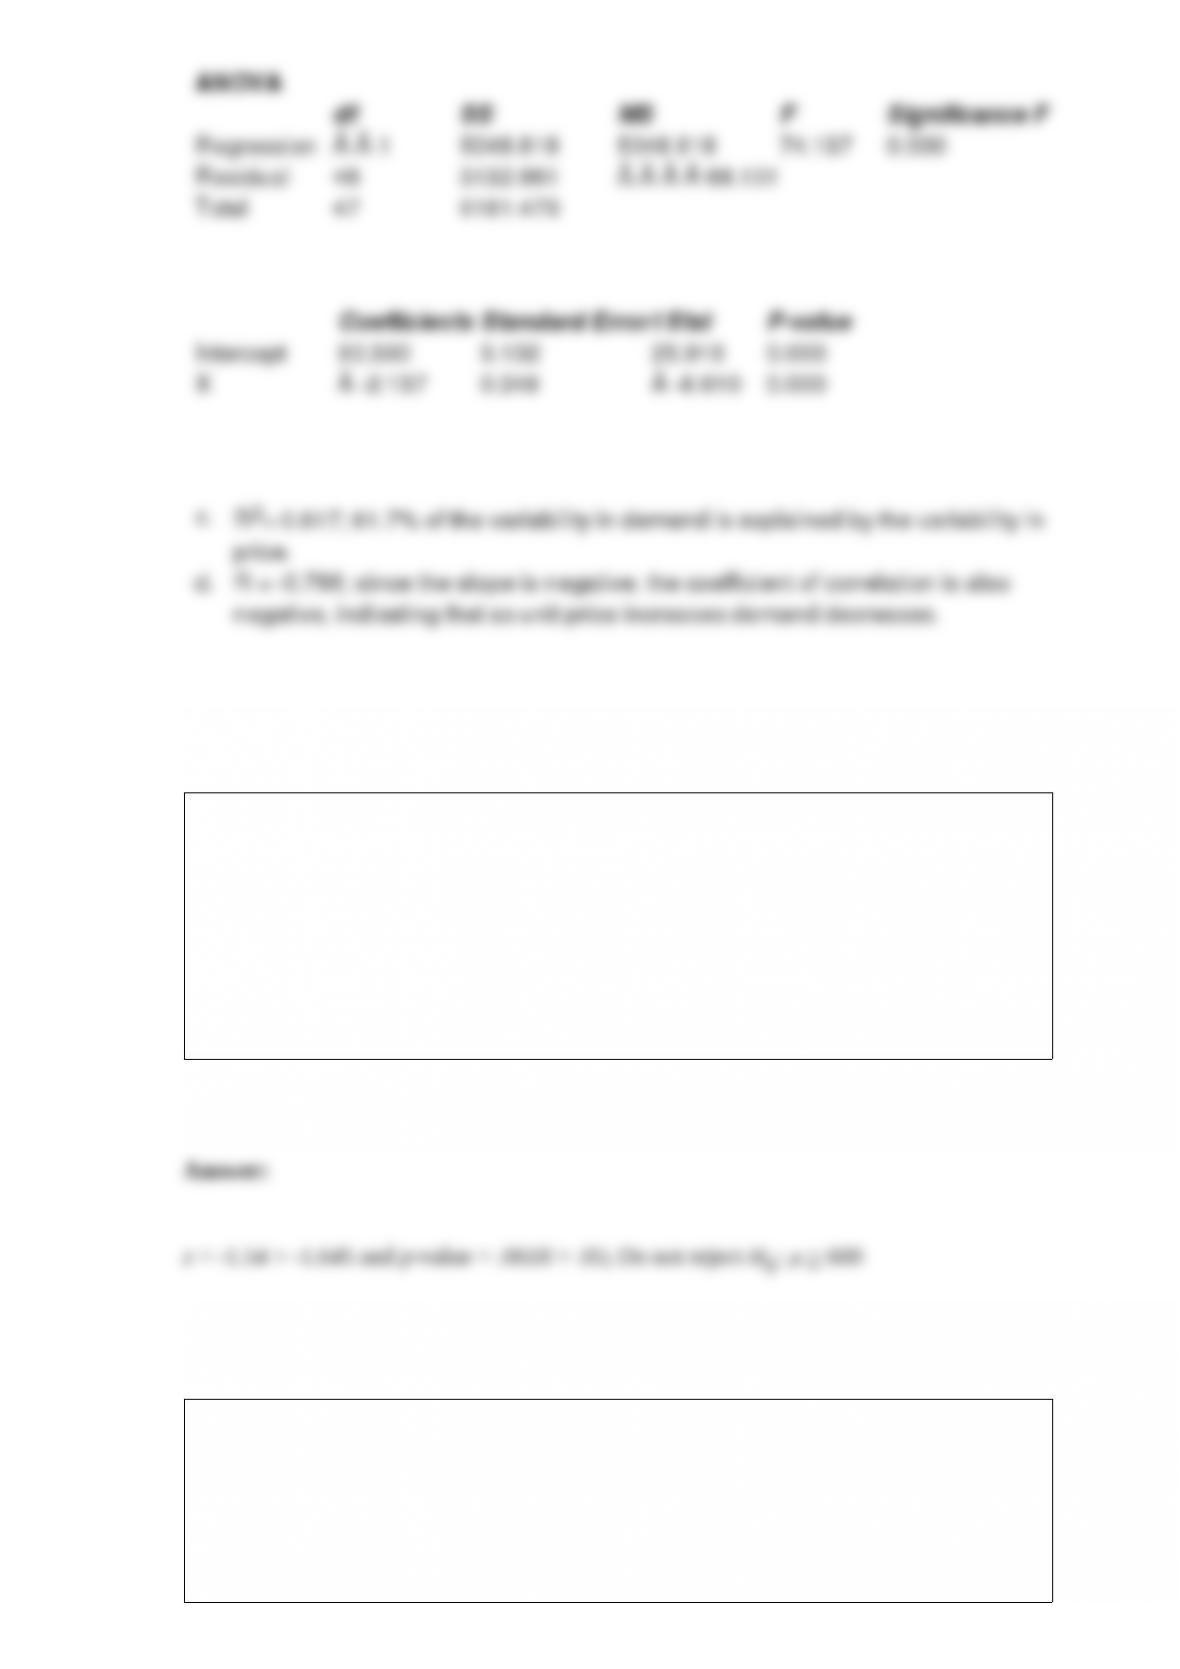
Shown below is a portion of a computer output for a regression analysis relating Y
(demand) and X (unit price).
a. Perform a t test and determine whether or not demand and unit price are related. Let
= 0.05.
b. Perform an F test and determine whether or not demand and unit price are related.
Let = 0.05.
c. Compute the coefficient of determination and fully interpret its meaning. Be very
specific.
d. Compute the coefficient of correlation and explain the relationship between demand
and unit price.
A radio talk show host in Brockdale has complained that the average monthly rent for
an efficiency apartment in that city is $600 or more. The Brockdale Landlords
Association (BLA) believes that this claim is an exaggeration. BLA takes a random
sample of 100 efficiency apartments in the city, inquiring about the monthly rent
charged for each. The mean rent for the 100-apartment sample is $592. Conduct a
hypothesis test with
= .05 and draw your conclusion using the p-value approach.
(Assume the standard deviation for all efficiency apartment rents in this city is known
to be about $52.)
Rejecting a poor-quality lot would be a
a. Type I error
b. Type II error

c. correct decision
d. None of the other answers is correct.
Categorical data can be graphically represented by using a(n)
a. histogram
b. frequency polygon
c. ogive
d. bar chart
A regression analysis between demand (y in 1000 units) and price (x in dollars) resulted
in the following equation
9 3x
The above equation implies that if the price is increased by $1, the demand is expected
to
a. increase by 6 units
b. decrease by 3 units
c. decrease by 6,000 units
d. decrease by 3,000 units
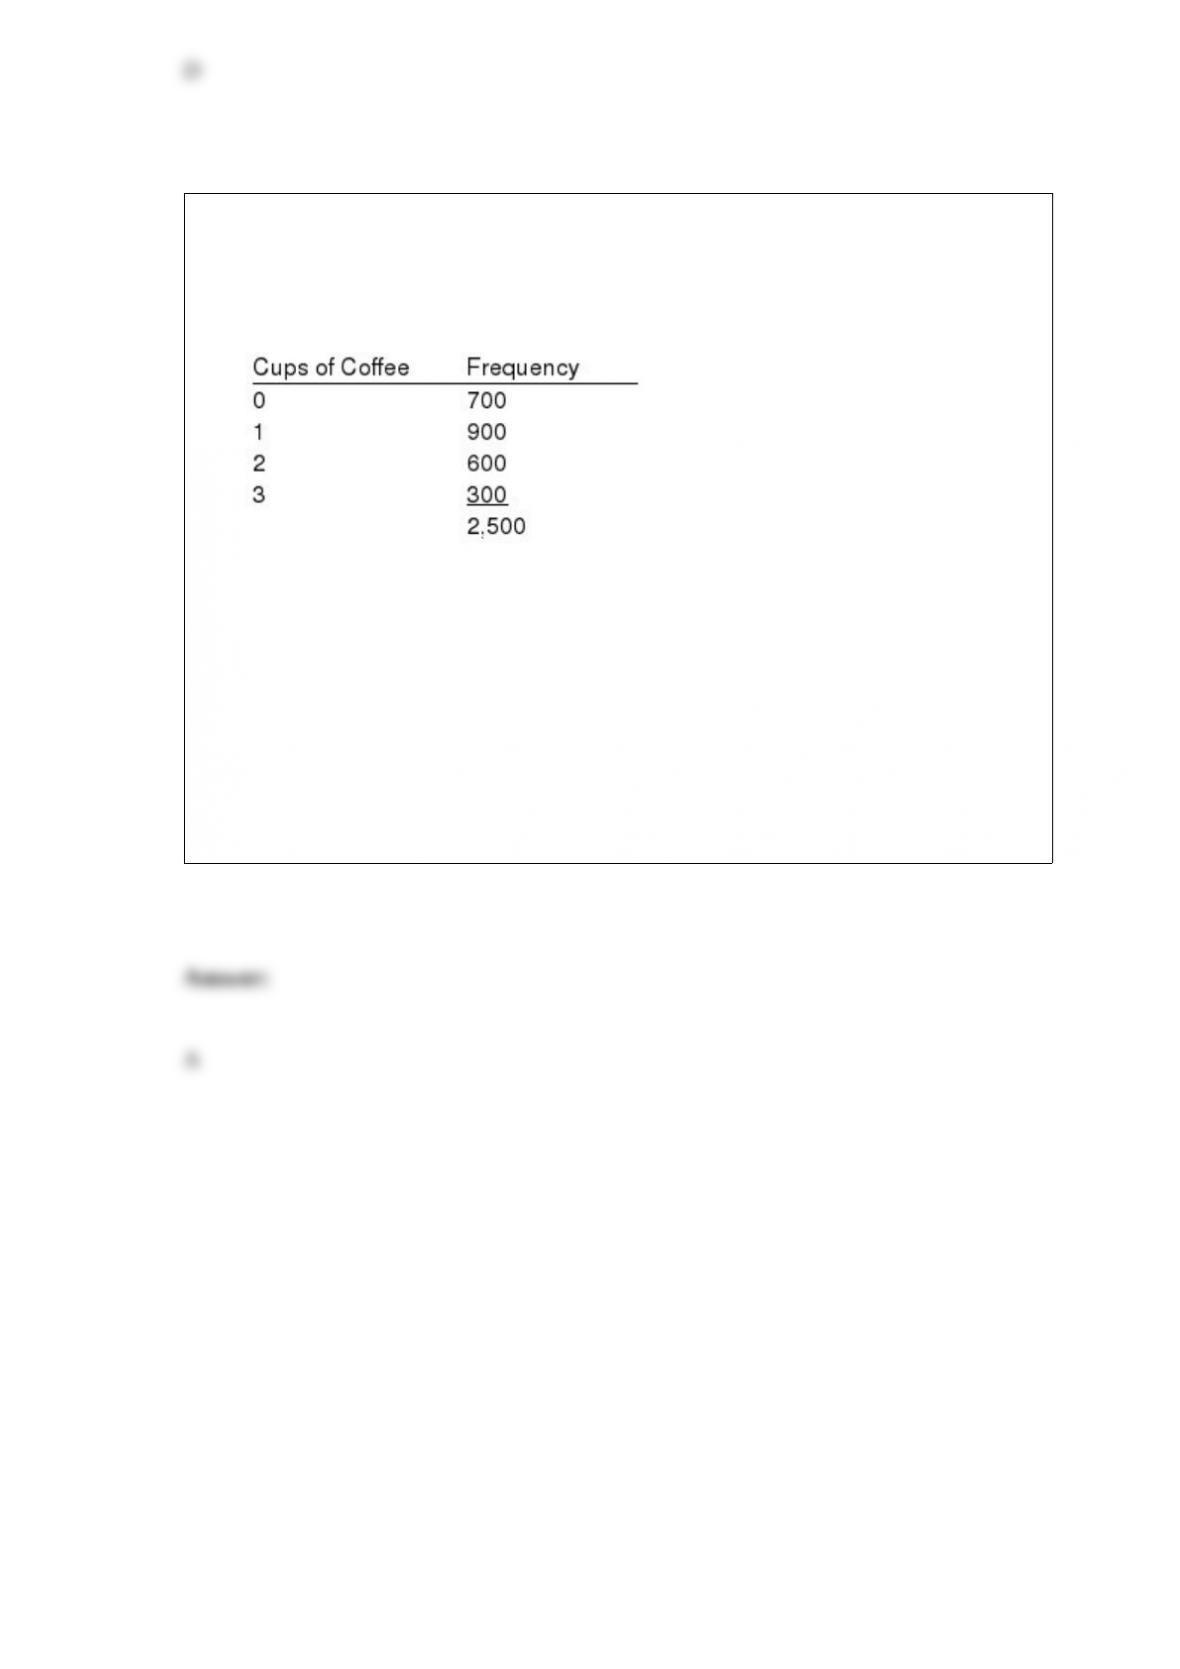
Exhibit 5-7
A sample of 2,500 people was asked how many cups of coffee they drink in the
morning. You are given the following sample information.
Refer to Exhibit 5-7. The variance of the number of cups of coffee is
a. .96
b. .9798
c. 1
d. 2.4