
Exhibit 14-3
Regression analysis was applied between sales data (in $1,000s) and advertising data
(in $100s) and the following information was obtained.
Refer to Exhibit 14-3. Based on the above estimated regression equation, if advertising
is $3,000, then the point estimate for sales (in dollars) is
a. $66,000
b. $5,412
c. $66
d. $17,400
The value of the ___________ is used to estimate the value of the population parameter.
a. population statistic
b. sample parameter
c. population estimate
d. sample statistic
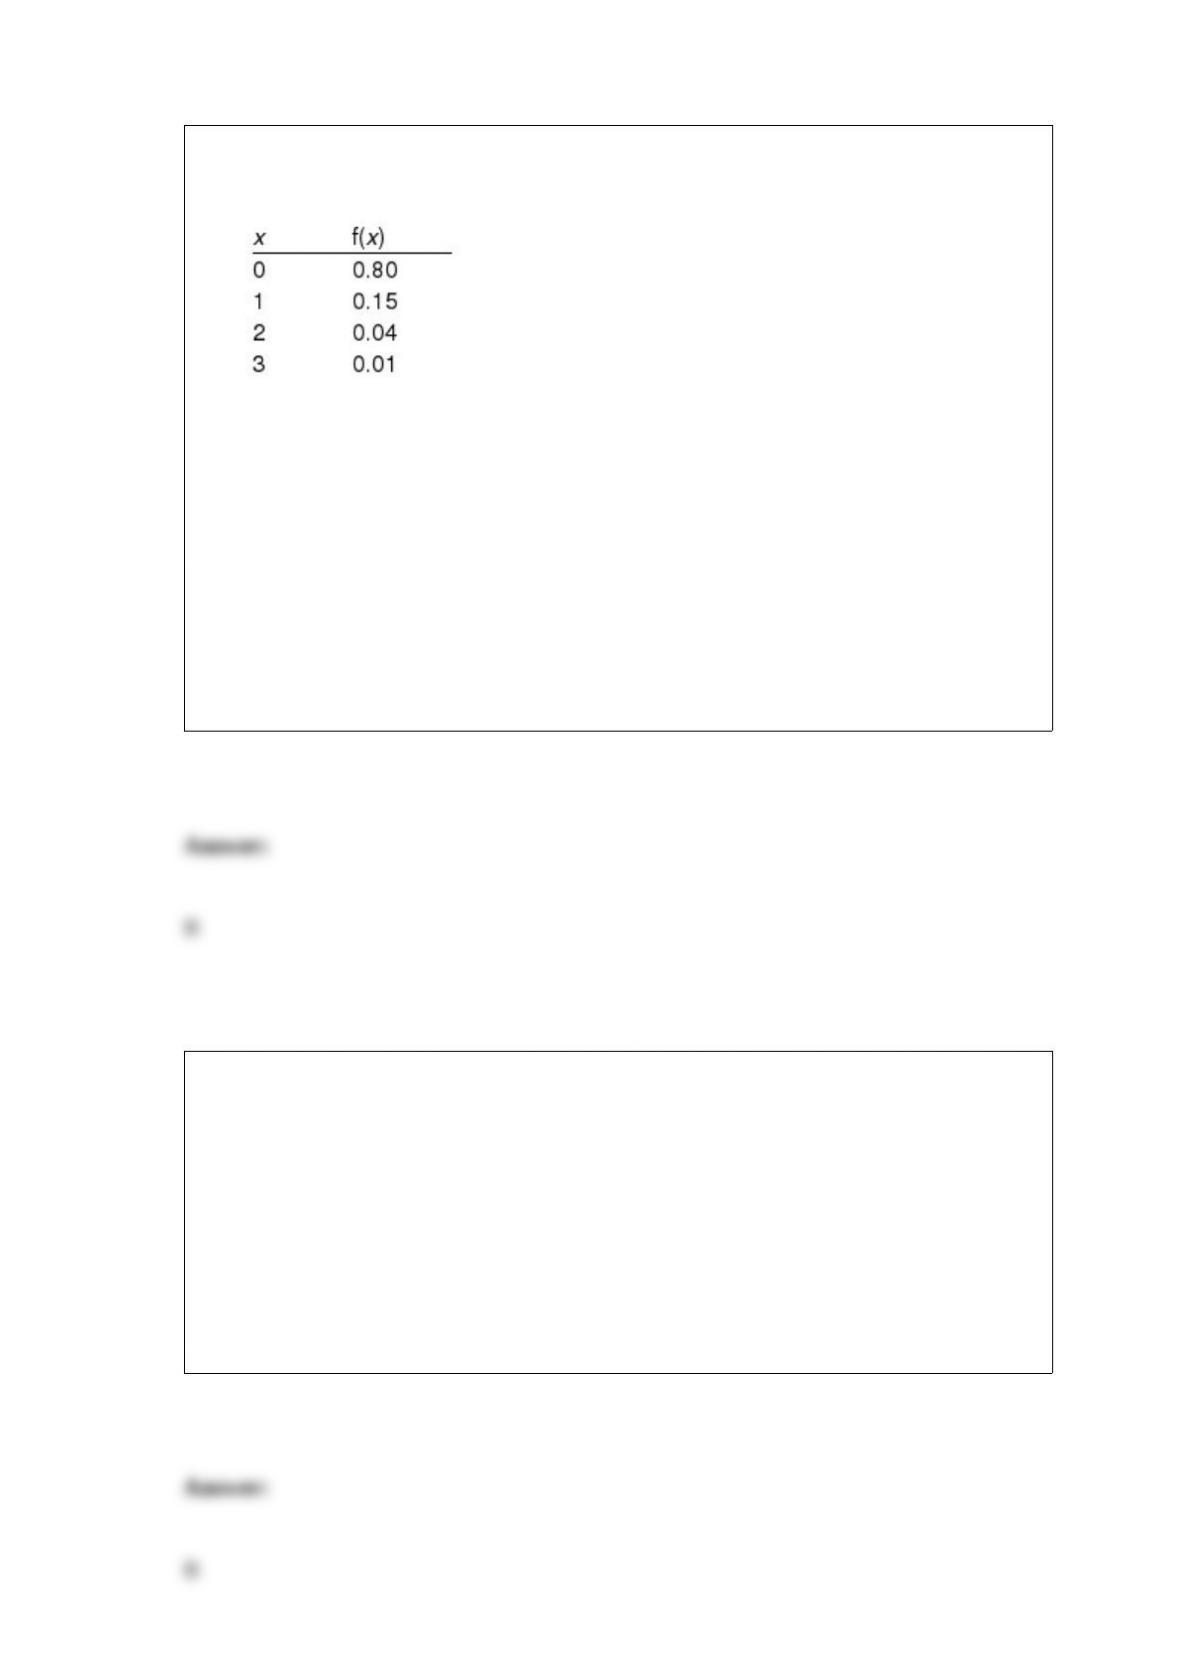
The number of electrical outages in a city varies from day to day. Assume that the
number of electrical outages (x) in the city has the following probability distribution.
The mean and the standard deviation for the number of electrical outages (respectively)
are
a. 2.6 and 5.77
b. 0.26 and 0.577
c. 3 and 0.01
d. 0 and 0.8
A two-tailed test is performed at a 5% level of significance. The p-value is determined
to be 0.09. The null hypothesis
a. must be rejected
b. should not be rejected
c. may or may not be rejected, depending on the sample size
d. has been designed incorrectly
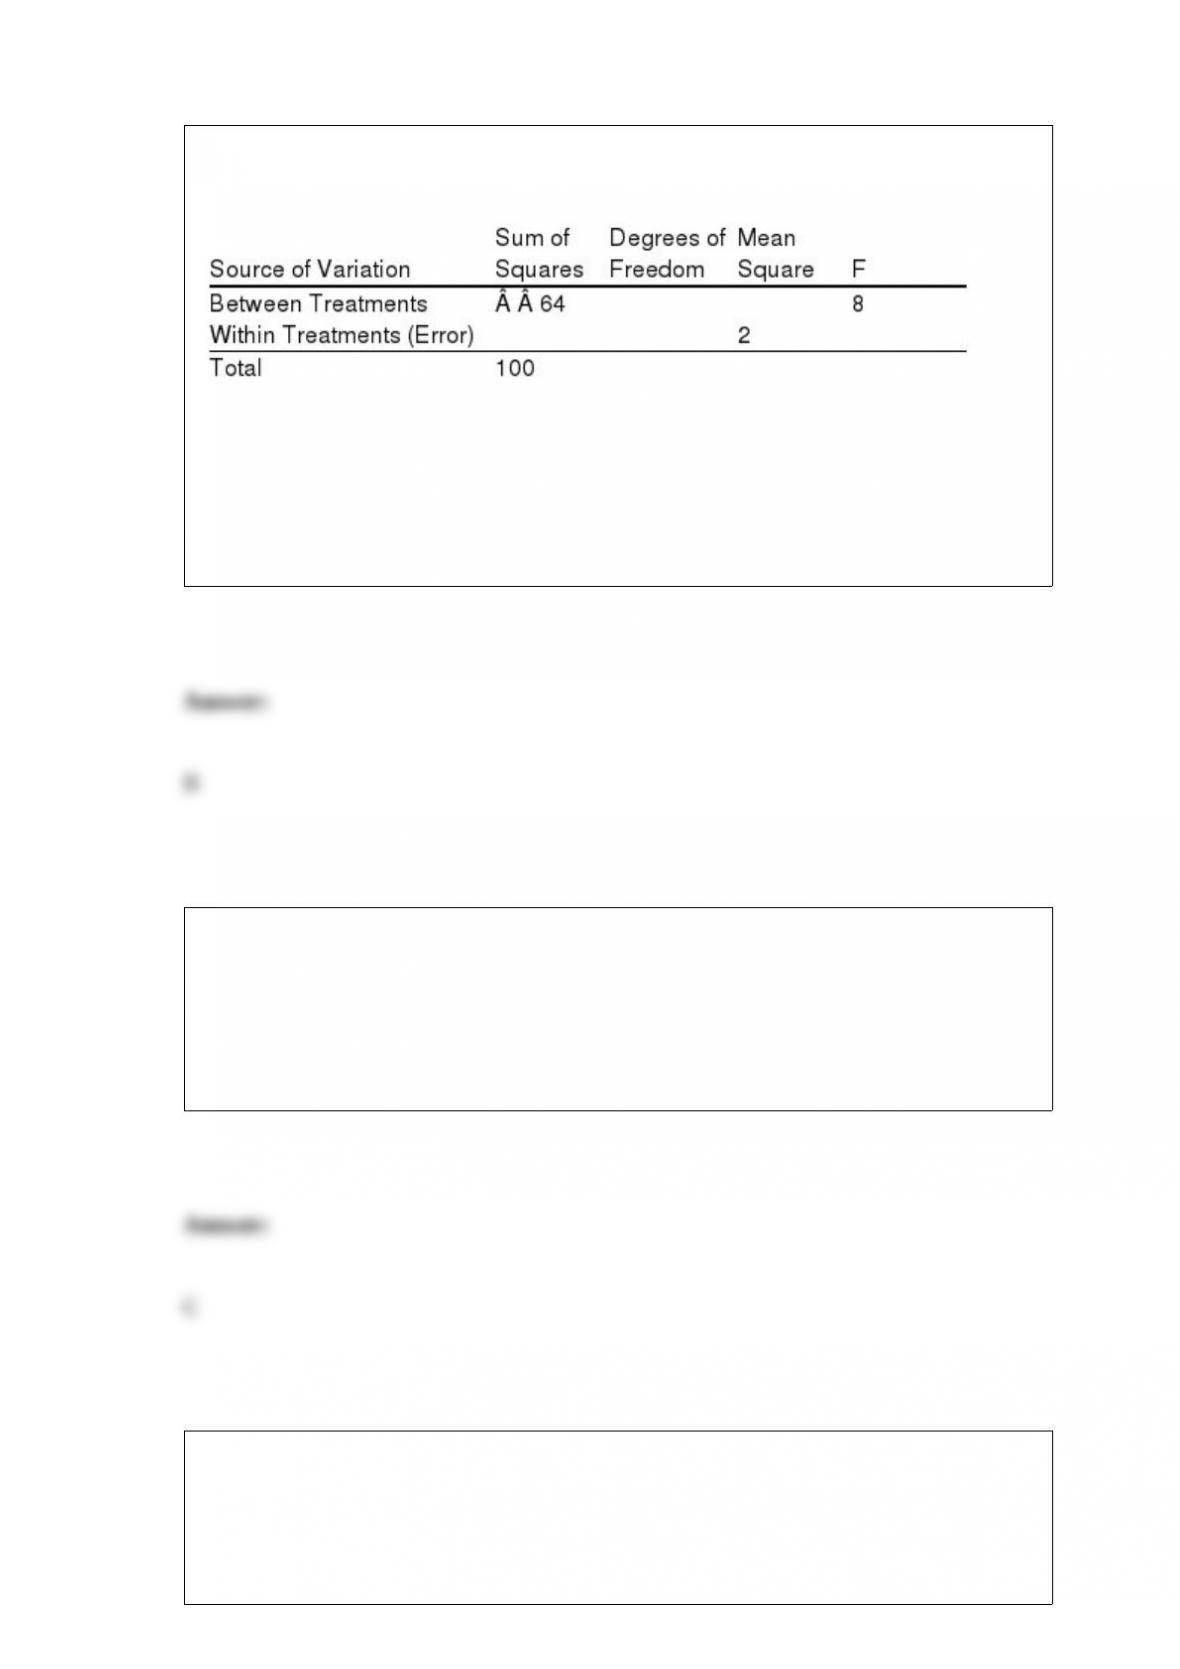
Exhibit 13-6
Part of an ANOVA table is shown below.
Refer to Exhibit 13-6. If at a 5% significance level we want to determine whether or not
the means of the populations are equal, the critical value of F is
a. 5.80
b. 2.93
c. 3.16
d. 2.90
Which of the following tests is used to determine whether an additional variable makes
a significant contribution to a multiple regression model?
a. a t test
b. a Z test
c. an F test
d. a chi-square test
The student body of a large university consists of 30% Business majors. A random
sample of 20 students is selected.
a. Define the random variable in words for this experiment.
b. What is the probability that among the students in the sample at least 10 are Business
majors?
c. What is the probability that at least 16 are not Business majors?
d. What is the probability that exactly 10 are Business majors?
e. What is the probability that exactly 12 are not Business majors?
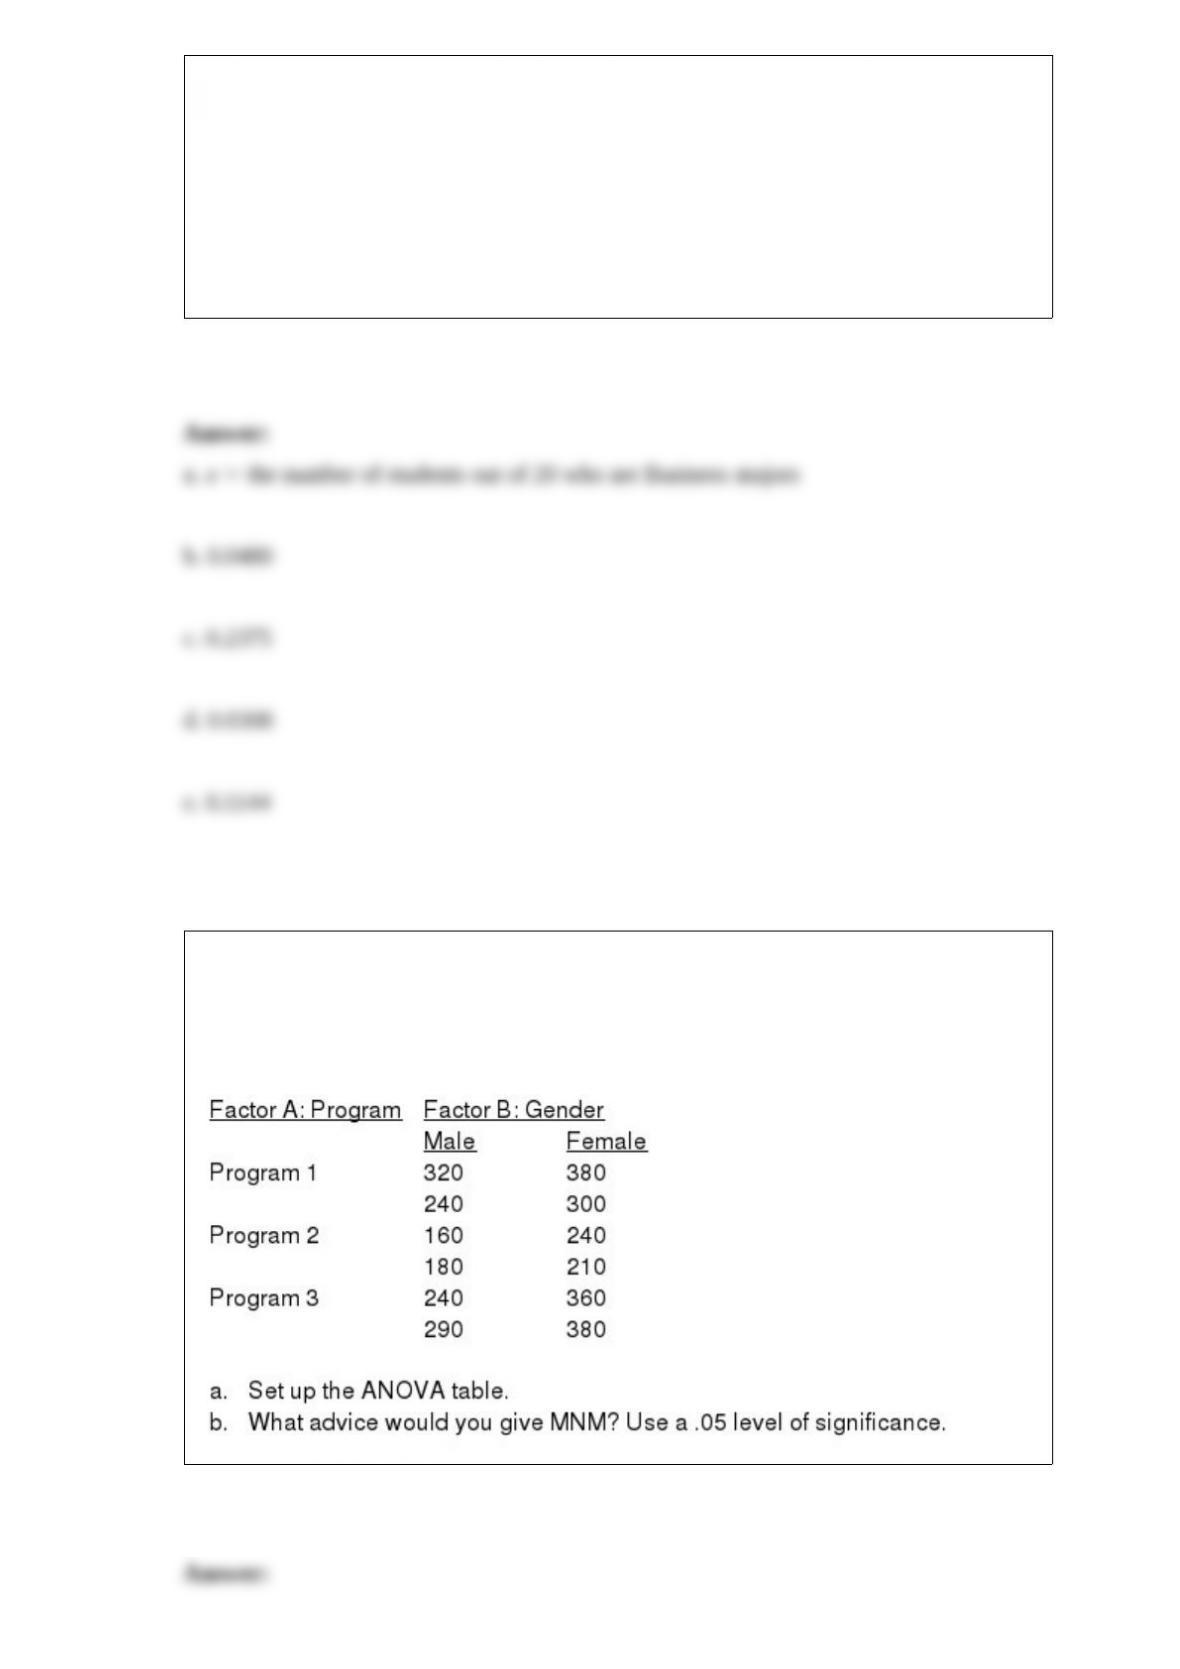
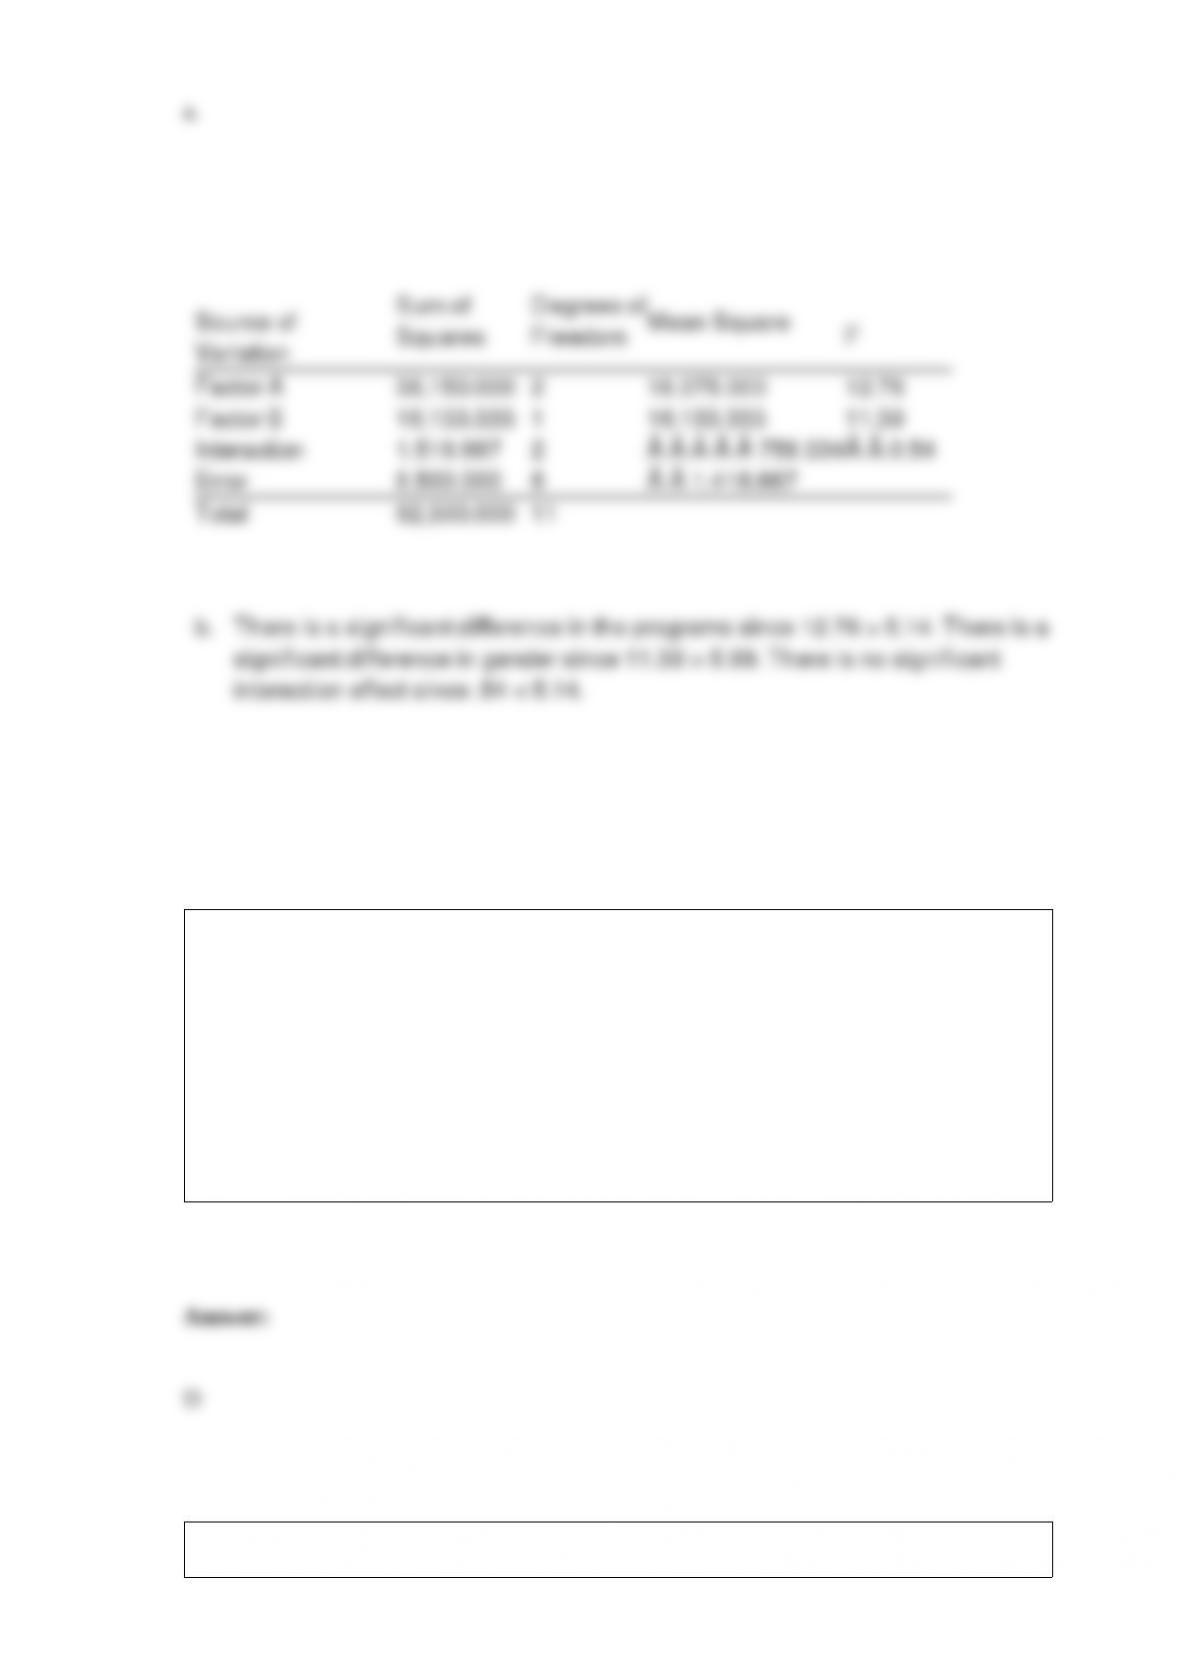
Employees of MNM Corporation are about to undergo a retraining program.
Management is trying to determine which of three programs is the best. They believe
that the effectiveness of the programs may be influenced by gender. A factorial
experiment was designed. You are given the following information.
Which of the following is an example of quantitative data?
a. the player’s number on a baseball uniform
b. the serial number on a one-dollar bill
c. the part number of an inventory item
d. the number of people in a waiting line
Compute the weighted mean for the following data.

Exhibit 18-5
Forty-one individuals from a sample of 60 indicated they oppose legalized abortion. We
are interested in determining whether or not there is a significant difference between the
proportions of opponents and proponents of legalized abortion.
Refer to Exhibit 18-5. The test statistics is
a. 3.87
b. 2.84
c. 60
d. 0.5
Allied Corporation is trying to determine whether to purchase Machine A or B. It has
leased the two machines for a month. A random sample of 5 employees has been taken.
These employees have gone through a training session on both machines. Below you
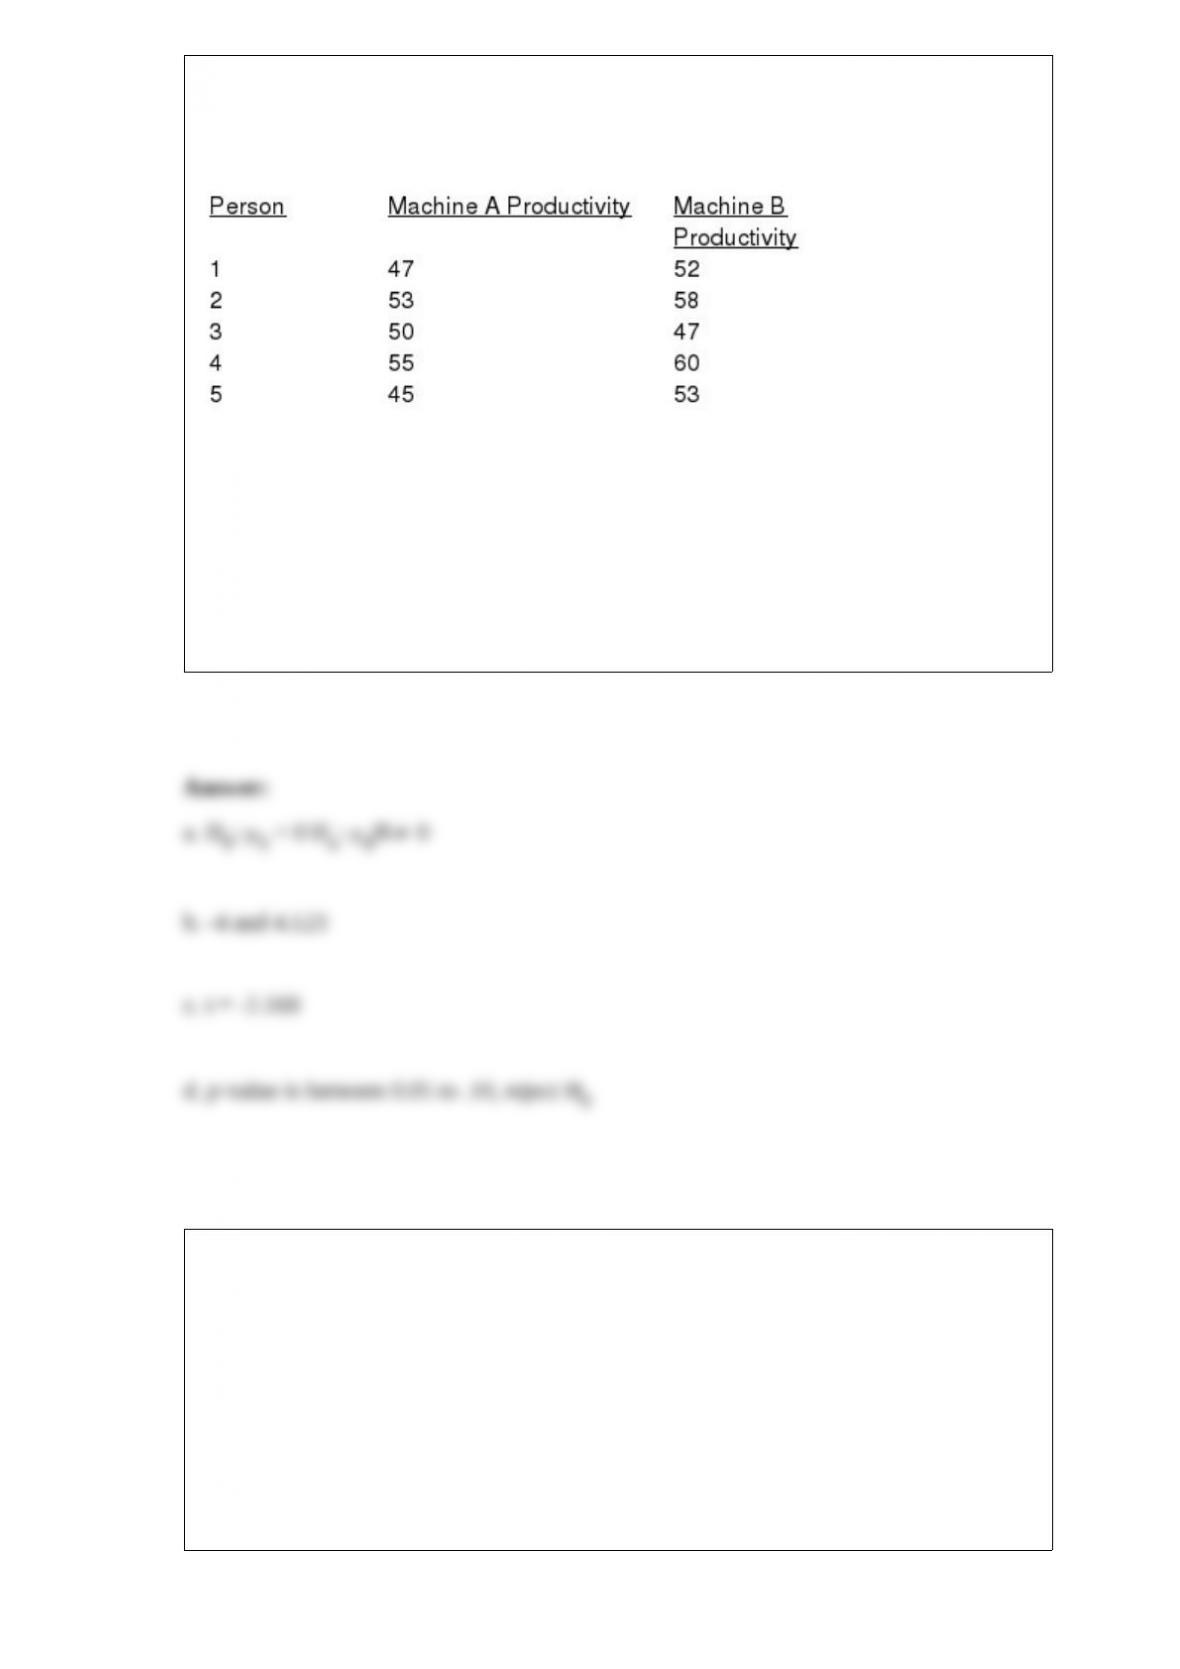
are given information on their productivity rate on both machines. (Let the difference
“d” be d = A – B.)
a. State the null and alternative hypotheses for a two-tailed test.
b. Find the mean and standard deviation for the difference.
c. Compute the test statistic.
d. Test the null hypothesis stated in Part a at the 10% level.
The test for goodness of fit, test of independence, and test of multiple proportions are
designed for use with
a. categorical data
b. bivariate data
c. quantitative data
d. ordinal data
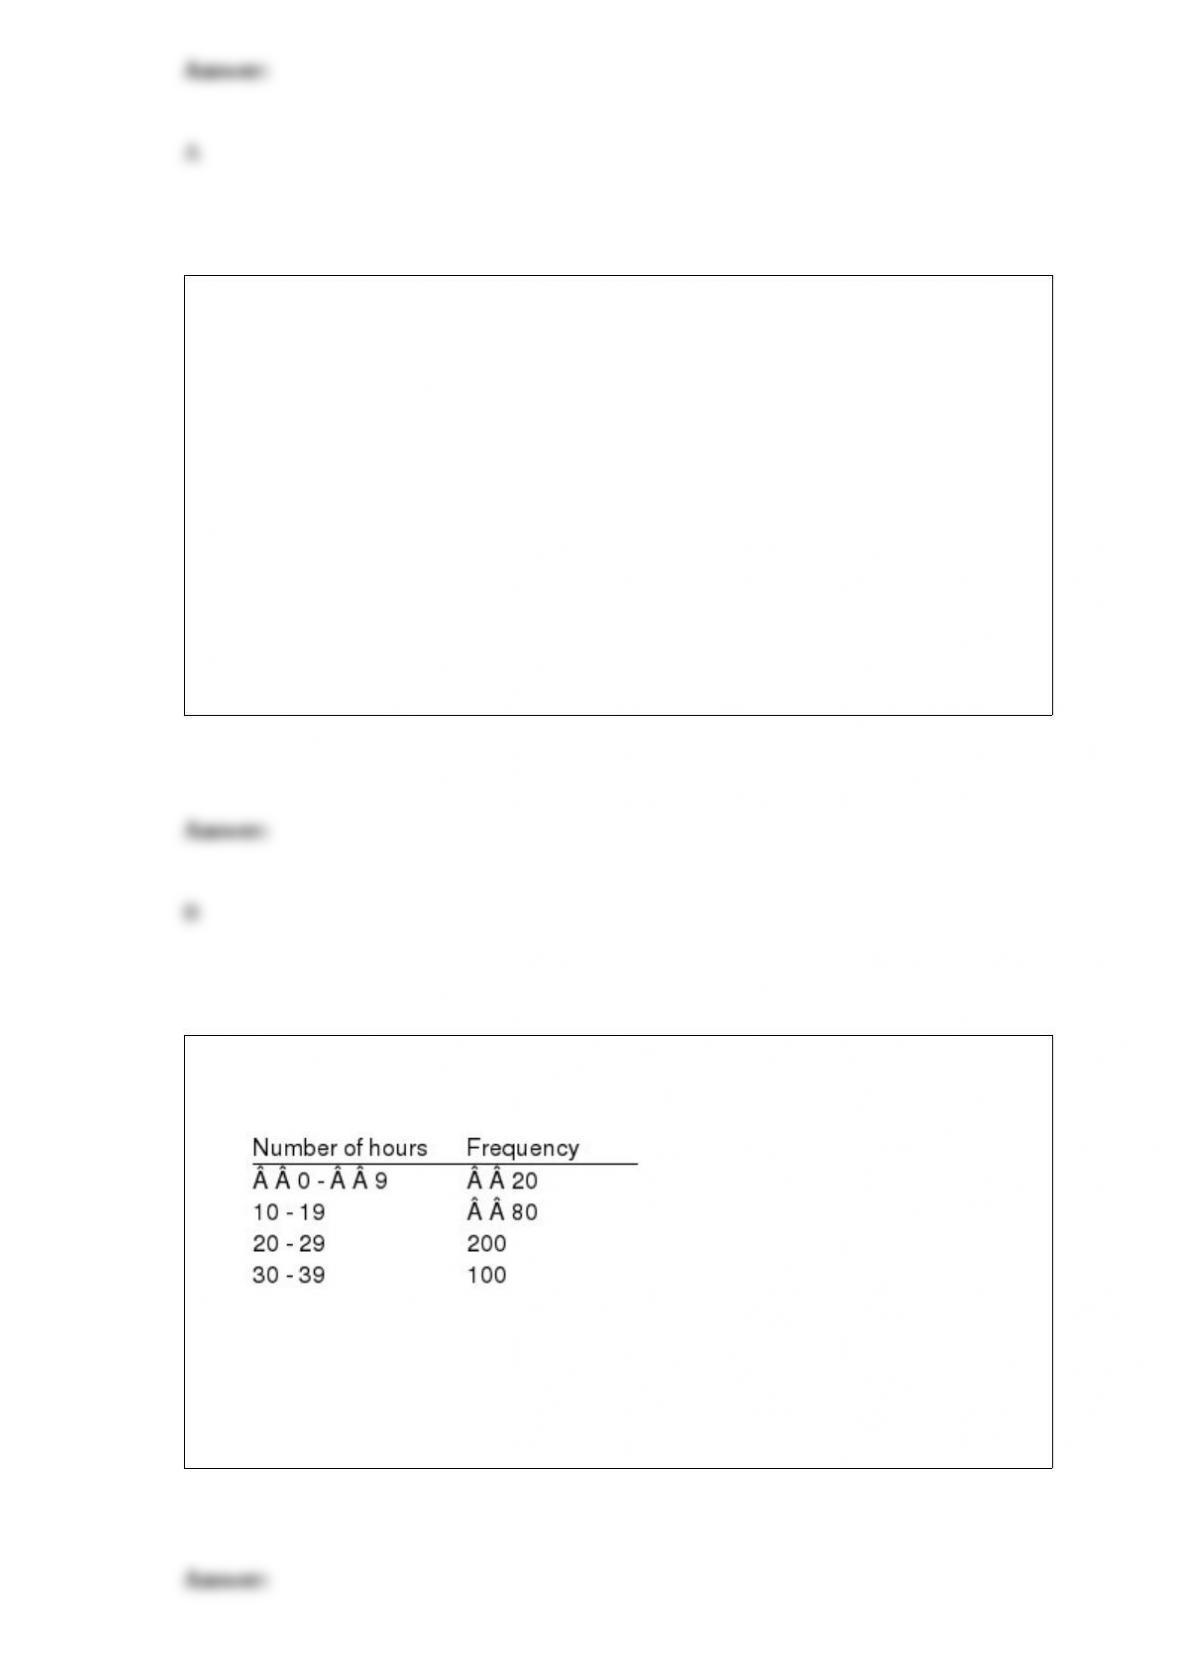
Exhibit 6-3
The weight of football players is normally distributed with a mean of 200 pounds and a
standard deviation of 25 pounds.
Refer to Exhibit 6-3. The probability of a player weighing less than 250 pounds is
a. 0.4772
b. 0.9772
c. 0.0528
d. 0.5000
Exhibit 2-1
The numbers of hours worked (per week) by 400 statistics students are shown below.
Refer to Exhibit 2-1. The class width for this distribution
a. is 9
b. is 10
c. is 39, which is: the largest value minus the smallest value or 39 0 39
d. varies from class to class

Exhibit 6-5
The weight of items produced by a machine is normally distributed with a mean of 8
ounces and a standard deviation of 2 ounces.
Refer to Exhibit 6-5. What is the probability that a randomly selected item will weigh
more than 10 ounces?
a. 0.3413
b. 0.8413
c. 0.1587
d. 0.5000
In an analysis of variance problem involving 3 treatments and 10 observations per
treatment, SSE = 399.6. The MSE for this situation is
a. 133.2
b. 13.32
c. 14.8
d. 30.0