Unlock document.
This document is partially blurred.
Unlock all pages and 1 million more documents.
Get Access
7. A lumber company has claimed that the standard deviation for the lengths of their 6 foot boards is 0.5
inches or less. To test their claim, a random sample of 17 six-foot boards is selected; and it is
determined that the standard deviation of the sample is 0.43. Do the results of the sample support the
company's claim? Use = 0.1.
8. An egg packing company has stated that the standard deviation of the weights of their grade A large
eggs is 0.07 ounces or less. The sample variance for 51 eggs was 0.0065 ounces. Can this sample
result confirm the company's claim? Use = 0.1.
9. The standard deviation of the daily temperatures in Honolulu last year was 3.2 degrees Fahrenheit. A
random sample of 19 days resulted in a standard deviation of 4 degrees Fahrenheit. Has there been a
significant change in the variance of the temperatures? Use = 0.02.
10. Do the following data indicate that the variance of the population from which this sample has been
drawn is 17? Use = 0.05.
12
5
9
14
10
11. At = 0.1, test to see if the population variances from which the following samples were drawn are
equal.
Group 1
Group 2
n1 = 21
n2 = 19
s1 = 18
s2 = 16
ANS:
12. The standard deviation of the ages of a sample of 16 executives from the northern states was 8.2 years;
while the standard deviation of the ages of a sample of 25 executives from the southern states was 12.8
years. At = 0.1, test to see if there is any difference in the standard deviations of the ages of all the
northern and southern executives.
13. Student advisors are interested in determining if the variances of the grades of day students and night
students are the same. The following samples are drawn:
Day
Night
n1 = 25
n2 = 31
s1 = 9.8
s2 = 14.7
Test the equality of the variances of the populations at 95% confidence.
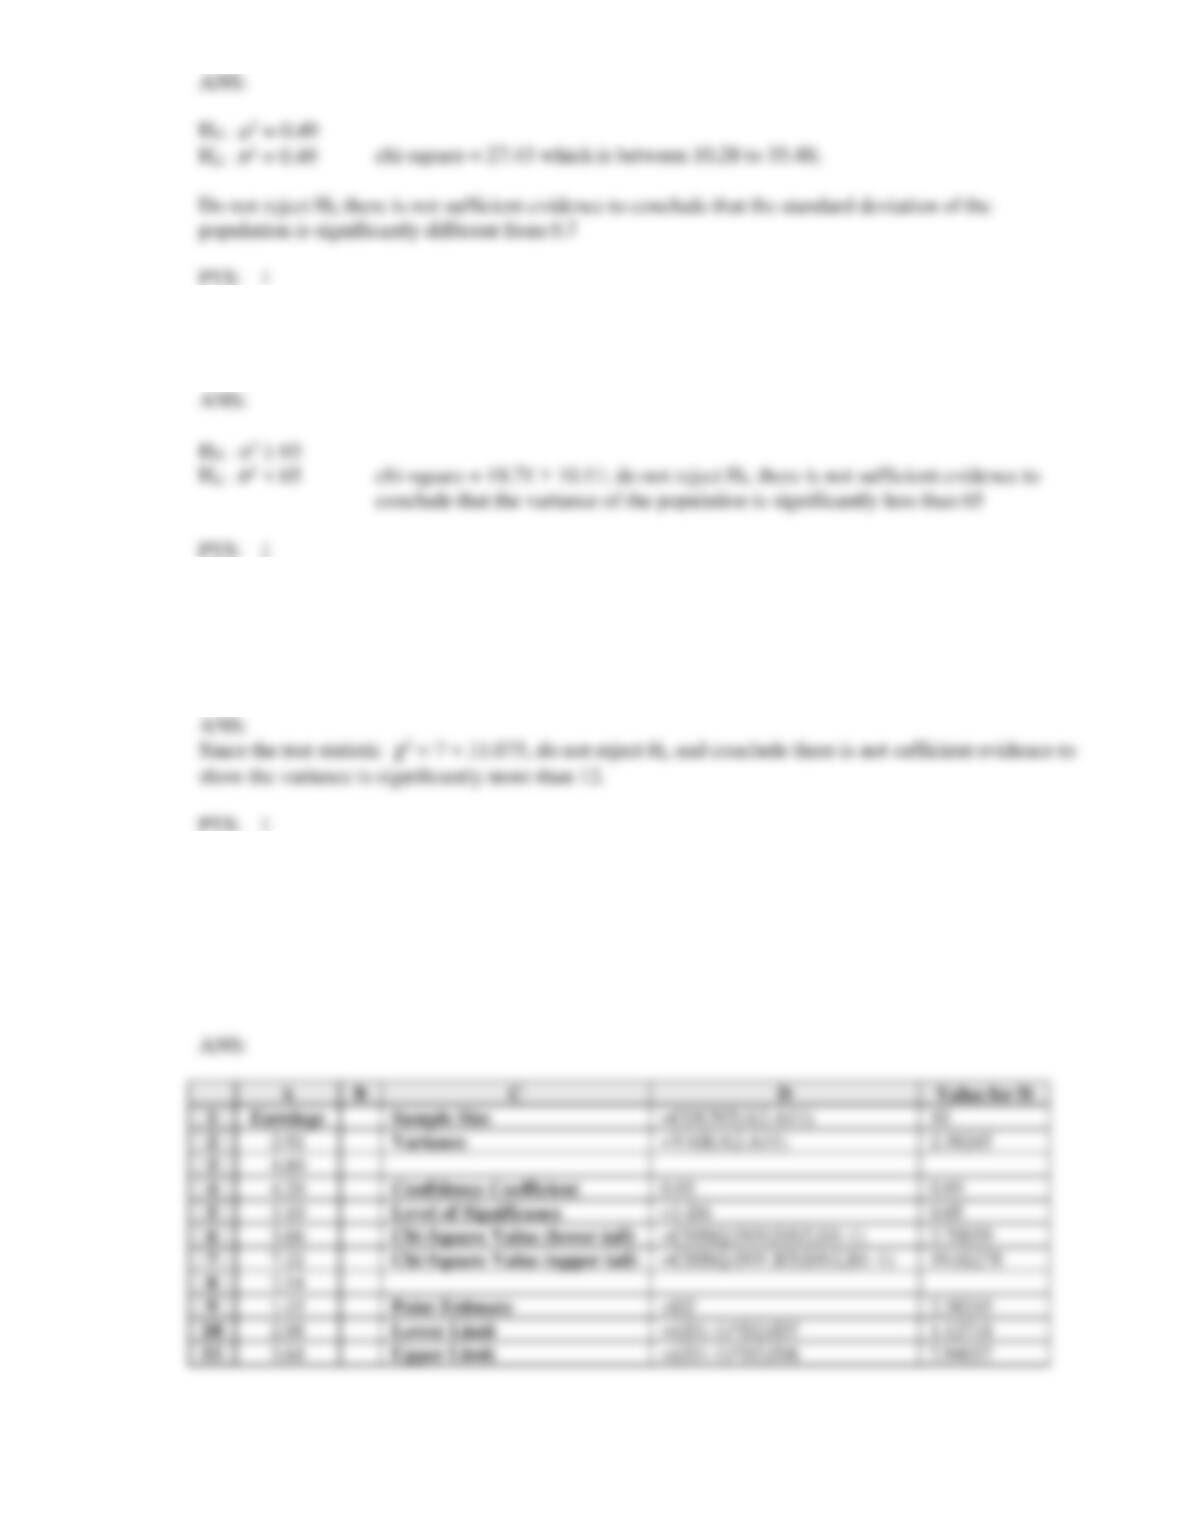
14. The grades of a sample of 5 students, selected from a large population, are given below.
Grade
70
80
60
90
75
a.
Determine a point estimate for the variance of the population.
b.
Determine a 95% confidence interval for the variance of the population.
c.
At 90% confidence, test to determine if the variance of the population is significantly less than
130.
15. A machine produces pipes used in airplanes. The average length of the pipe is 16 inches. The
acceptable variance for the length is .3 inches. A sample of 25 pipes was taken. The average length in
the sample was 15.95 inches with a variance of .4 inches.
a.
Construct a 95% confidence interval for the population variance.
b.
State the null and alternative hypotheses to be tested.
c.
Compute the test statistic.
d.
The null hypothesis is to be tested at the 5% level of significance. State the decision rule for the
test.
e.
What do you conclude about the population variance?
16. You are given the following results from a sample of 5 observations.
4
6
3
4
3
a.
Construct a 99% confidence interval for the population variance.
b.
The null and alternative hypotheses are H0: 2 2 and Ha: 2 < 2. Compute the test statistic.
c.
Perform the test of the hypothesis at the 1% level.
d.
What do you conclude about the population variance?
17. It is crucial that the variance of a production process be less than or equal to 25. A sample of 22 is
taken. The sample variance equaled 26.
a.
Construct a 90% confidence interval for the population variance.
b.
Construct a 90% confidence interval for the population standard deviation.
c.
State the null and alternative hypotheses to be tested.
d.
Compute the test statistic.
e.
The null hypothesis is to be tested at the 10% level of significance. State the decision rule for
the test.
f.
What do you conclude about the population variance?
18. It has been suggested that night shift-workers show more variability in their output levels than day
workers. Below, you are given the results of two independent random samples.
Night Shift
Day Shift
Sample Size
9
8
Sample Mean
520
540
Sample Variance
25
23
a.
State the null and alternative hypotheses to be tested.
b.
Compute the test statistic.
c.
The null hypothesis is to be tested at the 5% level of significance. State the decision rule for the
test.
d.
What do you conclude?
19. A coach is deciding on whether to buy stopwatches from company A or company B. A test was set up
to see how many seconds each stopwatch was off in a precise ten minute test period. For samples of
watches from companies A and B, the following information on stopwatch errors was found.
Company A
Company B
Sample Size
5
8
Sample Mean (seconds)
0.18
0.15
Sample Variance
0.3
1.1
Test the hypothesis of equal variances using a .05 level of significance. Be sure to state the null and
alternative hypotheses being tested and the final conclusions of the test.
20. The president of a bank believes that the variance of the deposits of suburban customers is less than
the variance of city customers. Below you are given the results of samples taken from suburban and
city customers.
Customers
Suburban Customers
City Customers
$780
$600
s
$100
$ 90
n
5
7
a.
State the null and alternative hypotheses to be tested.
b.
Compute the test statistic.
c.
The null hypothesis is to be tested at the 5% level of significance. State the decision rule for the
test.
d.
What do you conclude?
21. Two classes in business statistics showed the following results on a recent test.
Class 1
Class 2
Sample Size
25
21
Sample Mean
82
84
Sample Standard Deviation
6.2
7.6
Carry out a test to determine whether the difference in the variance of the scores on this test is due to
chance variation or is statistically significant with a .02 level of significance.
22. Test scores of two independent samples of students from UA and UB on a national examination are
given below. At a .05 level of significance, test to determine if there is a significant difference between
the variances of the two populations.
UA
UB
82
70
90
80
65
60
83
90
80
75
23. A random sample of 21 checking accounts at a bank showed an average daily balance of $430 with a
standard deviation of $50.
a.
Provide a 95% confidence interval estimate of the variance of the population of the checking
accounts.
b.
Provide a 95% confidence interval estimate of the standard deviation of the population of the
checking accounts.
24. A company has claimed that the standard deviation of the monthly incomes of their employees is less
than or equal to $120. To test their claim, a random sample of 15 employees of the company was
taken; and it was determined that the standard deviation of their incomes was $135. At a 5% level of
significance, test the company's claim.
25. A sample of 16 students showed that the variance in the number of hours they spend studying is 25. At
a 5% level of significance, test to see if the variance of the population is significantly different from
30.
26. We are interested in determining whether or not the variances of the starting salaries of accounting
majors is significantly different from management majors. The following information was gathered
from two samples:
Accounting
Management
Sample Size
16
16
Average Monthly Income
$2,400
$2,500
Standard Deviation
$ 105
$ 125
At a 5% level of significance, test to determine whether or not the variances are equal.
27. The average grade of a sample of 25 students on their second statistics examination was 85 with a
standard deviation of 9. Is the variance of the population significantly more than 80? Use a 0.05 level
of significance.
28. A company claims that the standard deviation in their delivery time is less than 5 days. A sample of 27
past customers is taken. The average delivery time in the sample was 14 days with a standard deviation
of 4.5 days. At a 5% level of significance, test the company's claim.
29. A sample of 22 bottles of soft drink showed a variance of 0.64 in their contents. At a 5% level of
significance, determine whether or not the standard deviation of the population is significantly
different from 0.7.
30. A random sample of 20 observations showed a standard deviation of 8. At a 5% level of significance,
test to see if the variance of the population is significantly less than 65.
31. Do the following data indicate that the variance of the population from which this sample has been
drawn is significantly more than 12? Use = 0.05.
16
12
21
10
13
18
32. A sample of ten earnings per share estimates is shown below.
2.92
4.60
4.20
3.10
3.66
7.22
2.54
1.45
2.88
3.64
Use Excel to estimate the variance with a 95% level of confidence.
33. The time it takes to complete a test was recorded for a sample of 15 students. The results follow.
25
45
50
32
38
41
41
48
30
40
39
49
46
44
36
Use Excel to estimate the variance with a 90% level of confidence.
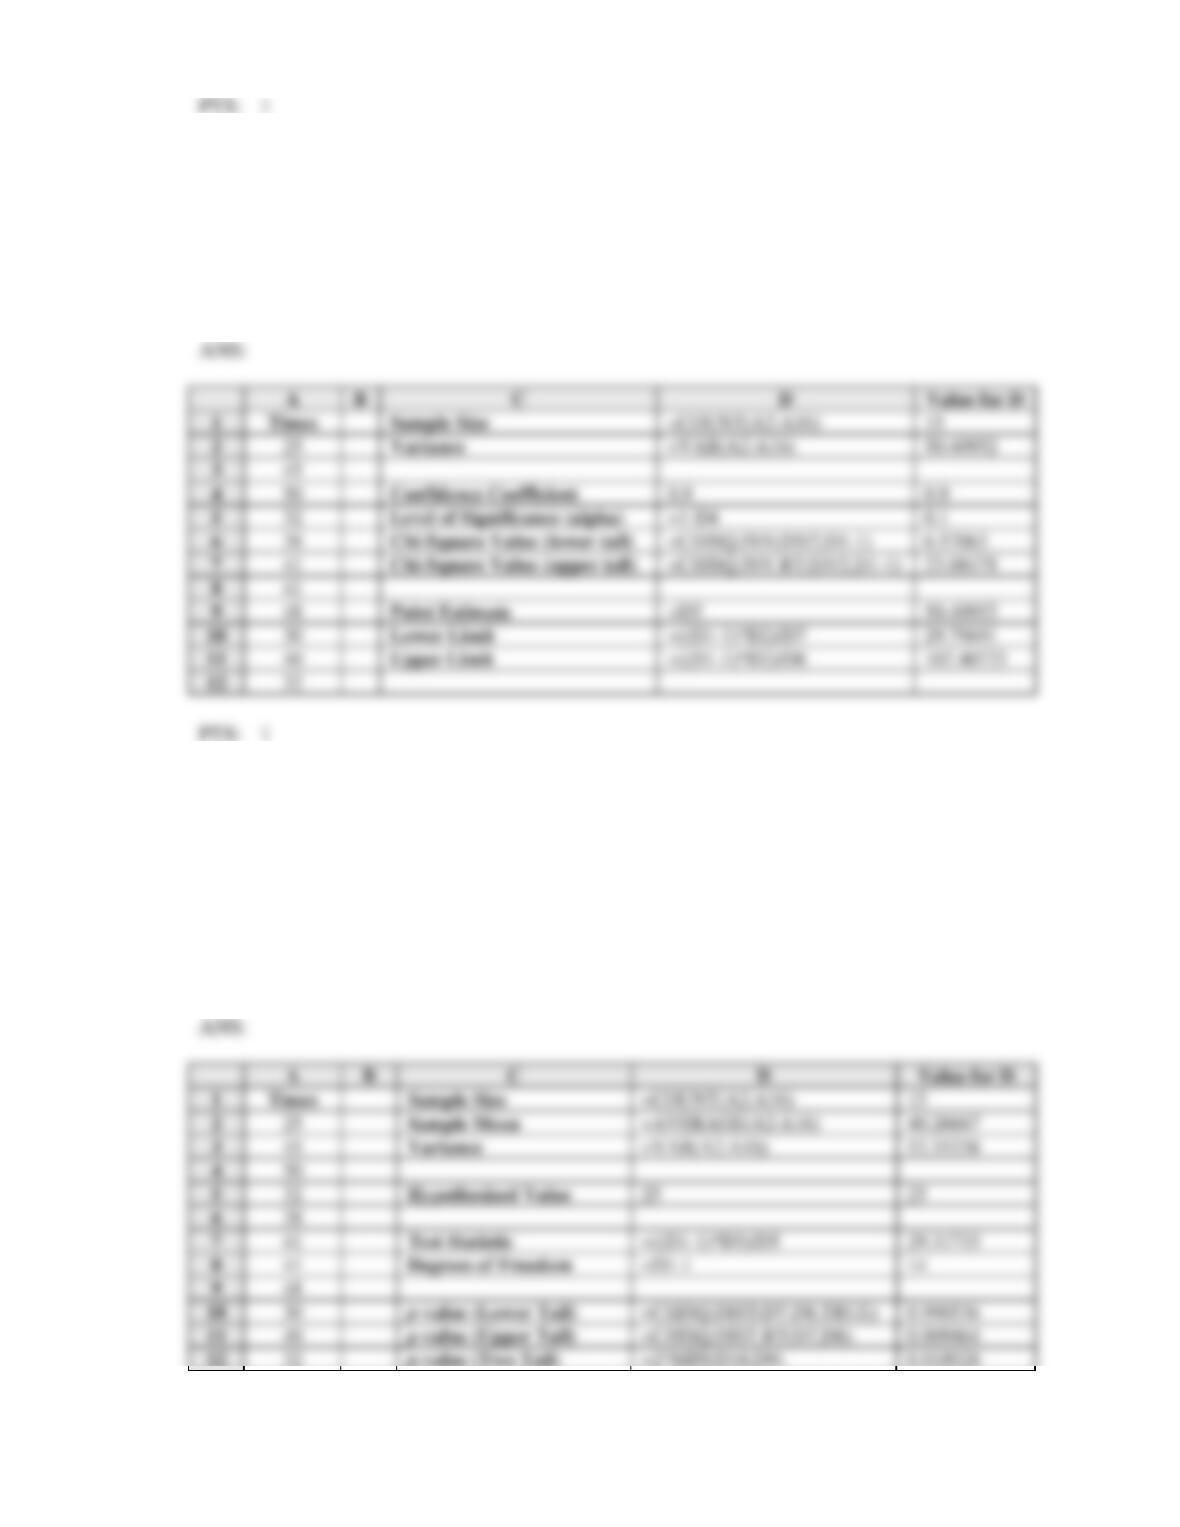
34. A professor believes the variability in time to complete tests has increased. In the past, the variance in
minutes to complete a particular test was 25. The time it takes to complete a test was recorded for a
sample of 15 students. The results follow.
25
45
50
32
38
41
41
48
30
40
39
49
46
44
36
Use Excel to determine if the variance in times has increased. Use a .02 level of significance.
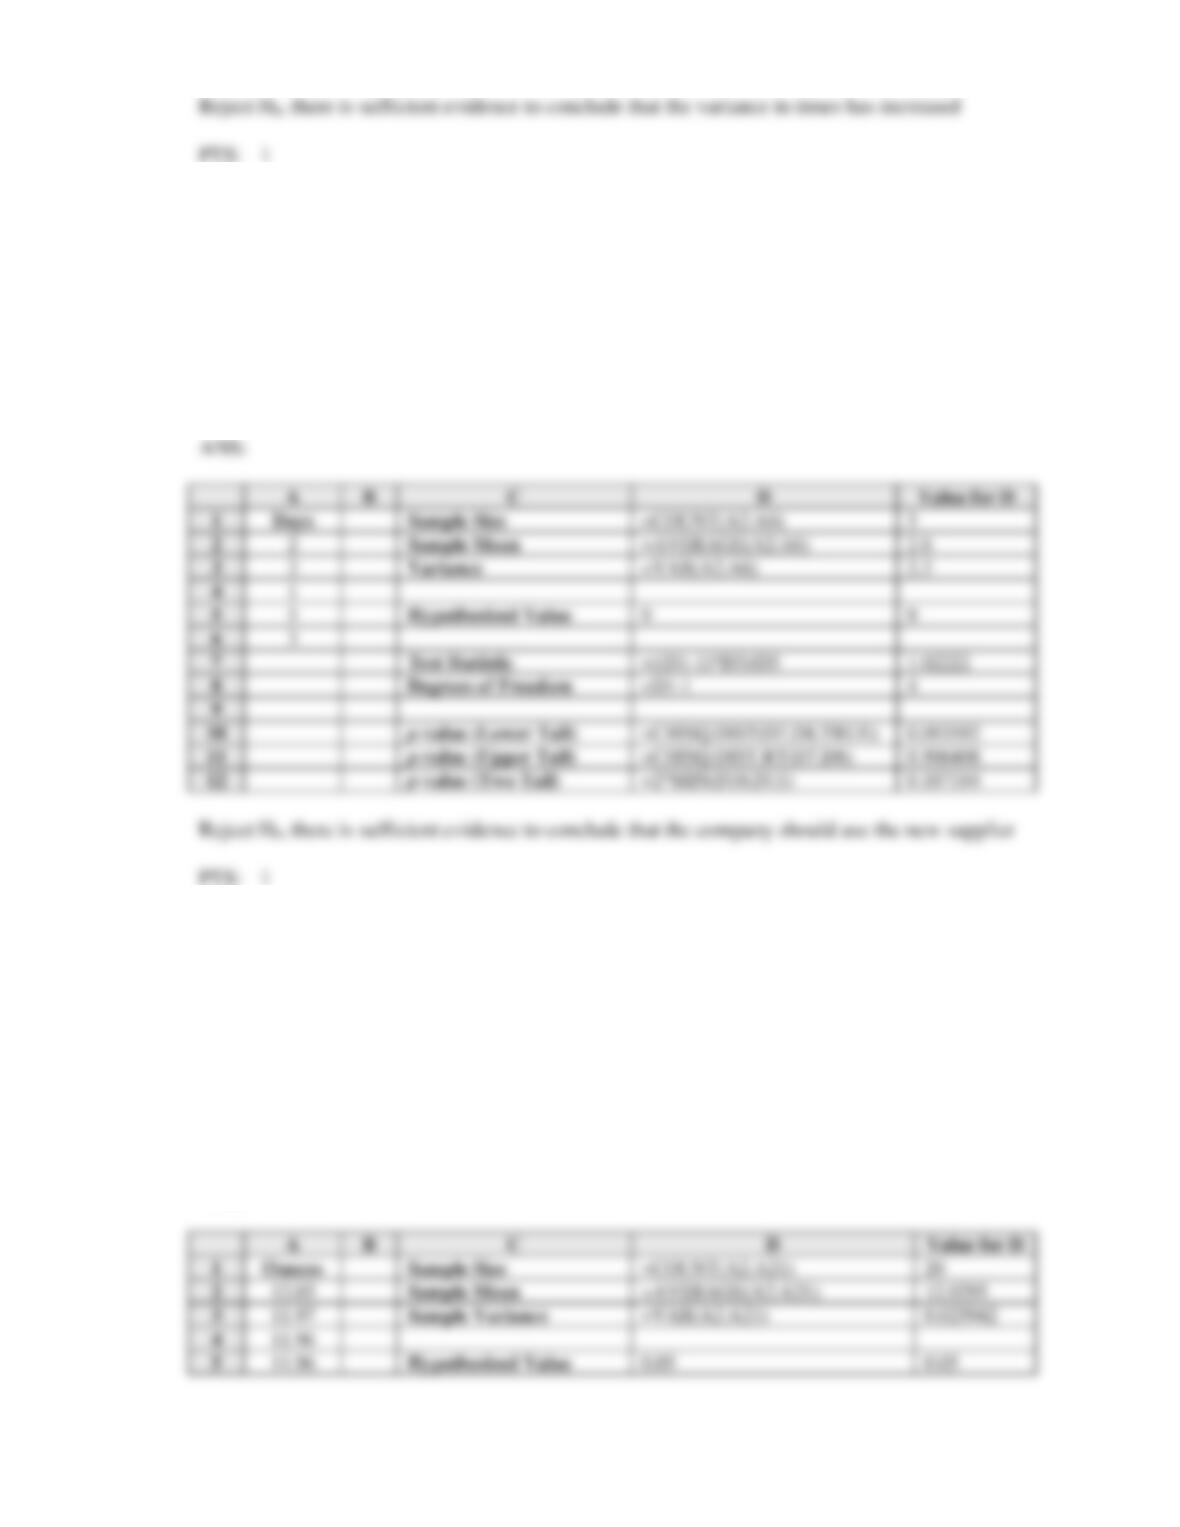
35. A manufacturing company is considering changing suppliers of a particular raw material. The standard
deviation of days until delivery for the current supplier is 3. A sample of 5 delivery times is taken from
the new supplier. The data follow:
2
2
1
5
3
The manufacturing company will use the new supplier if the variance in delivery time is less than that
of the current supplier. Use Excel to determine whether the company should use the new supplier? Use
a 10% level of significance.
36. The specifications for the filling of soft drink bottles is a variance of 0.05 (ounces)2. A sample of 20
bottles of soft drink showed the following results.
12.03
12.01
11.89
12.15
12.23
11.97
12.10
11.85
12.33
12.02
11.96
12.00
11.82
12.02
11.99
11.96
11.83
11.84
12.21
12.38
At a 5% level of significance, use Excel to determine whether or not the variance of the population is
significantly different from 0.05.
ANS:
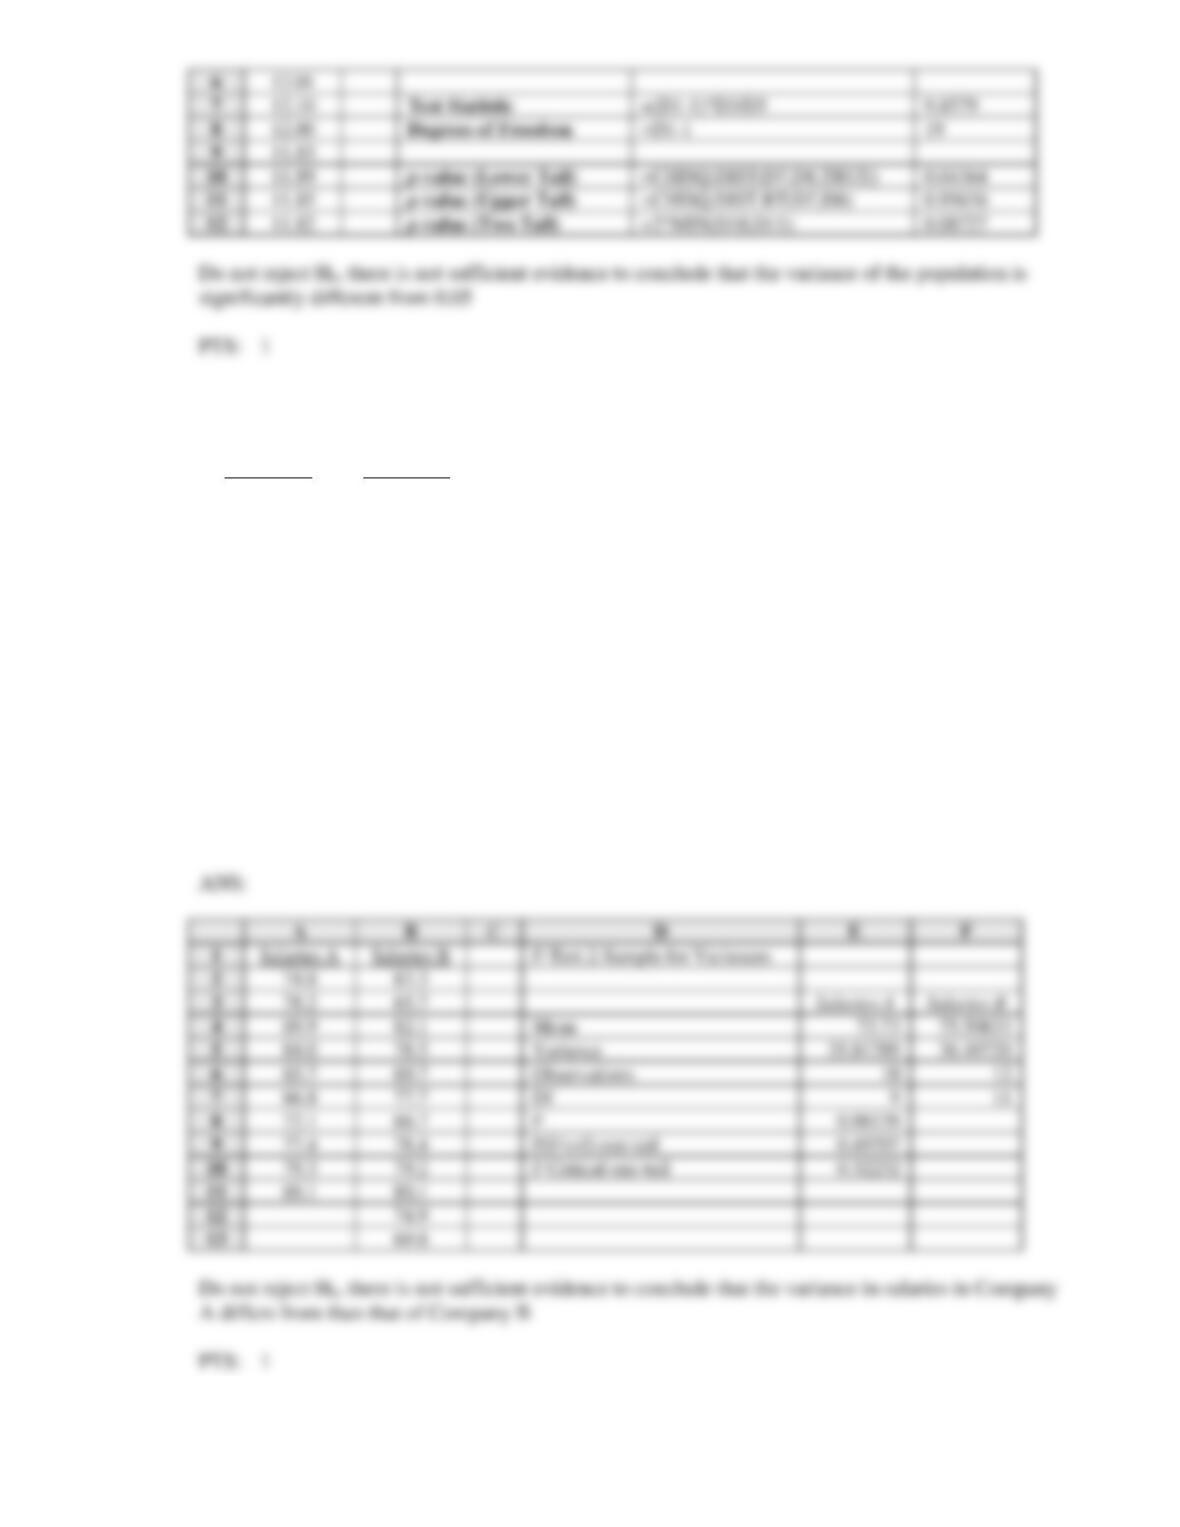
37. The data below shows samples of annual salaries (in thousands of dollars) for accountants in two
different firms.
Salaries A
Salaries B
74.8
83.3
78.2
65.7
69.9
82.1
84
78.5
65.7
69.7
66.8
77.7
72.1
66.7
77.4
78.4
79.3
79.2
69.1
80.1
74.9
69.8
Use Excel to determine whether the variance in salaries in Company A differs from than that of
Company B? Use a .10 level of significance.
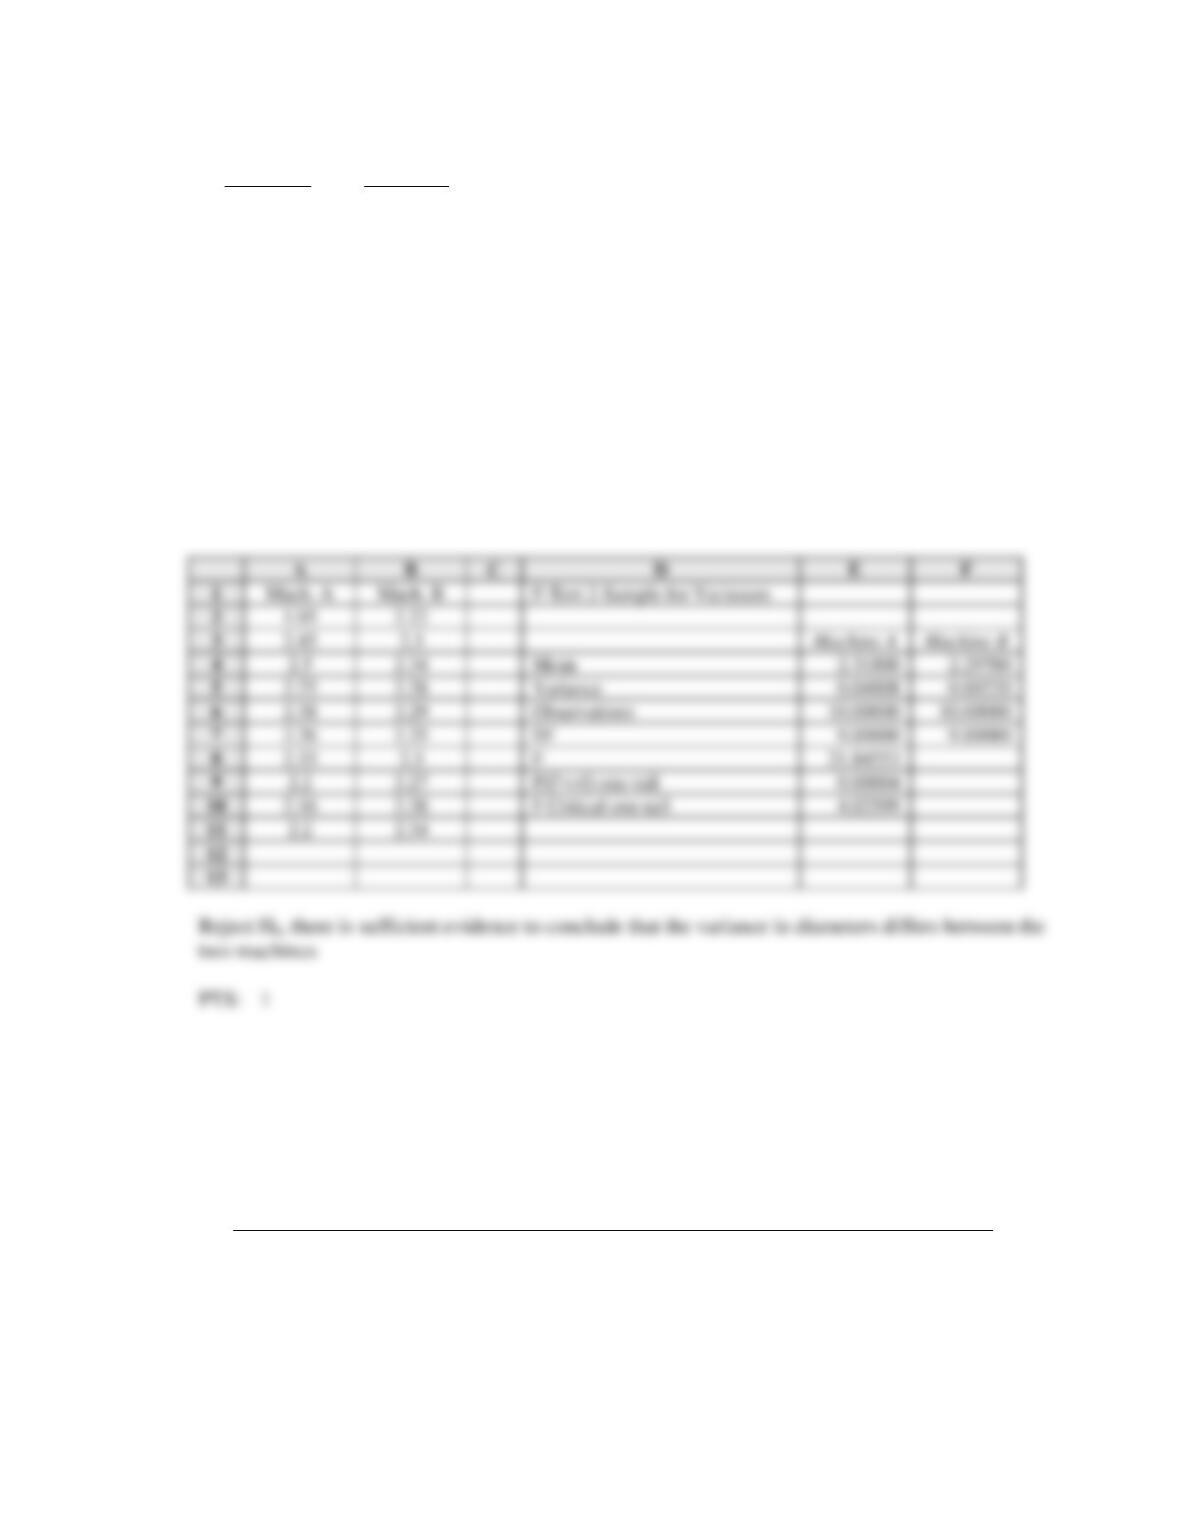
38. In a manufacturing production process, two machines are being compared. The data below shows the
diameters, measured in millimeters, of a sample of ball bearings produced by each machine.
Machine A
Machine B
1.95
2.22
2.45
2.30
2.50
2.34
2.75
2.28
2.38
2.29
2.26
2.25
2.33
2.30
2.20
2.27
2.16
2.38
2.20
2.34
Use Excel to determine whether the variance in diameters differs between the two machines? Use a .05
level of significance.
ANS:
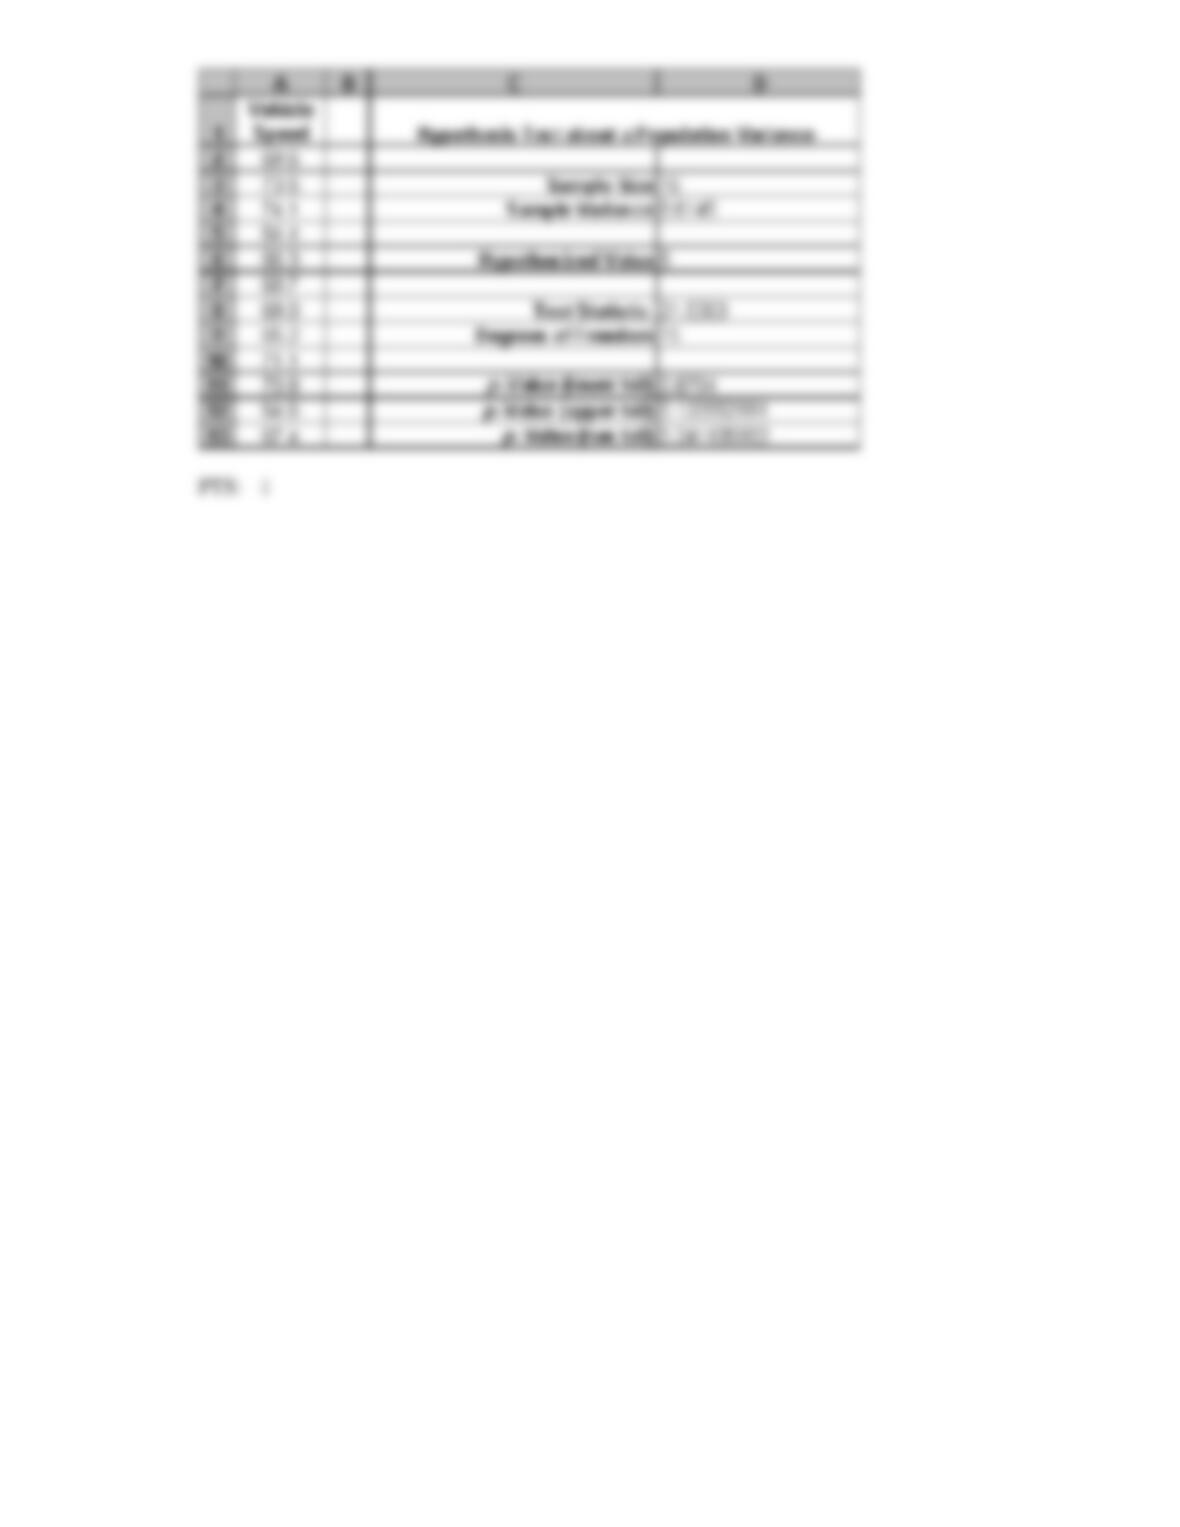
39. The State Highway Patrol (SHP) periodically samples vehicle speeds at Milepost 92 on Interstate 17.
The SHP is concerned about the dispersion of speeds of vehicles sharing the same highway because
significant difference in speed is a known cause of accidents. The speeds of a random sample of 16
vehicles are shown below.
Vehicle
1
2
3
4
5
6
7
8
Speed
69.6
73.5
74.1
64.4
66.3
68.7
69.0
65.2
Vehicle
9
10
11
12
13
14
15
16
Speed
71.1
70.8
64.6
67.4
69.9
66.3
68.3
70.6
a. Develop a 90% confidence interval estimate of the population variance (i.e., the speed variance of
vehicles at Milepost 92 on Interstate 17).
b. Develop a 90% confidence interval estimate of the population standard deviation.
40. The State Highway Patrol (SHP) periodically samples vehicle speeds at Milepost 92 on Interstate 17.
The SHP is concerned about the dispersion of speeds of vehicles sharing the same highway because
significant difference in speed is a known cause of accidents. The speeds of a random sample of 16
vehicles are shown below.
Vehicle
1
2
3
4
5
6
7
8
Speed
69.6
73.5
74.1
64.4
66.3
68.7
69.0
65.2
Vehicle
9
10
11
12
13
14
15
16
Speed
71.1
70.8
64.6
67.4
69.9
66.3
68.3
70.6
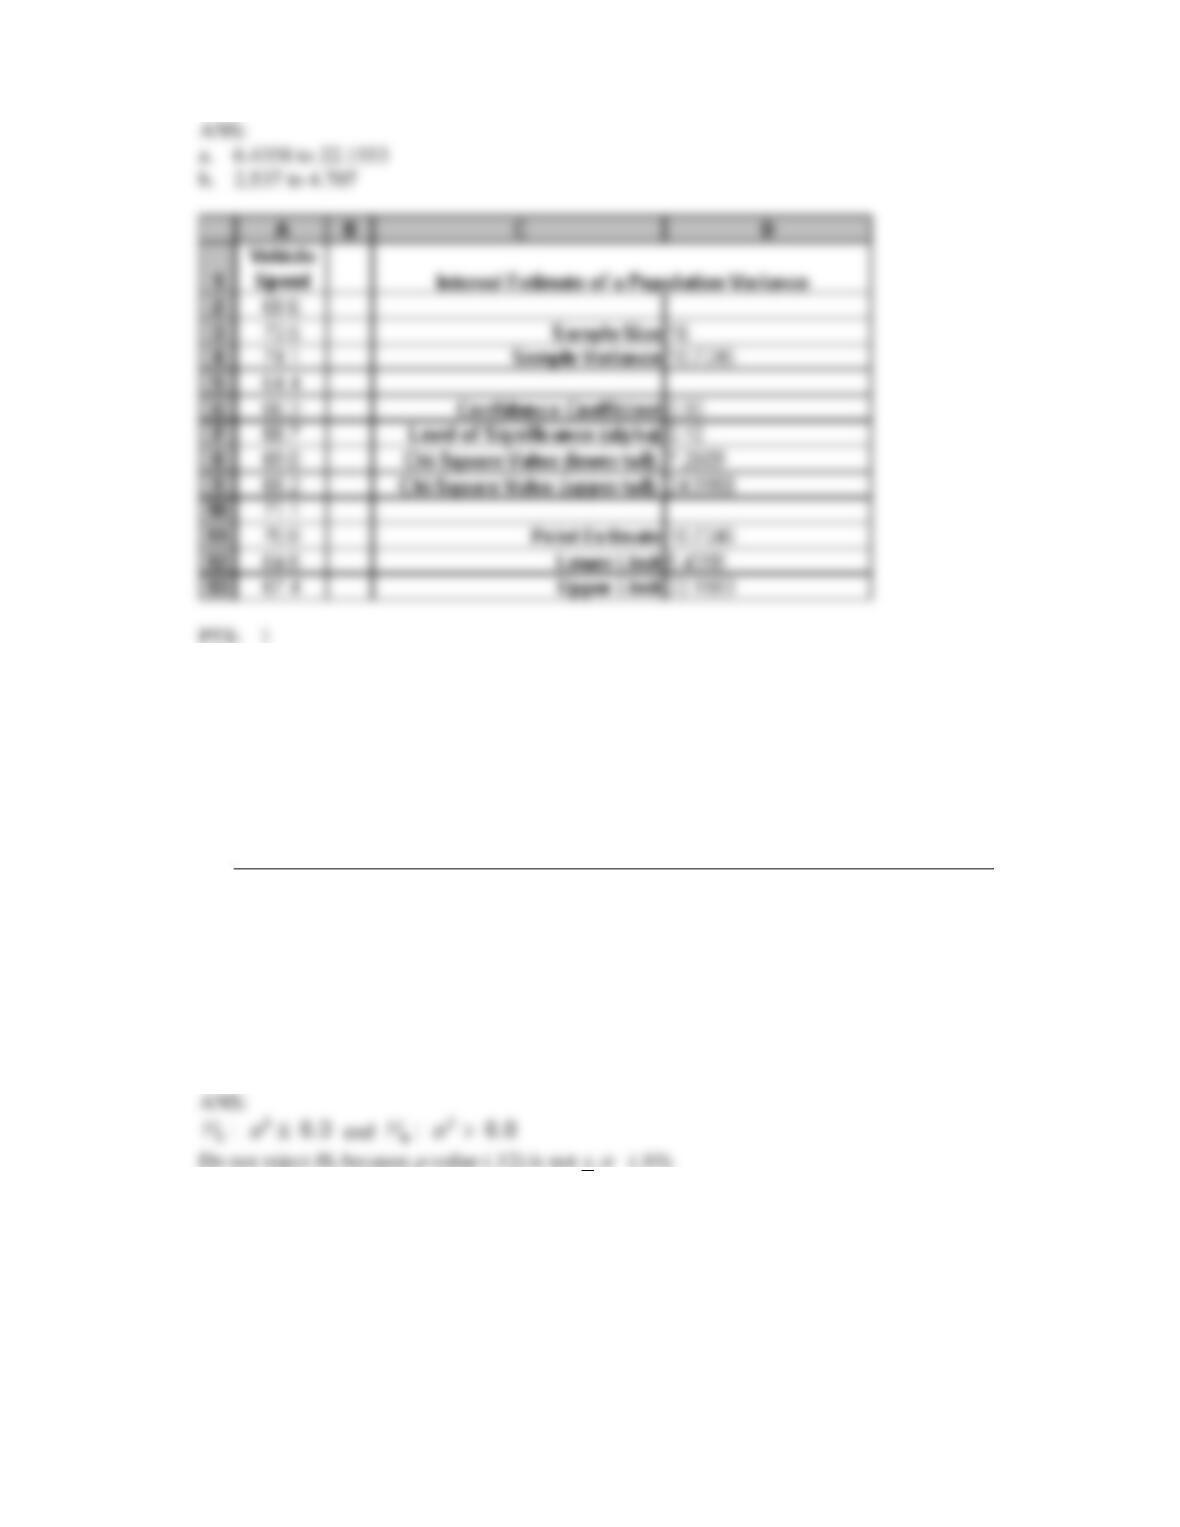
The SHP’s policy is to position a patrol car at Milepost 92 on Interstate 17 if the vehicle speed
variance at that location is believed to be greater than 6 miles per hour. Conduct a hypothesis test
(with a = .10) to determine whether the speed variance for all vehicles passing Milepost 92 exceeds 6
mph.