
If the assumption can be made that the populations all have the same shape, the
Kruskal-Wallis test becomes
a. a test of the skewness of the k populations
b. a test of the variances of the k populations
c. a test of the medians of the k populations
d. a test of the means of the k populations
Fast ‘˜n Clean operates 12 laundromats on the east side of the city. All of Fast ‘˜n Clean’s
clothes dryers have a label stating ‘œ20 minutes for $1.00.’ You question the accuracy of
the dryers’ clocks and decide to conduct an observational study. You randomly select 36
dryers in several different Fast ‘˜n Clean locations, put $1.00 in each and time the
drying cycle. The sample mean drying time is 20 minutes and 25 seconds. The
manufacturer of the dryer states that the standard deviation for 20-minute drying cycles
is 1 minute.
a. Using the sample data and
= .05, test the validity of the label on the dryers. Apply
the p-value and critical value approaches to conducting the two-tail hypothesis test.
b. Conduct the same two-tail hypothesis test, but this time use the confidence interval
approach to hypothesis testing.

Exhibit 6-1
Consider the continuous random variable x, which has a uniform distribution over the
interval from 20 to 28.
Refer to Exhibit 6-1. The probability that x will take on a value between 21 and 25 is
a. 0.125
b. 0.250
c. 0.500
d. 1.000
The first quartile
a. contains at least one third of the data elements
b. is the same as the 25th percentile
c. is the same as the 50th percentile
d. is the same as the 75th percentile
Producer’s risk is
a. the same as the consumer’s risk
b. a Type II error
c. a Type I error
d. None of the other answers is correct.

Exhibit 12-4
In the past, 35% of the students at ABC University were in the Business College, 35%
of the students were in the Liberal Arts College, and 30% of the students were in the
Education College. To see whether or not the proportions have changed, a sample of
300 students was taken. Ninety of the sample students are in the Business College, 120
are in the Liberal Arts College, and 90 are in the Education College.
Refer to Exhibit 12-4. The hypothesis is to be tested at the 5% level of significance. The
critical value from the table equals
a. 1.645
b. 19.6
c. 5.99
d. 7.80
Provide a five-number summary for the follow data.

In regression analysis, the response variable is the
a. independent variable
b. dependent variable
c. slope of the regression function
d. intercept
The use of the normal probability distribution as an approximation of the sampling
distribution of is based on the condition that both np and n(1 ‘“ p) equal or exceed
a. .05
b. 5
c. 10
d. 30
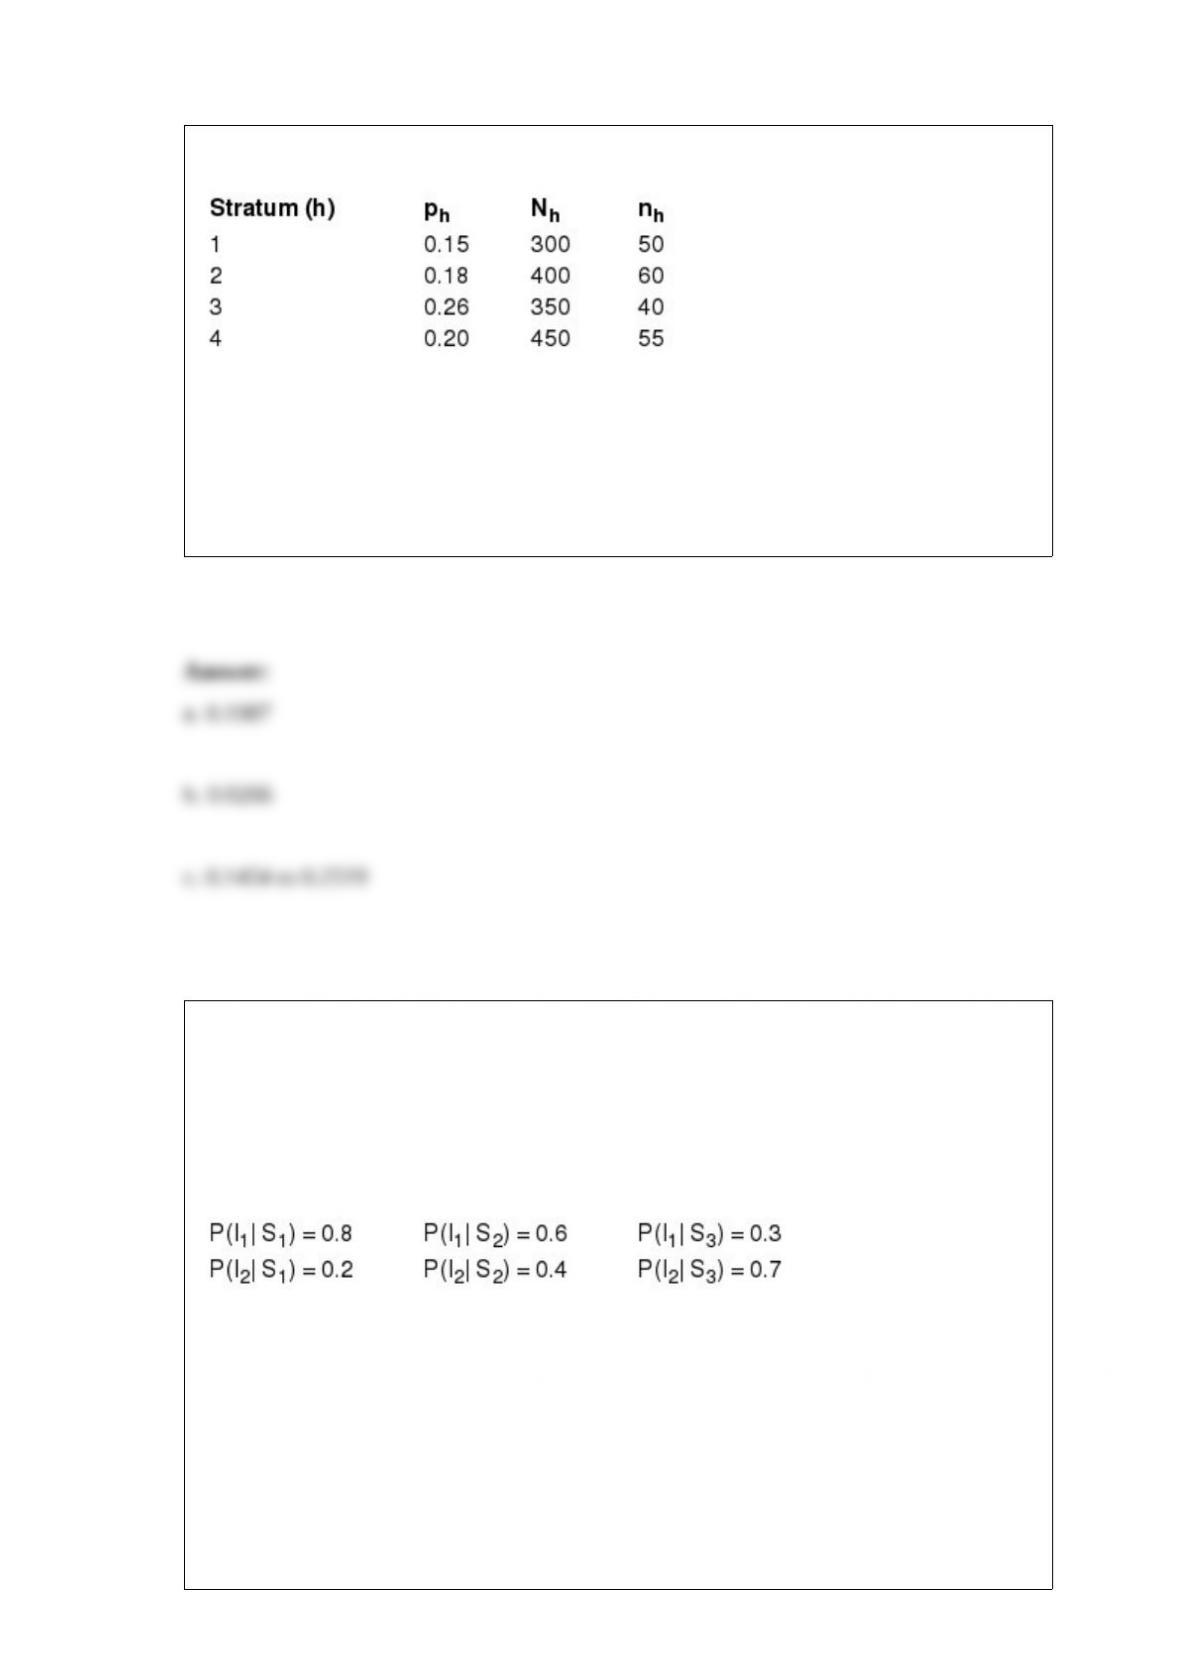
The following are the results of a stratified random sample.
a. Determine the point estimator of the population proportion.
b. Estimate the standard error of the population proportion.
c. Develop an approximate 95% confidence interval for the population proportion.
Shannon Lipscomb & Associates (SLA) are producers of a new brand of personal
computers. SLA is considering employing a market research firm to supply indicator
information related to the demand for their computers. The information would consist
of forecasts of light demand (I1) or heavy demand (I2) for SLA’s computers. The
following conditional probabilities reflect the accuracy of the market research firm’s
forecasts:
a. Compute the posterior probabilities.
b. What decision should be taken if the market research firm forecasts light demand
(I1)? Heavy demand (I2)?
c. Calculate the expected value of sample information.
d. Compute the expected value of perfect information.

A regression was performed on a sample of 16 observations. The estimated equation is
= 23.5 – 14.28x1 + 6.72x2 + 15.68x3. The standard errors for the coefficients are Sb1 =
4.2, Sb2 = 5.6, and Sb3 = 2.8. For this model, SST = 3809.6 and SSR = 3285.4.
a. Compute the appropriate t ratios.
b. Test for the significance of 1, 2, and 3 at the 5% level of significance.
c. Do you think that any of the variables should be dropped from the model? Explain.
d. Compute R2 and Ra
2. Interpret R2.
e. Test the significance of the relationship among the variables at the 5% level of
significance.
In a standard normal distribution, the range of values of z is from
a. minus infinity to infinity
b. -1 to 1
c. 0 to 1
d. -3.09 to 3.09
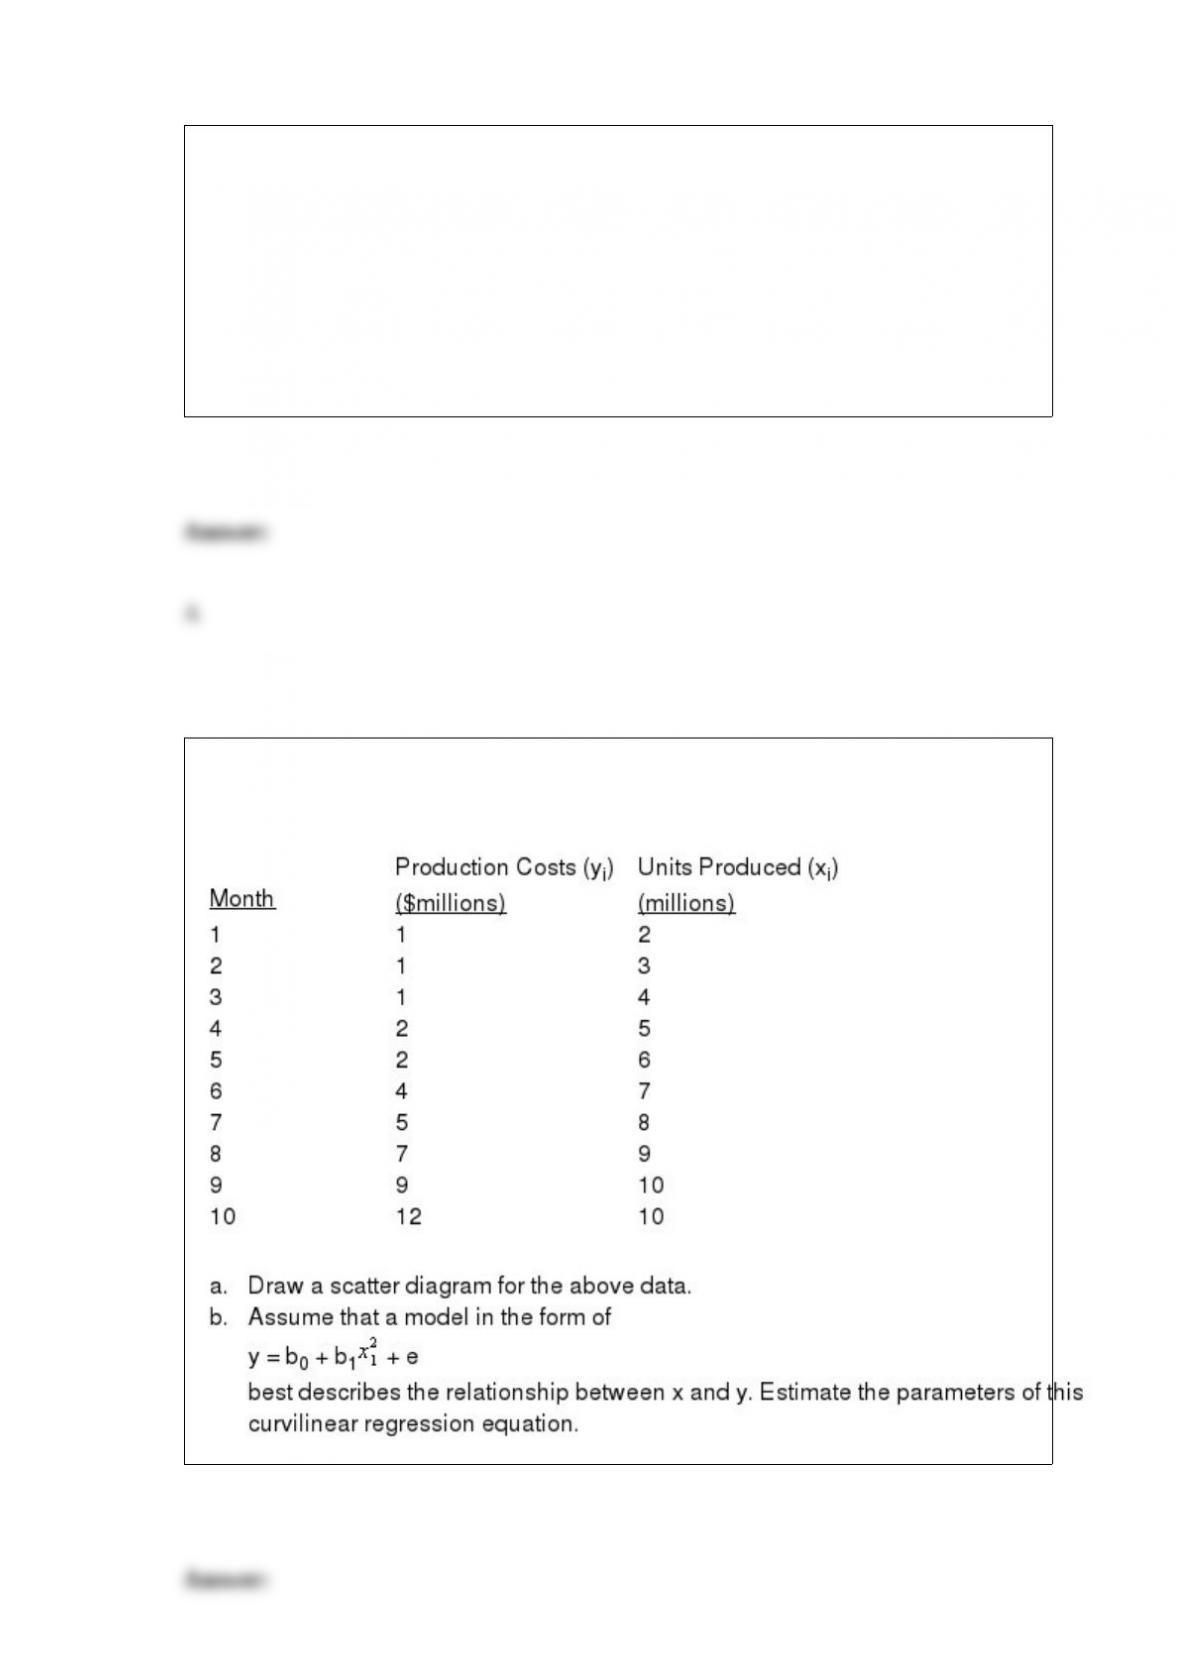
Monthly total production costs and the number of units produced at a local company
over a period of 10 months are shown below.

Exhibit 6-4
The starting salaries of individuals with an MBA degree are normally distributed with a
mean of $40,000 and a standard deviation of $5,000.
Refer to Exhibit 6-4. What is the probability that a randomly selected individual with an
MBA degree will get a starting salary of at least $30,000?
a. 0.4772
b. 0.9772
c. 0.0228
d. 0.5000

Exhibit 12-2
Last school year, the student body of a local university consisted of 30% freshmen, 24%
sophomores, 26% juniors, and 20% seniors. A sample of 300 students taken from this
year’s student body showed the following number of students in each classification.
We are interested in determining whether or not there has been a significant change in
the classifications between the last school year and this school year.
Refer to Exhibit 12-2. The expected number of freshmen is
a. 83
b. 90
c. 30
d. 10