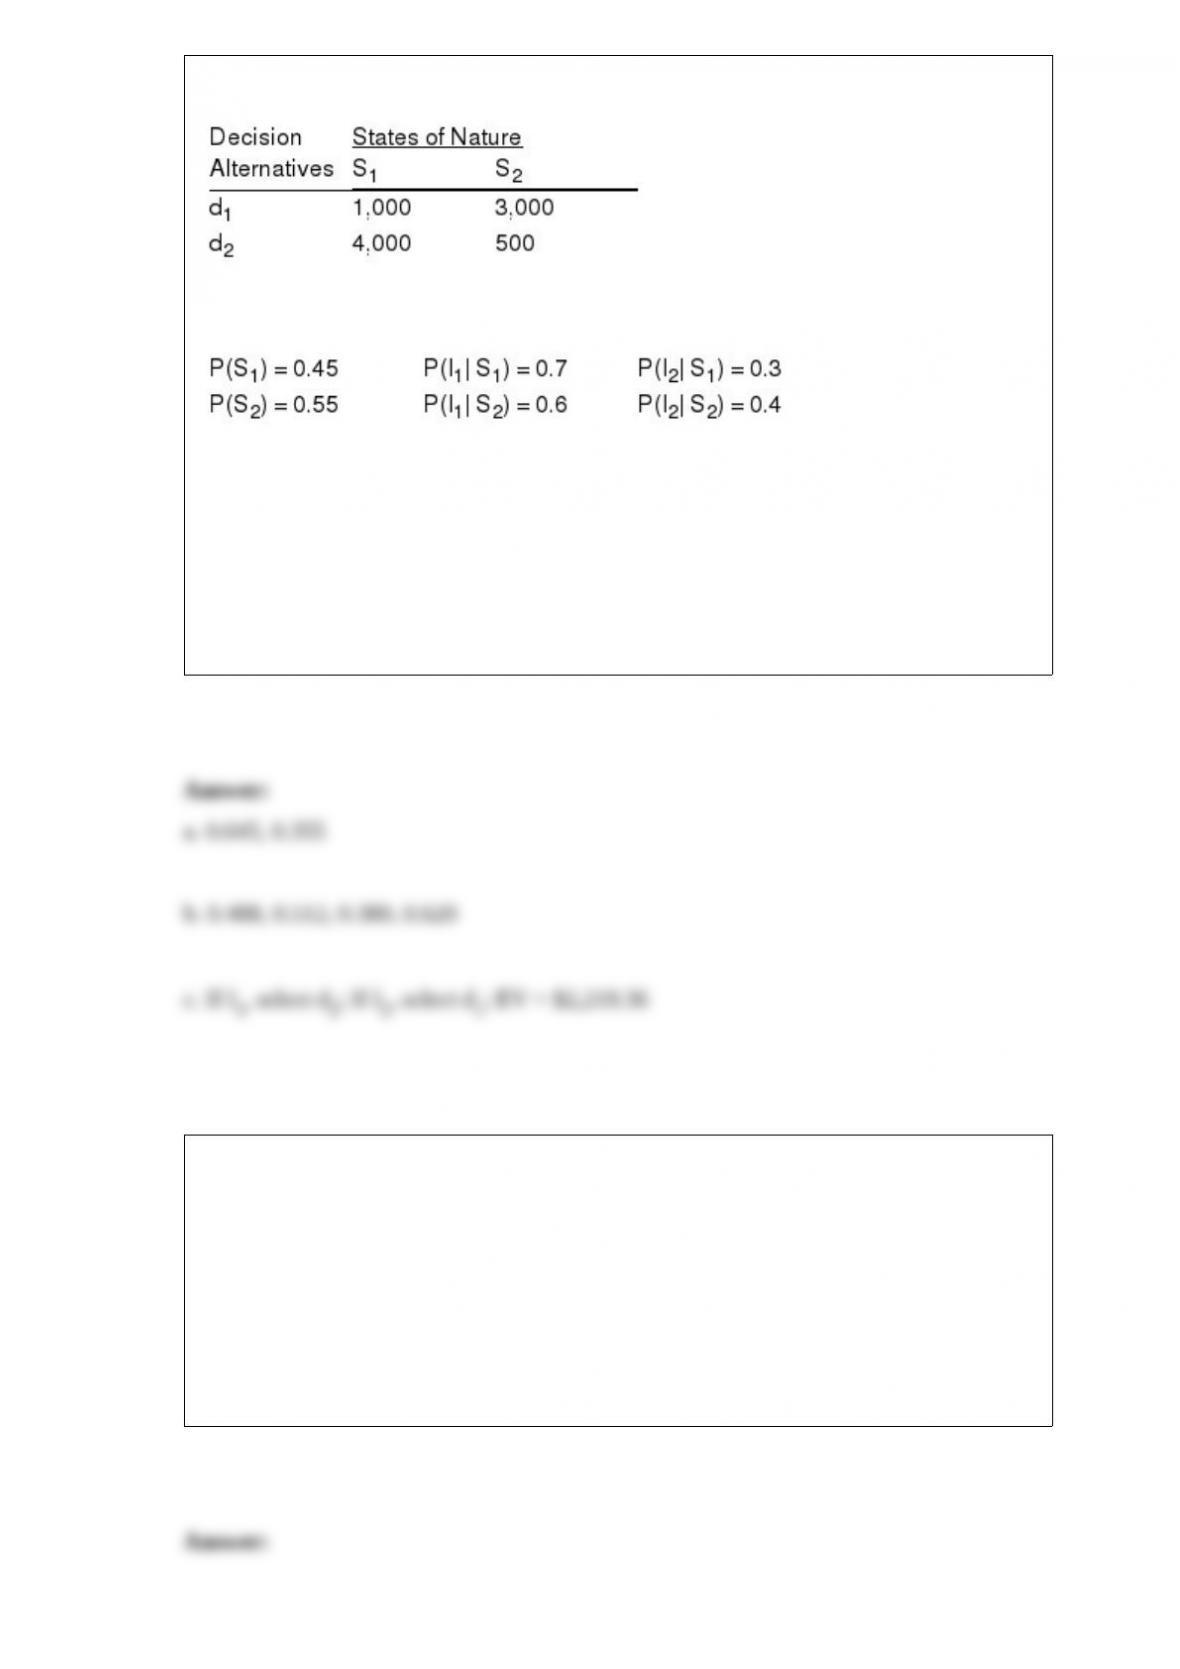
You are given the following payoff table:
Assume the following probability information is given:
a. Find the values of P(I1) and P(I2).
b. Determine the values of P(S1 | I1), P(S2 | I1), P(S1 | I2), and P(S2 | I2).
c. Use the decision tree approach and determine the optimal strategy. What is the
expected value of your solution?
Categorical data
a. indicate either how much or how many
b. cannot be numeric
c. are labels used to identify attributes of elements
d. must be nonnumeric
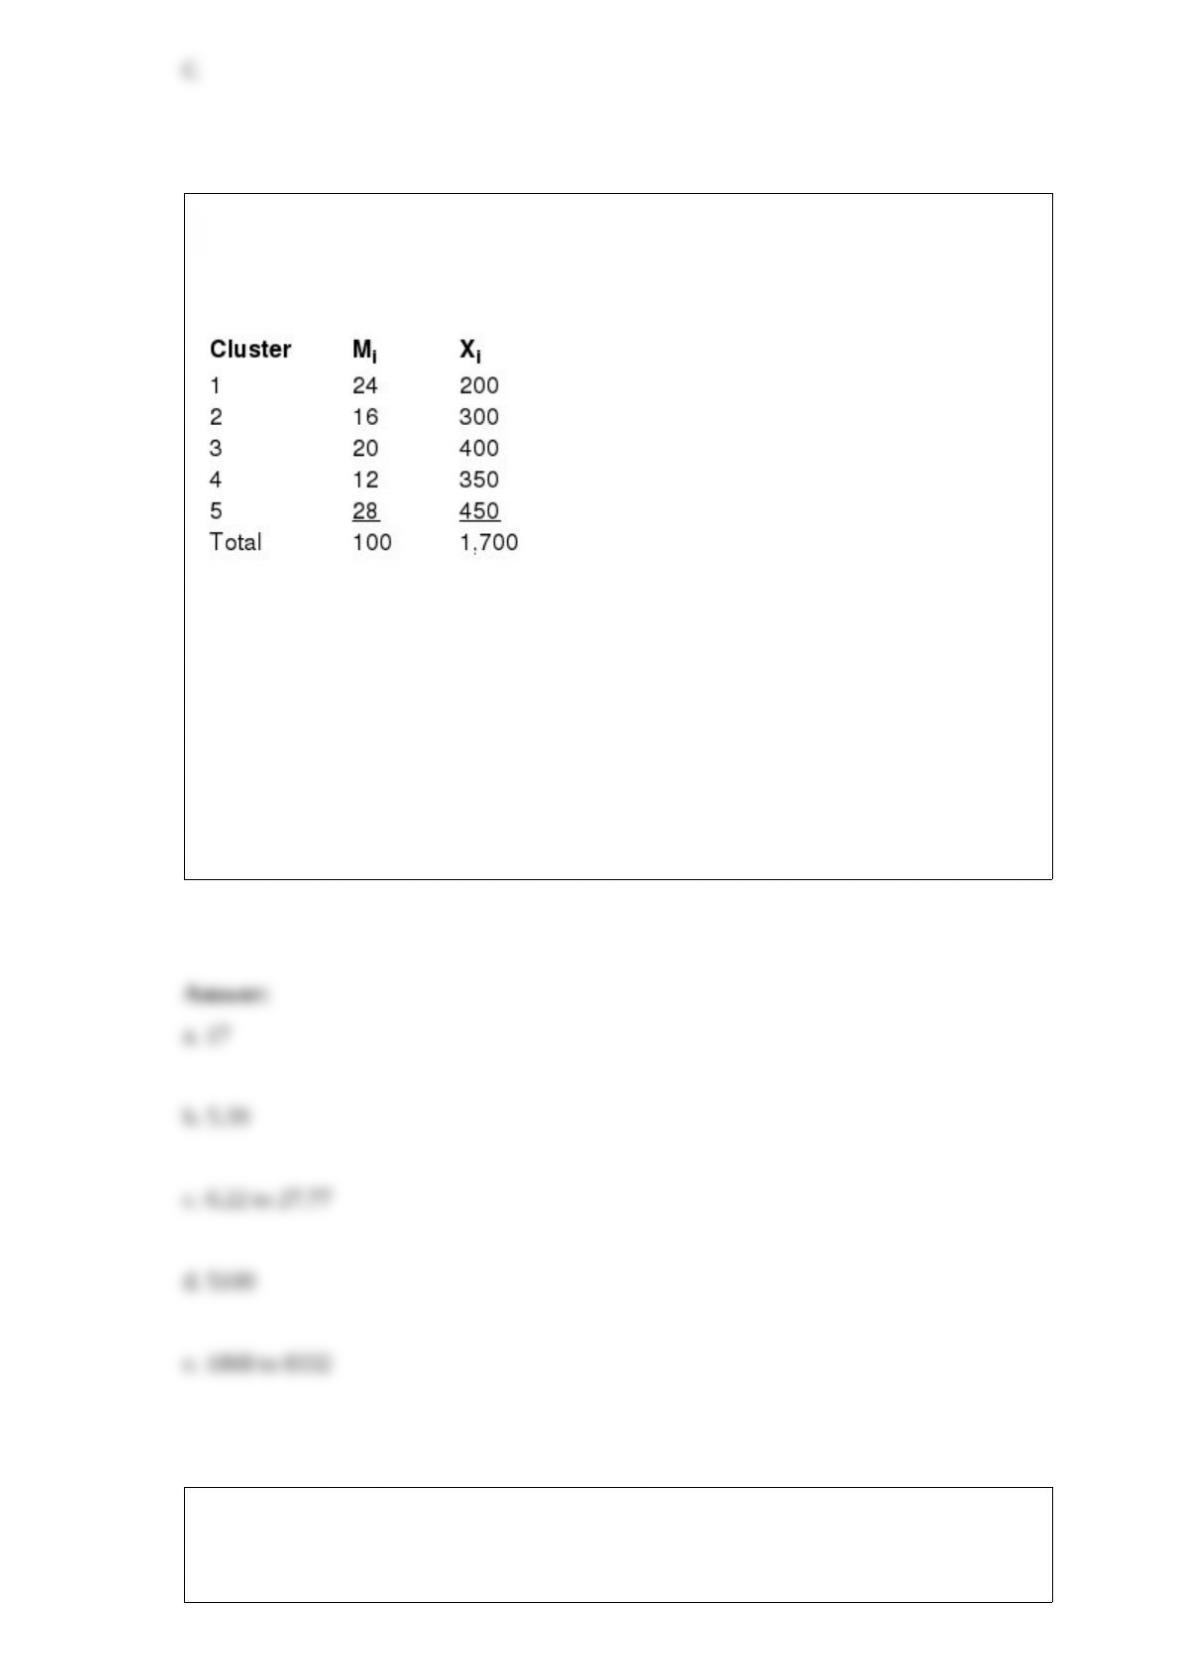
A sample of 5 clusters is to be taken from a population with N = 30 clusters and M =
300 elements in the population. The values of Mi and Xi for each cluster are shown
below.
a. Determine the point estimate of the population mean.
b. Determine the standard error of the mean.
c. Develop a 95% confidence interval for the population mean.
d. Determine the point estimator of the population total.
e. Approximate a 95% confidence interval estimate of the population total.
Cashman Co. will be leasing a new copier and is considering four plans. The company
has determined it will make 12,600, 14,400, 16,200, 18,000, 19,800, or 21,600 copies
per month with probabilities of .05, .10, .15, .25, .25, and .20 respectively.
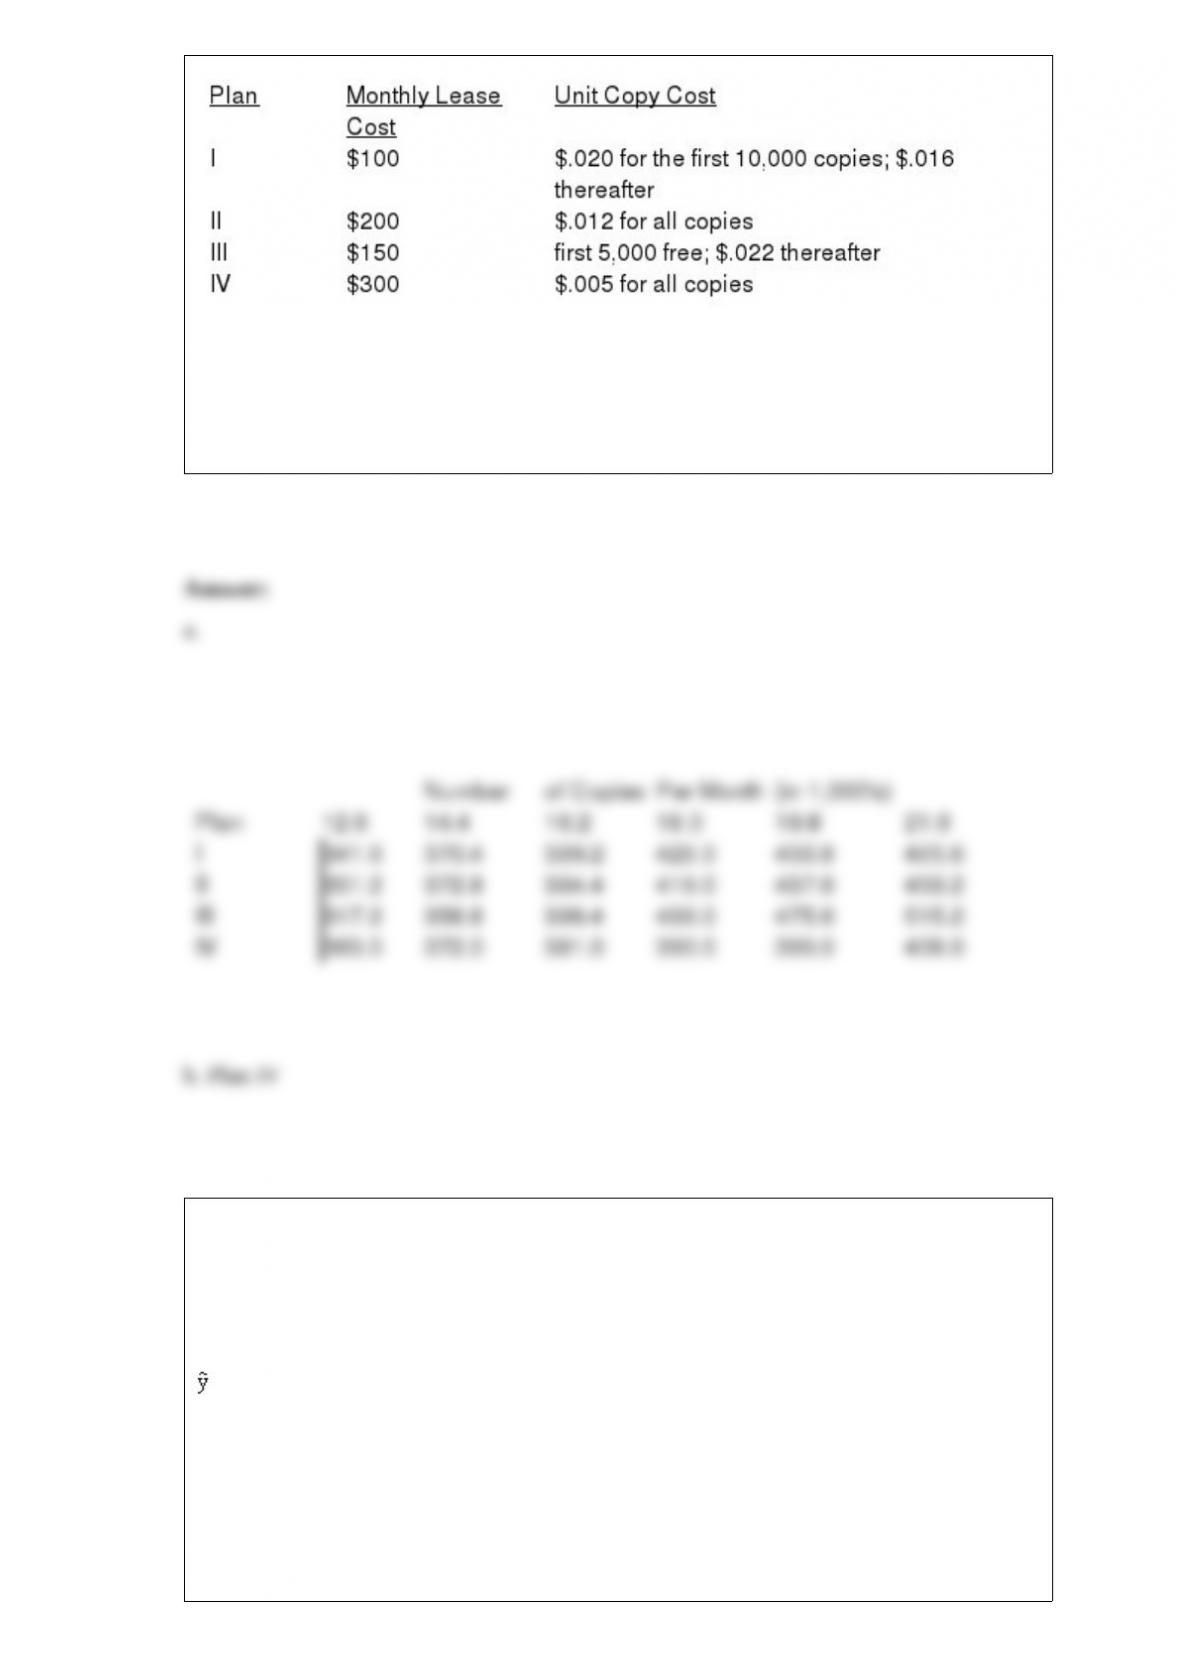
a. Construct a monthly payoff table for Cashman in terms of costs.
b. What is the optimal plan using the expected value approach? (Hint: This is a cost
minimization problem.)
Exhibit 15-8
The following estimated regression model was developed relating yearly income (y in
$1,000s) of 30 individuals with their age (x1) and their gender (x2) (0 if male and 1 if
female).
= 30 + 0.7x1 + 3x2
Also provided are SST = 1,200 and SSE = 384.
Refer to Exhibit 15-8. The yearly income of a 24-year-old male individual is
a. $13.80

b. $13,800
c. $46,800
d. $49,800
The maximum number of defective items that can be found in the sample and still lead
to acceptance of the lot is
a. the upper control limit
b. the lower control limit
c. the acceptance criterion
d. None of the other answers is correct.
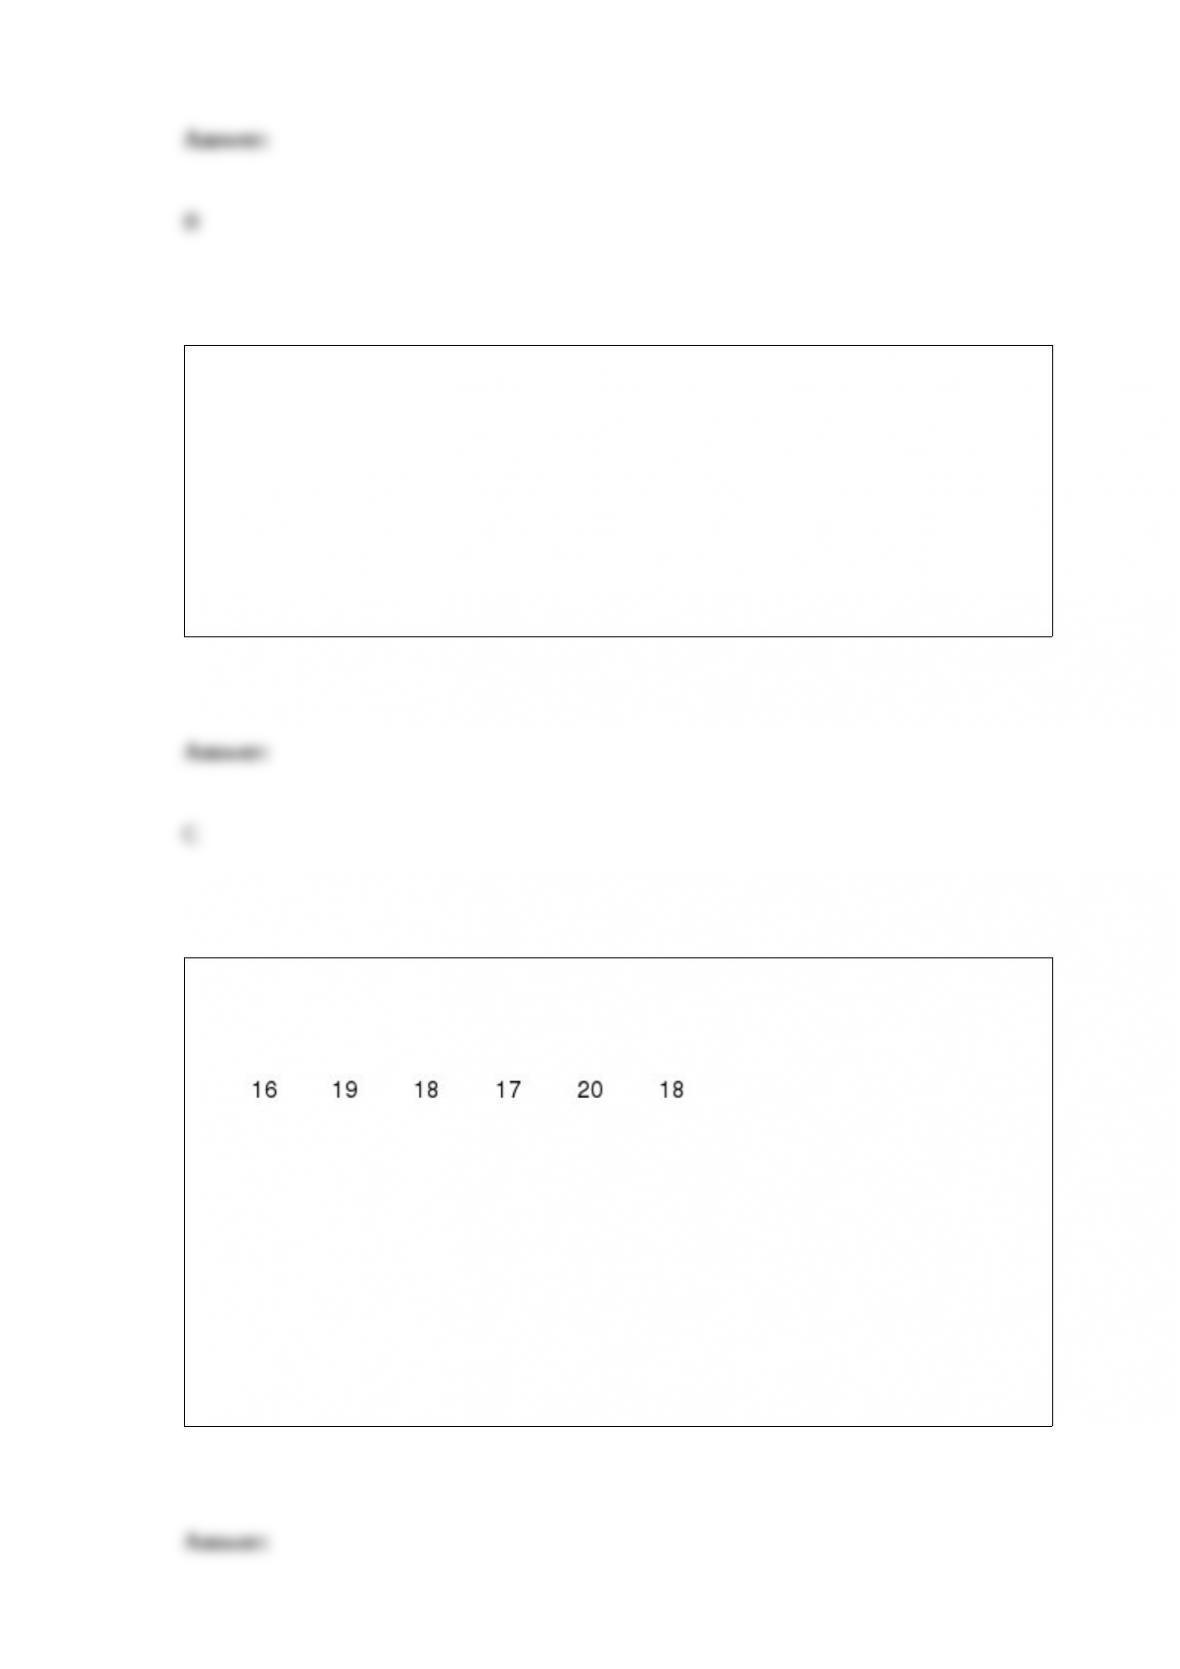
A random sample of 144 observations has a mean of 20, a median of 21, and a mode of
The population standard deviation is known to equal 4.8. The 95.44% confidence
interval for the population mean is
a. 15.2 to 24.8
b. 19.2 to 20.8
c. 19.216 to 20.784
d. 21.2 to 22.8
The multiple coefficient of determination is
a. MSR/MST
b. MSR/MSE
c. SSR/SST
d. SSE/SSR
Exhibit 7-3
The following information was collected from a simple random sample of a population.
Refer to Exhibit 7-3. The point estimate of the mean of the population is
a. 18.0
b. 19.6
c. 108
d. sixteen, since 16 is the smallest value in the sample

Which of the following is not a required assumption for the analysis of variance?
a. The random variable of interest for each population has a normal probability
distribution.
b. The variance associated with the random variable must be the same for each
population.
c. At least 2 populations are under consideration.
d. Populations have equal means.
Ordinary arithmetic operations are meaningful
a. only with categorical data
b. only with quantitative data
c. either with quantitative or categorical data
d. with rank data
The assembly time for a product is uniformly distributed between 6 to 10 minutes. The
probability of assembling the product in 7 minutes or more is
a. 0.25
b. 0.75

c. zero
d. 1
The 9-month salaries at a daycare center are normally distributed with a mean of
$19,000 and a standard deviation of $4,000.
a. What is the probability that an employee will have a salary between $12,520 and
$13,480?
b. What is the probability that an employee will have a salary more than $11,880?
c. What is the probability that an employee will have a salary less than $28,440?
In a post office, the mailboxes are numbered from 1 to 5,000. These numbers represent
a. categorical data
b. time series data
c. either categorical or quantitative data
d. quantitative data
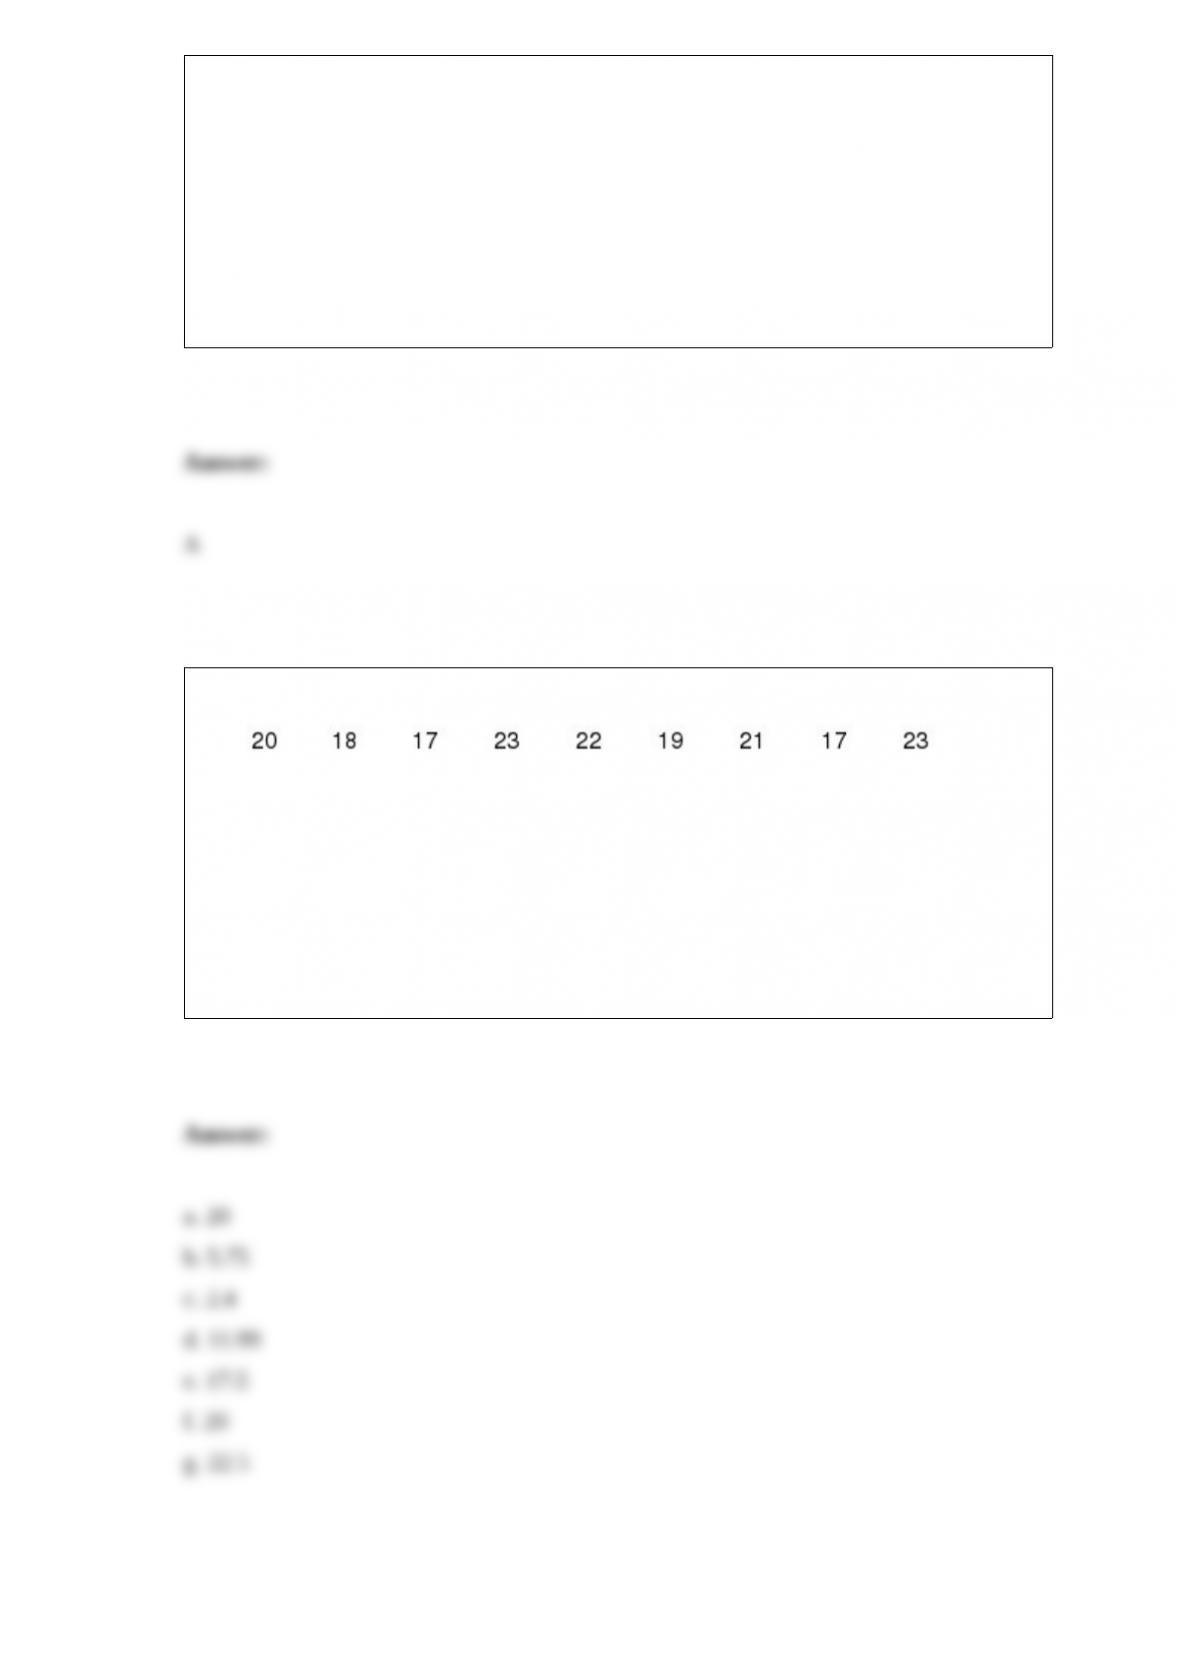
For the following data
Compute the following measures:
a. The mean
b. The variance
c. The standard deviation
d. The coefficient of variation
e. The 25th percentile
f. The median
g. The 75th percentile
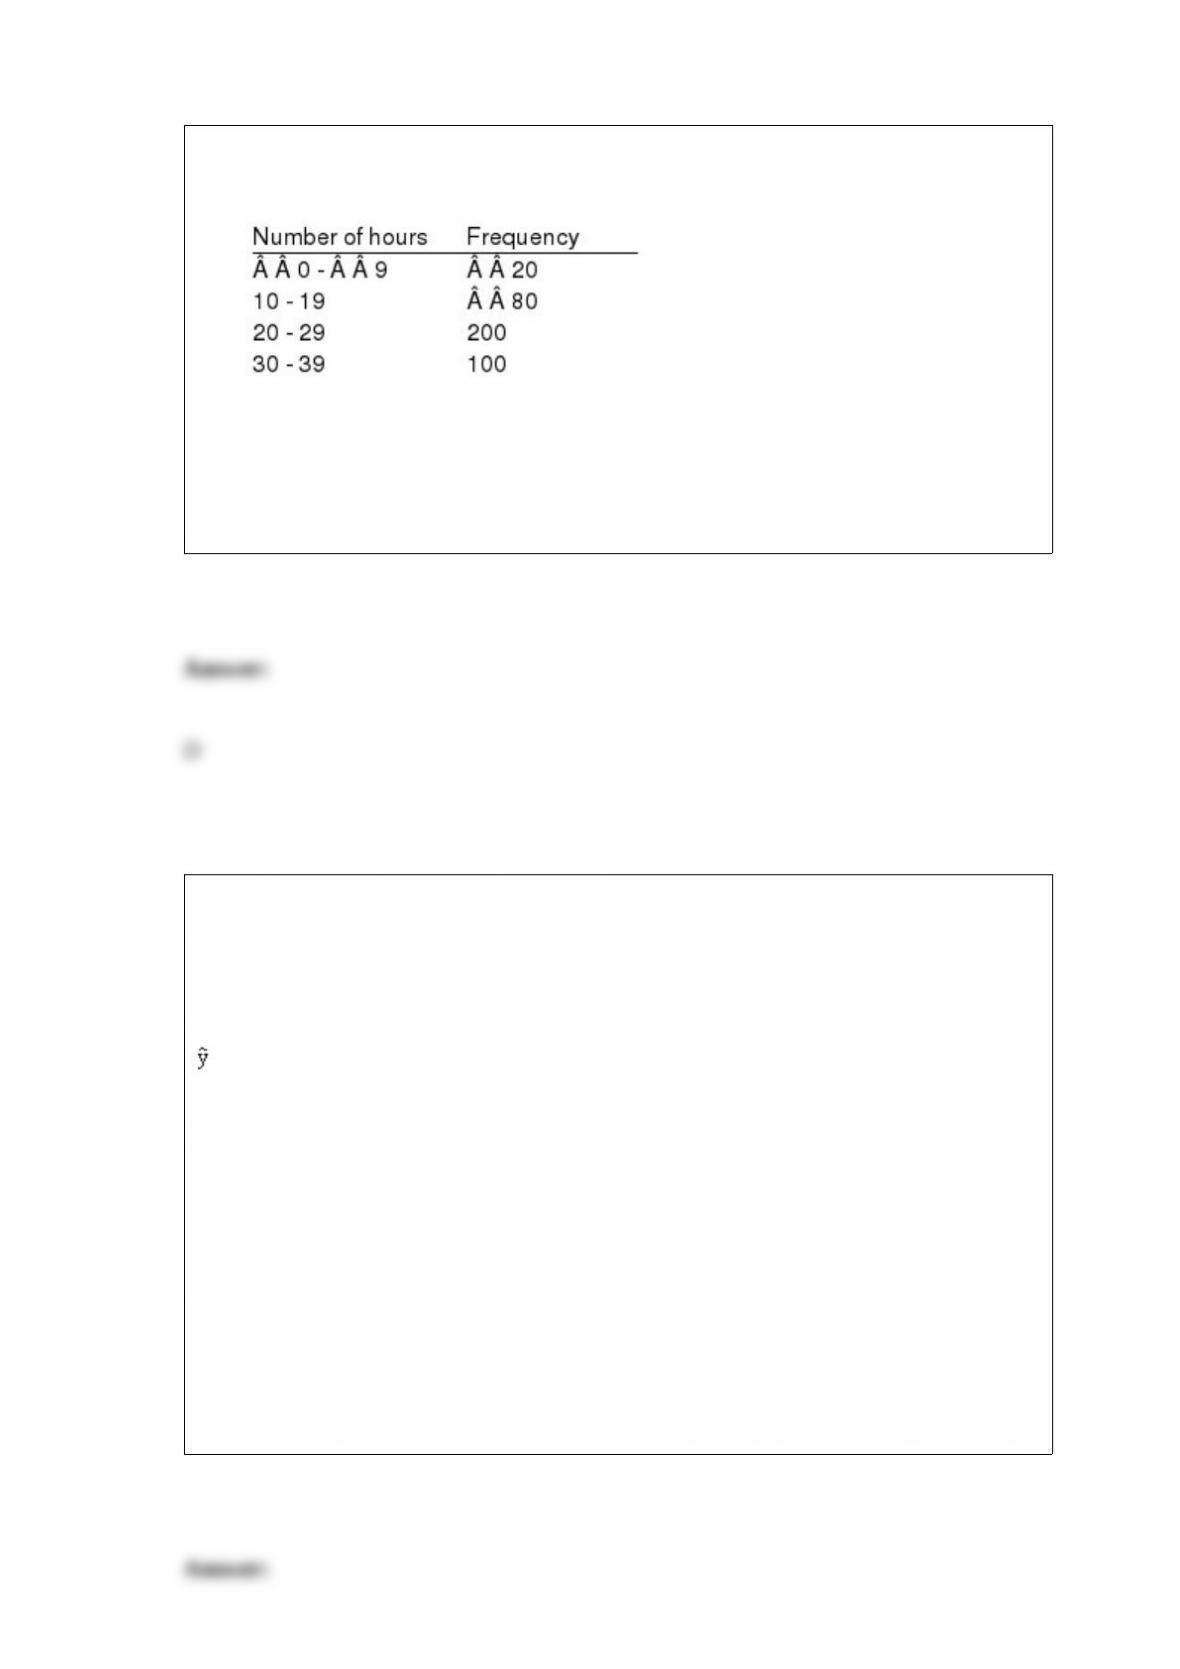
Exhibit 2-1
The numbers of hours worked (per week) by 400 statistics students are shown below.
Refer to Exhibit 2-1. The midpoint of the last class is
a. 50
b. 34
c. 35
d. 34.5
Exhibit 15-8
The following estimated regression model was developed relating yearly income (y in
$1,000s) of 30 individuals with their age (x1) and their gender (x2) (0 if male and 1 if
female).
= 30 + 0.7x1 + 3x2
Also provided are SST = 1,200 and SSE = 384.
Refer to Exhibit 15-8. The test statistic for testing the significance of the model is
a. 0.73
b. 1.47
c. 28.69
d. 5.22
All of the following are true about qualitative forecasting methods except
a. they generally involve the use of expert judgment to develop forecasts
b. they assume the pattern of the past will continue into the future
c. they are appropriate when past data on the variable being forecast are not applicable
d. they are appropriate when past data on the variable being forecast are not available
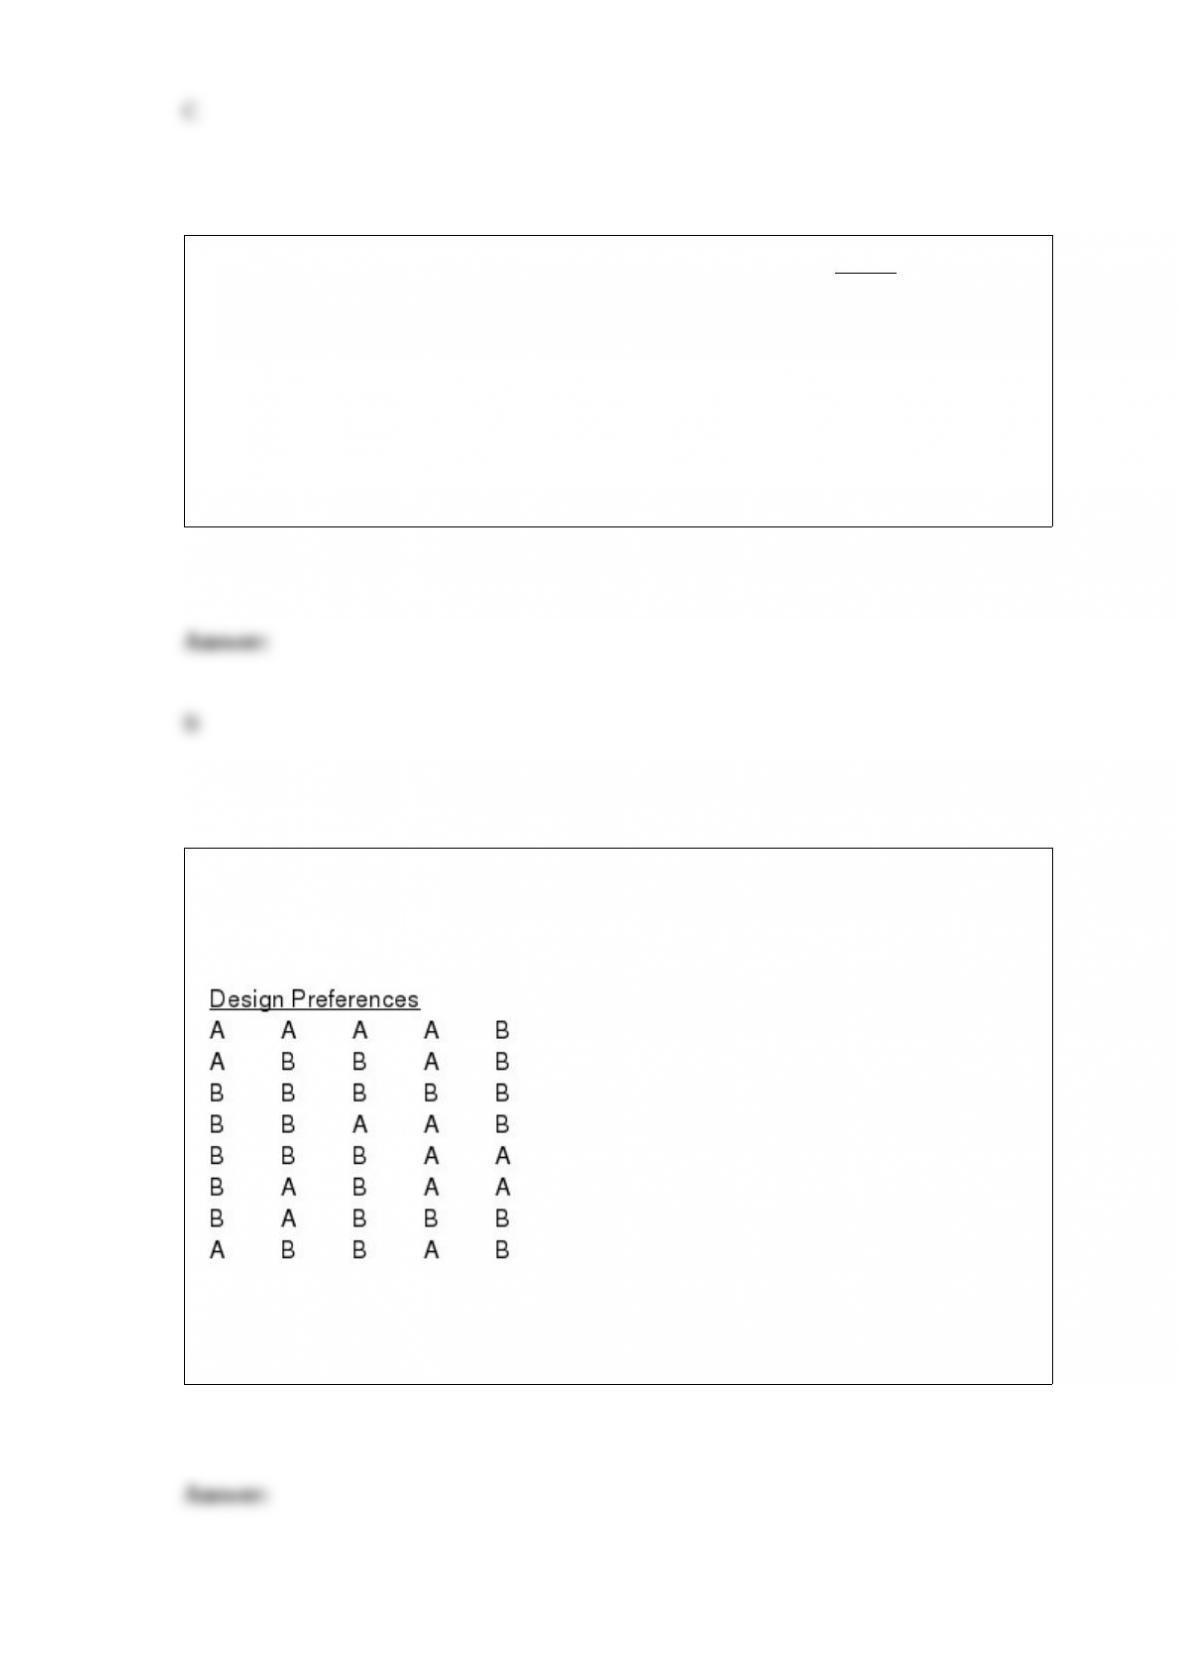
A market research firm is conducting a study to determine which of two package
designs for a liquid soap product potential customers prefer, the current design (A) or a
new design (B). A sample of 40 potential customers is taken. The results follow.
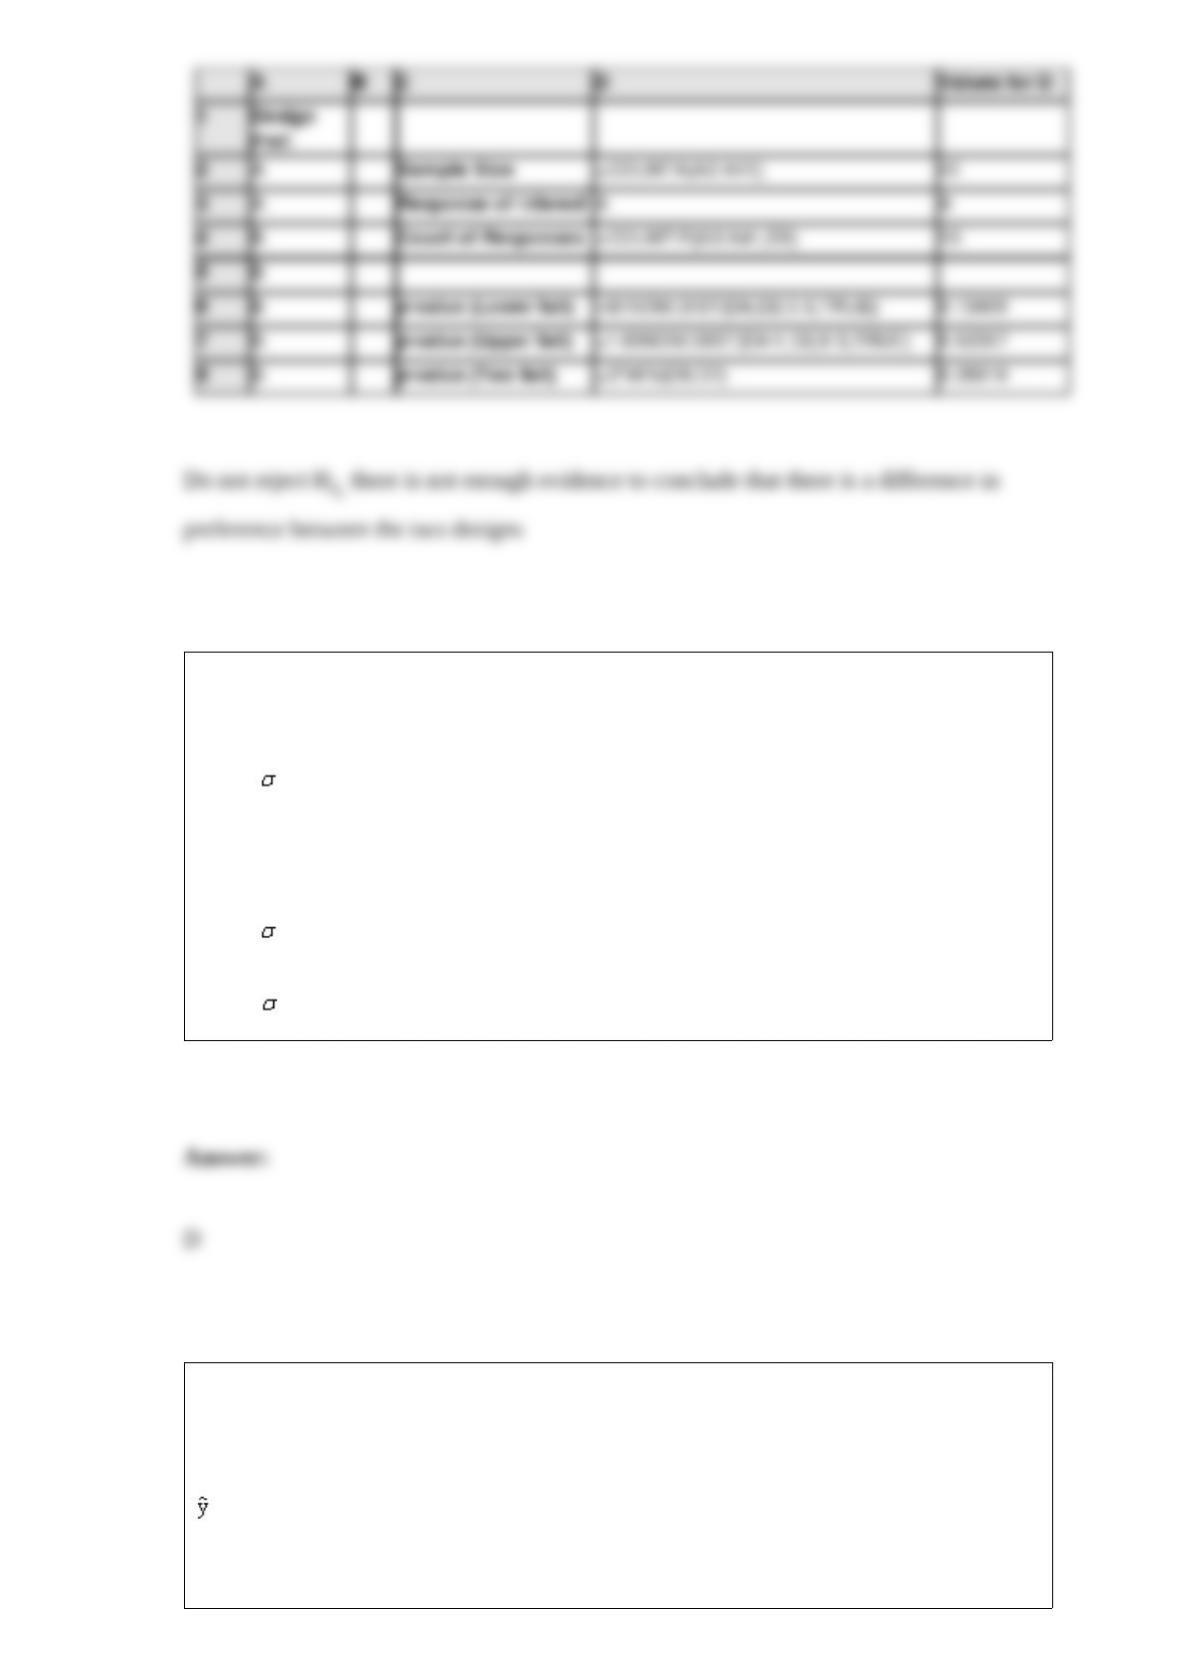
Use Excel to conduct the appropriate hypothesis test at = .05 to determine if the data
indicate that there is a difference in preference between the two designs.
We are interested in testing whether the variance of a population is significantly less
than 1.44. The null hypothesis for this test is
a. Ho: 2 1.44
b. Ho: s2 1.44
c. Ho: 1.20
d. Ho: 2 1.44
Exhibit 15-1
In a regression model involving 44 observations, the following estimated regression
equation was obtained.
= 29 + 18x1 +43x2 + 87x3
For this model SSR = 600 and SSE = 400.

Refer to Exhibit 15-1. MSR for this model is
a. 200
b. 10
c. 1,000
d. 43
Which of the following is NOT an example of an existing source of data?
a. The Internet
b. Internal company records
c. U. S. Census Bureau
d. All of these are examples of existing sources of data.
In a sample of 40 Democrats, 6 opposed the President’s foreign policy, while of 50
Republicans, 8 were opposed to his policy. Determine a 90% confidence interval
estimate for the difference between the proportions of the opinions of the individuals in
the two parties.
In a sample of 100 Republicans, 60 favored the President’s anti-drug program. While in
a sample of 150 Democrats, 84 favored his program. At 95% confidence, test to see if
there is a significant difference in the proportions of the Democrats and the Republicans
who favored the President’s anti-drug program.
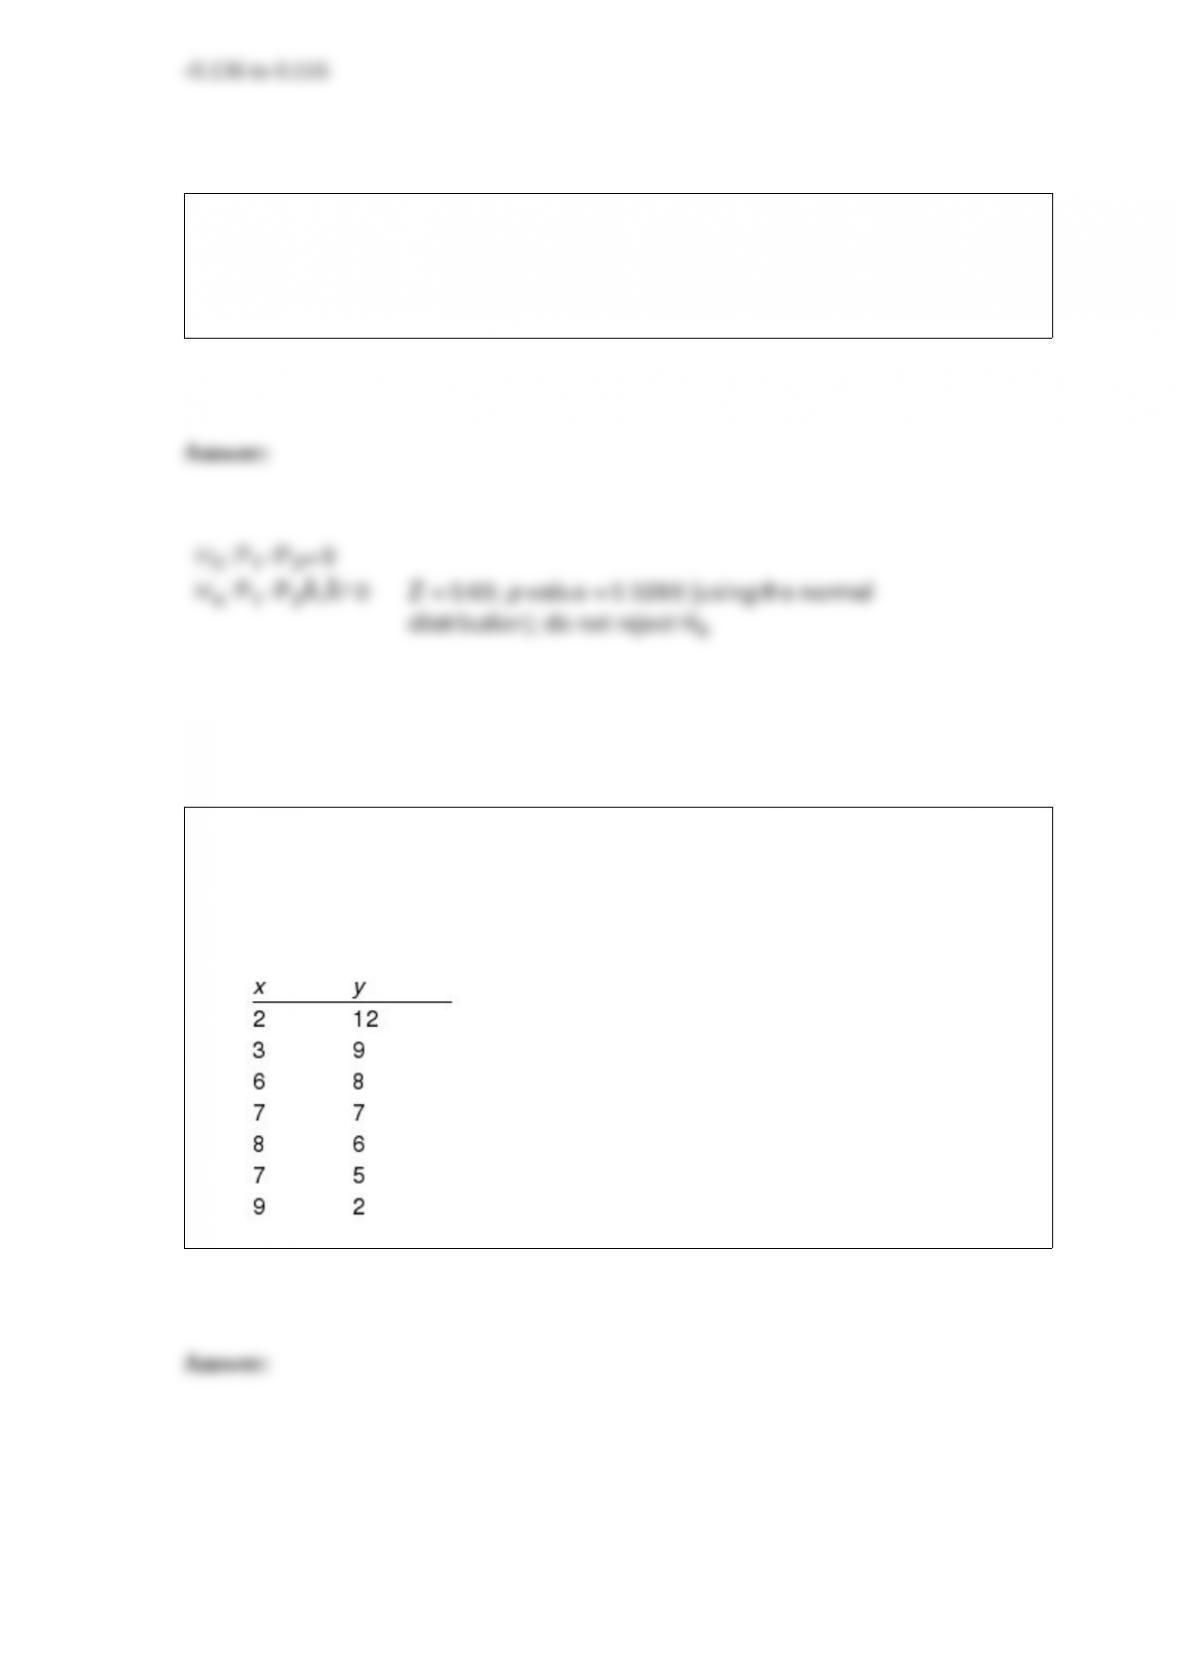
Given below are seven observations collected in a regression study on two variables, x
(independent variable) and y (dependent variable). Use Excel to develop a scatter
diagram and to compute the least squares estimated regression equation and the
coefficient of determination.
The Highway Safety Department wants to study the driving habits of individuals. A
sample of 41 cars traveling on the highway revealed an average speed of 60 miles per
hour and a standard deviation of 7 miles per hour. The population of car speeds is
approximately normally distributed. Determine a 90% confidence interval estimate for
the speed of all cars.
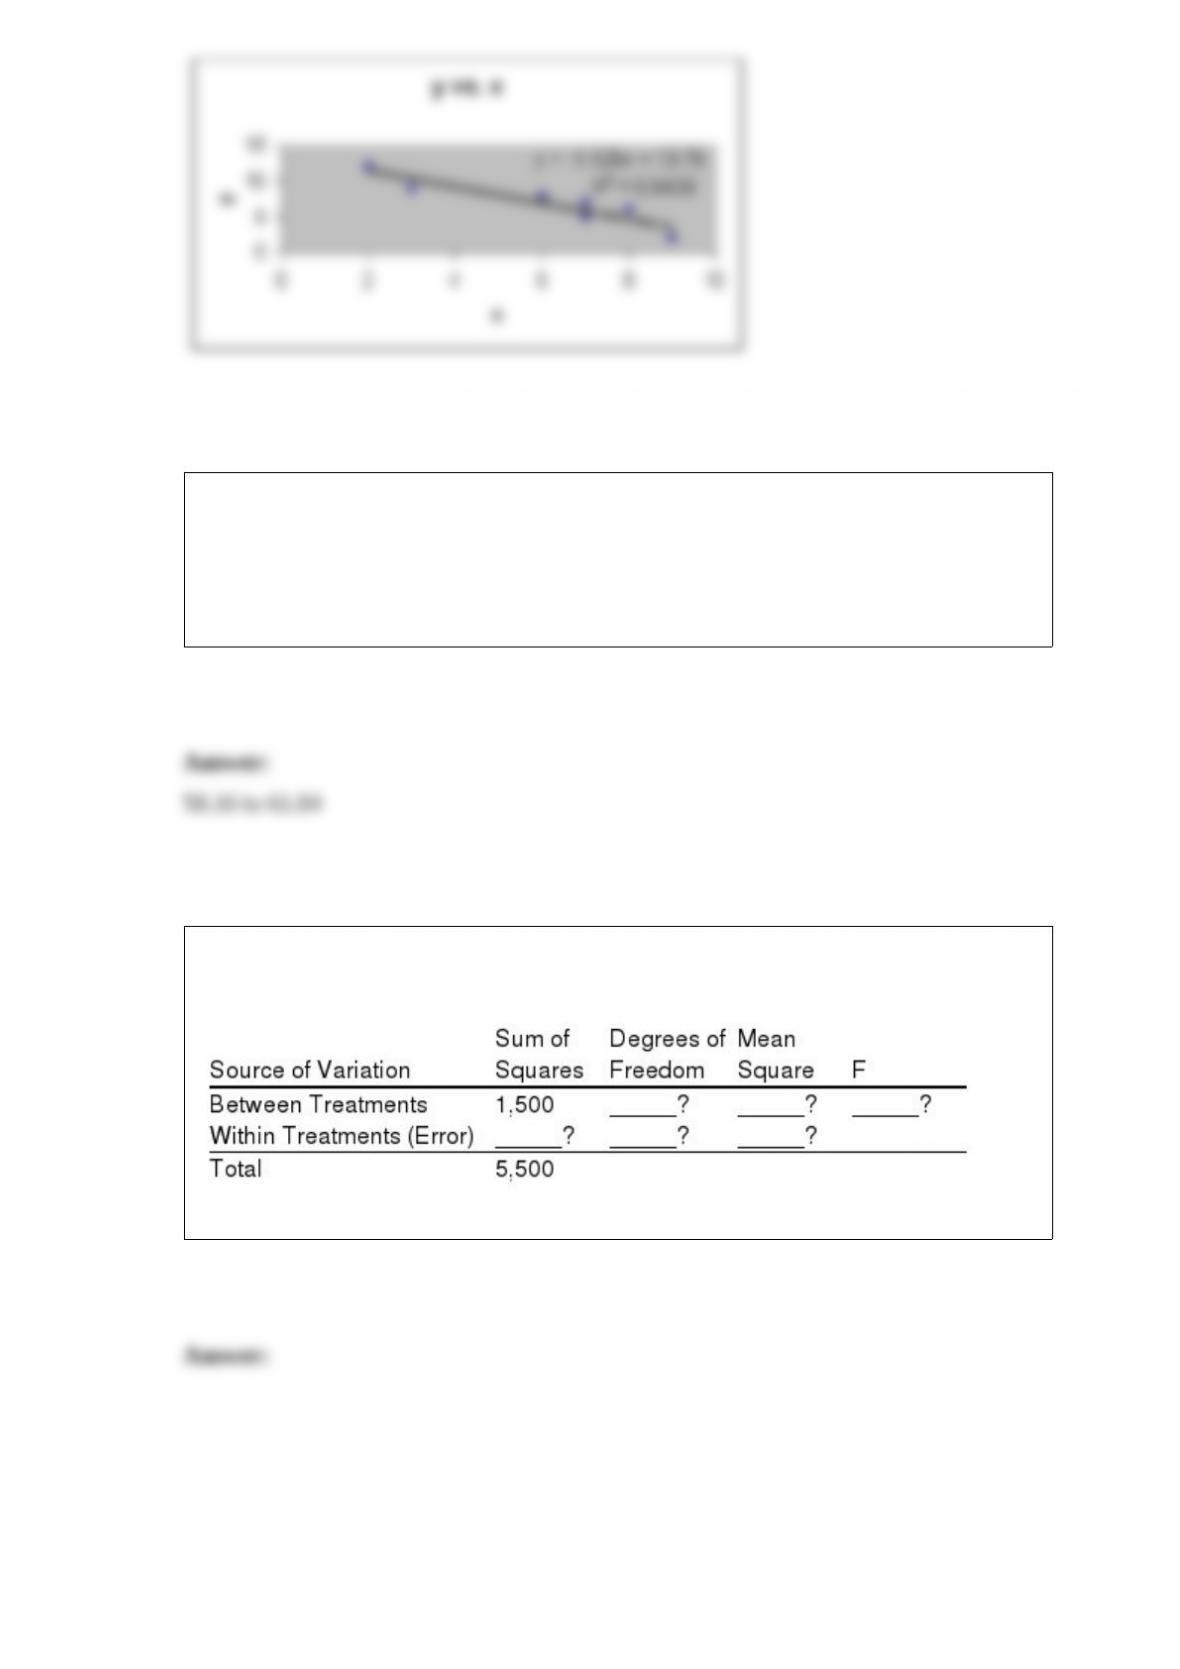
In a completely randomized experimental design, 11 experimental units were used for
each of the 4 treatments. Part of the ANOVA table is shown below.
Fill in the blanks in the above ANOVA table.
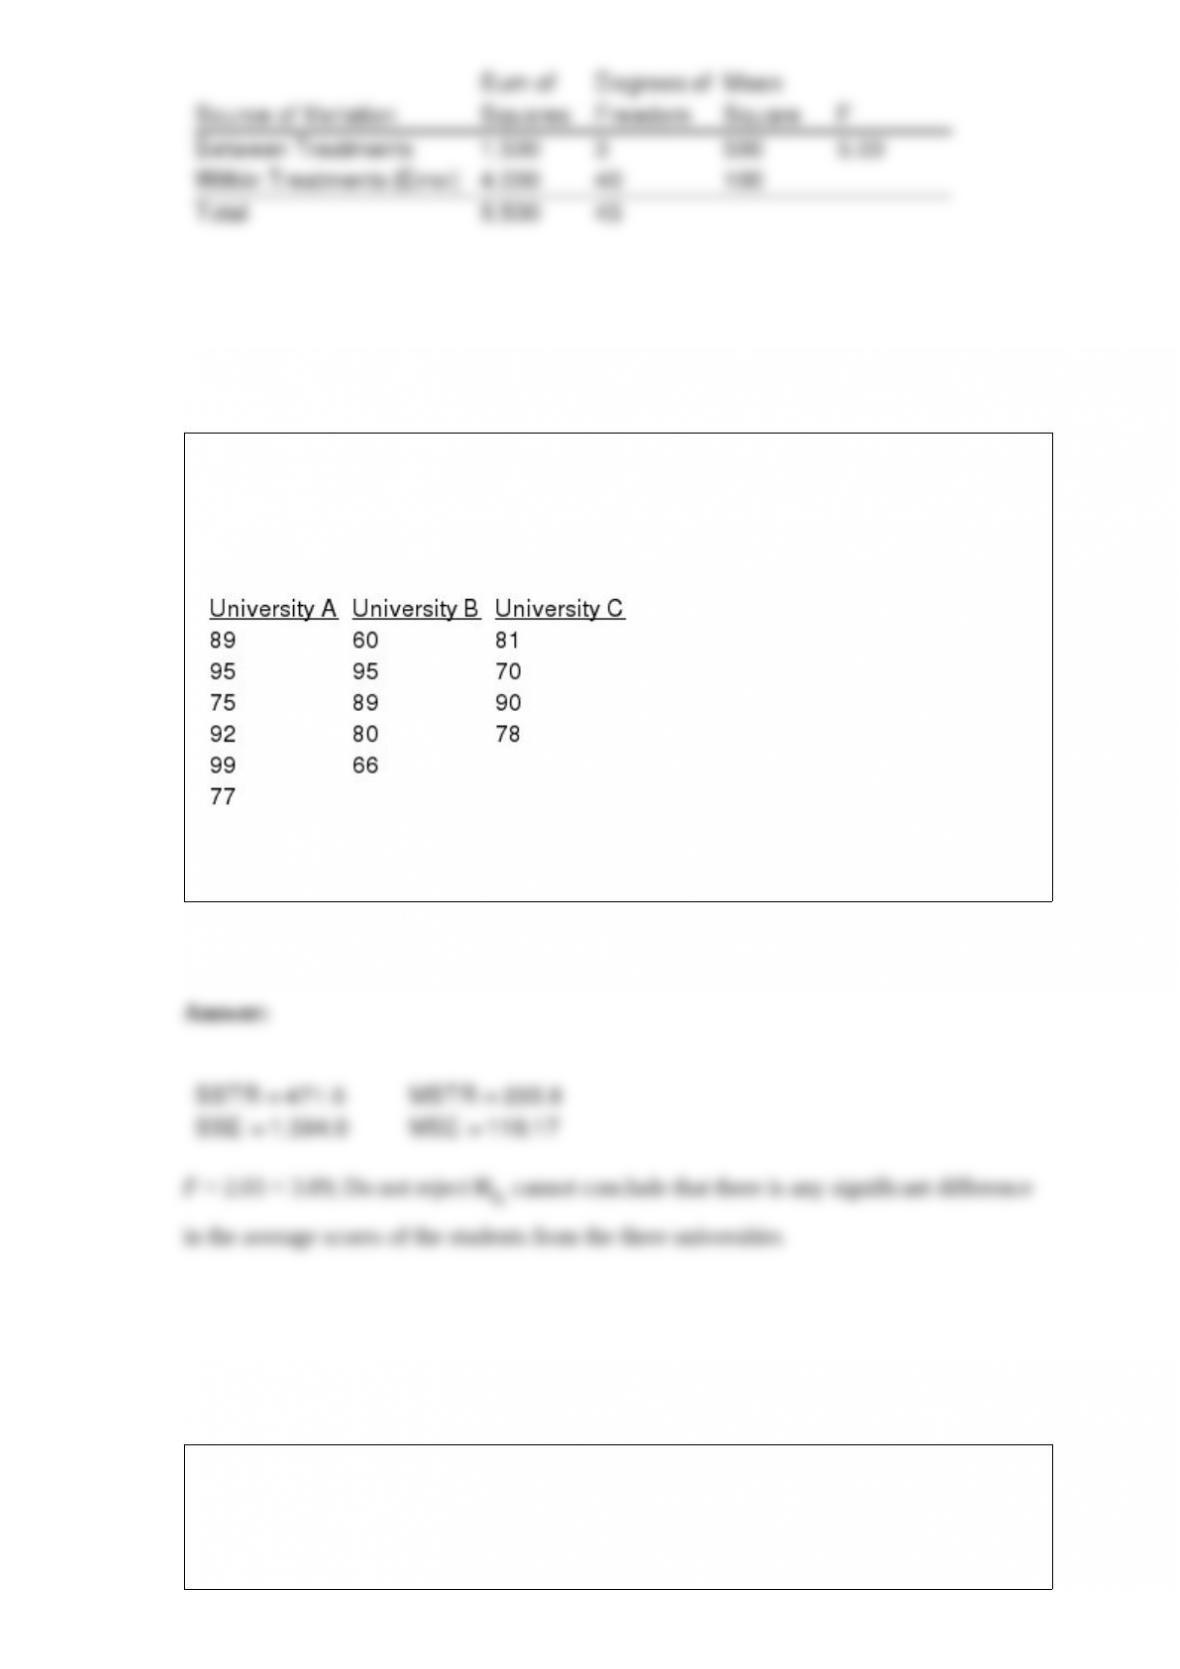
Three universities administer the same comprehensive examination to the recipients of
MS degrees in psychology. From each institution, a random sample of MS recipients
was selected, and these recipients were then given the exam. The following table shows
the scores of the students from each university.
At = 0.01, test to see if there is any significant difference in the average scores of the
students from the three universities. (Note that the sample sizes are not equal.)
A researcher is interested in determining the average number of years employees of a
company stay with the company. If past information shows a standard deviation of 7
months, what size sample should be taken so that at 95% confidence the margin of error
will be 2 months or less?

An acceptance sampling plan uses a sample of 18 with an acceptance criterion of zero.
Determine the probability of accepting shipments that contain 5, 10, 15, 20, 25, 30, 35,
40, and 45% defective units.
The heating bills for a selected sample of houses using various forms of heating are
given below (values are in dollars).
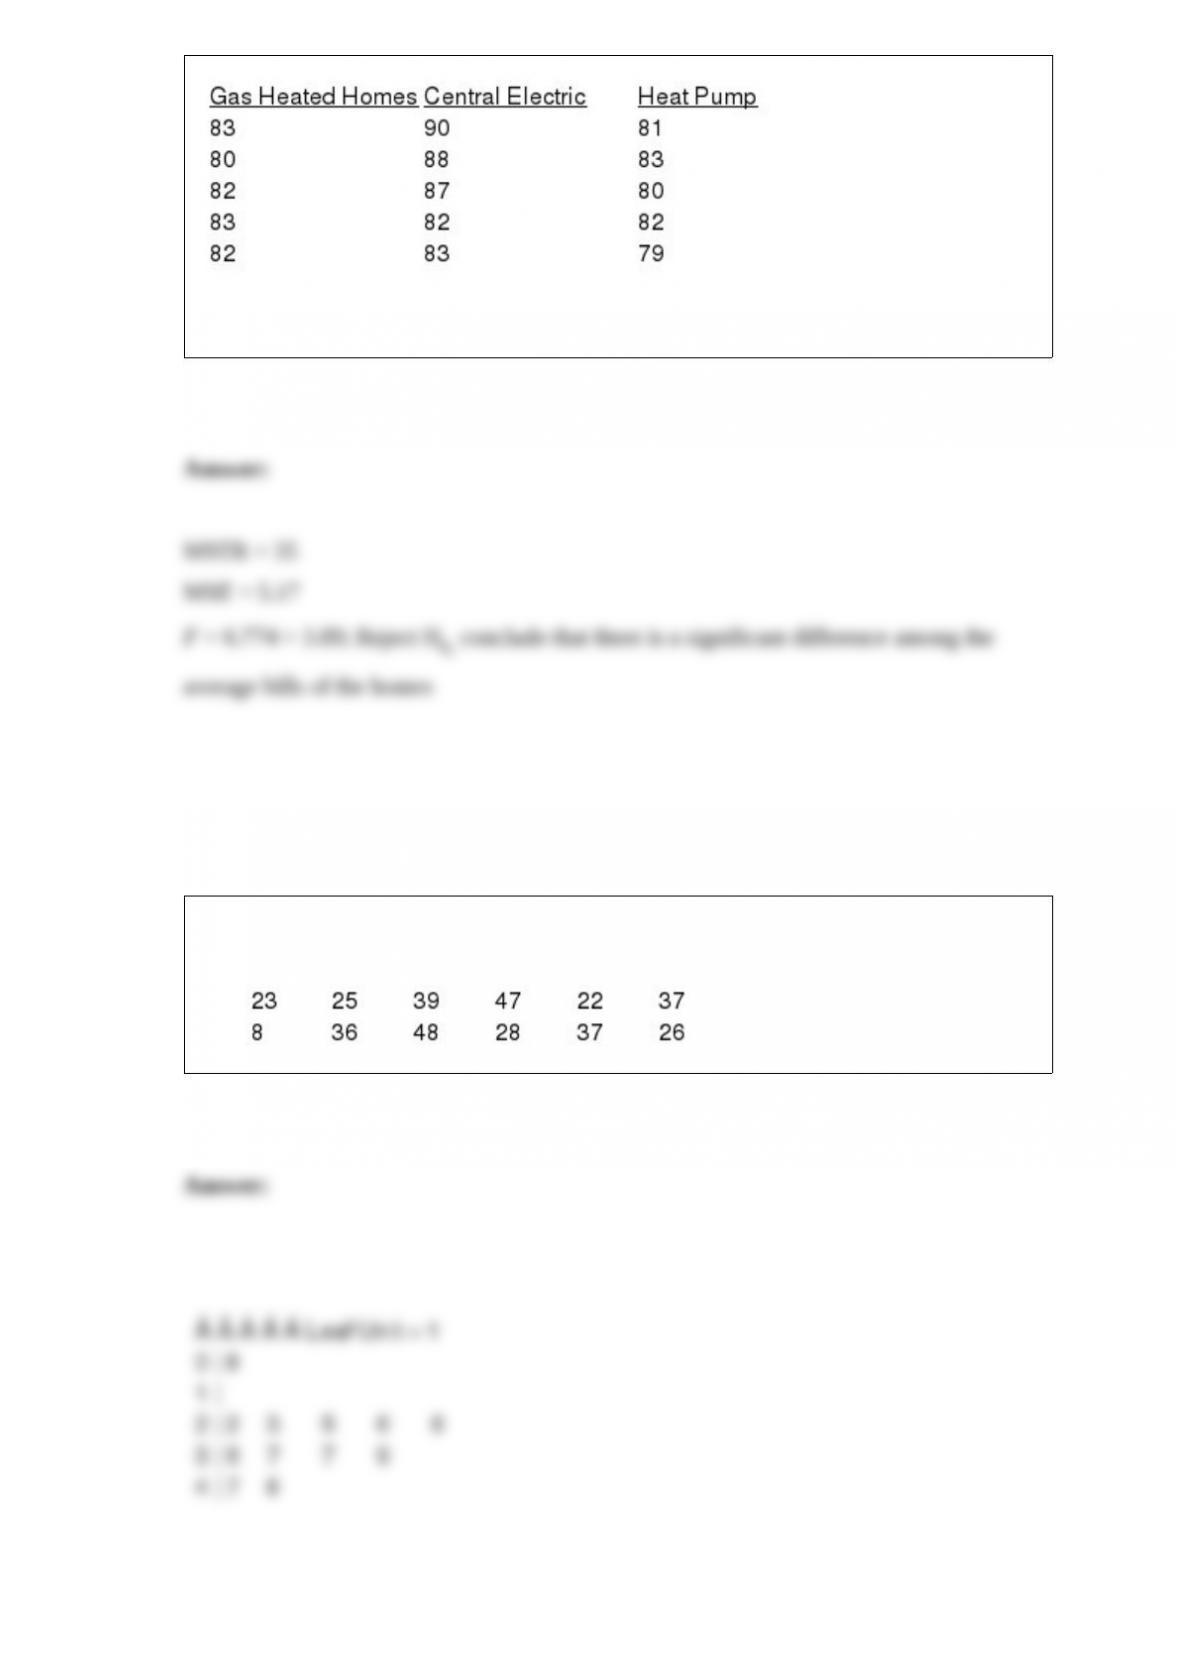
At = 0.05, test to see if there is a significant difference among the average bills of the
homes.
You are given the following data on the price/earnings (P/E) ratios for twelve
companies. Construct a stem-and-leaf display. Specify the leaf unit for the display.