
Exhibit 10-11
An insurance company selected samples of clients under 18 years of age and over 18
and recorded the number of accidents they had in the previous year. The results are
shown below.
We are interested in determining if the accident proportions differ between the two age
groups.
Refer to Exhibit 10-11. The test statistic is
a. 0.96
b. 1.96
c. 2.96
d. 3.96
Exhibit 16-4
In a laboratory experiment, data were gathered on the life span (y in months) of 33 rats,
units of daily protein intake (x1), and whether or not agent x2 (a proposed life extending
agent) was added to the rats diet (x2 = 0 if agent x2 was not added, and x2 = 1 if agent
was added.) From the results of the experiment, the following regression model was
developed.
= 36 + 0.8x1 – 1.7x2
Also provided are SSR = 60 and SST = 180.
Refer to Exhibit 16-4. If we want to test for the significance of the model, the critical
value of F at 95% confidence is
a. 8.62
b. 3.35
c. 2.92
d. 2.96
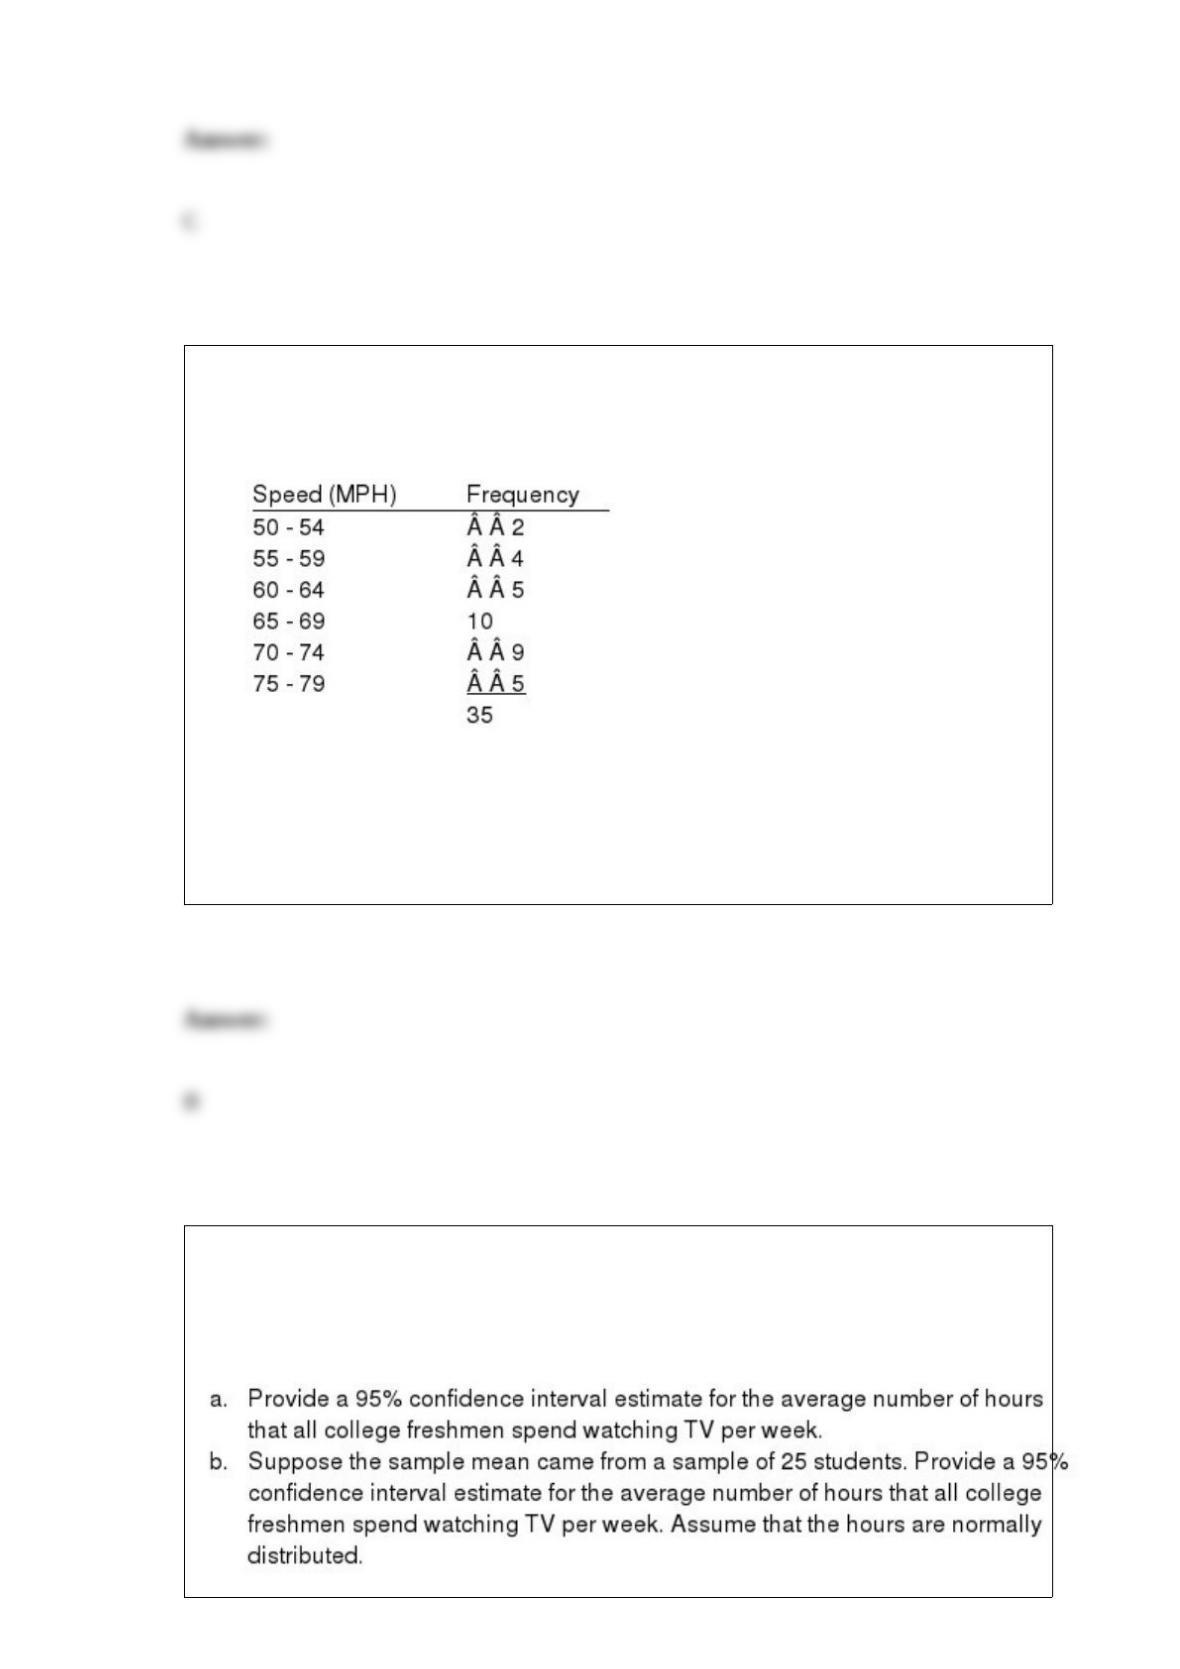
Exhibit 3-4
The following is the frequency distribution for the speeds of a sample of automobiles
traveling on an interstate highway.
Refer to Exhibit 3-4. The standard deviation is
a. 6.969
b. 7.071
c. 48.570
d. 50.000
In order to determine how many hours per week freshmen college students watch
television, a random sample of 256 students was selected. It was determined that the
students in the sample spent an average of 14 hours. The standard deviation is 3.2 hours
per week for all freshman college students.
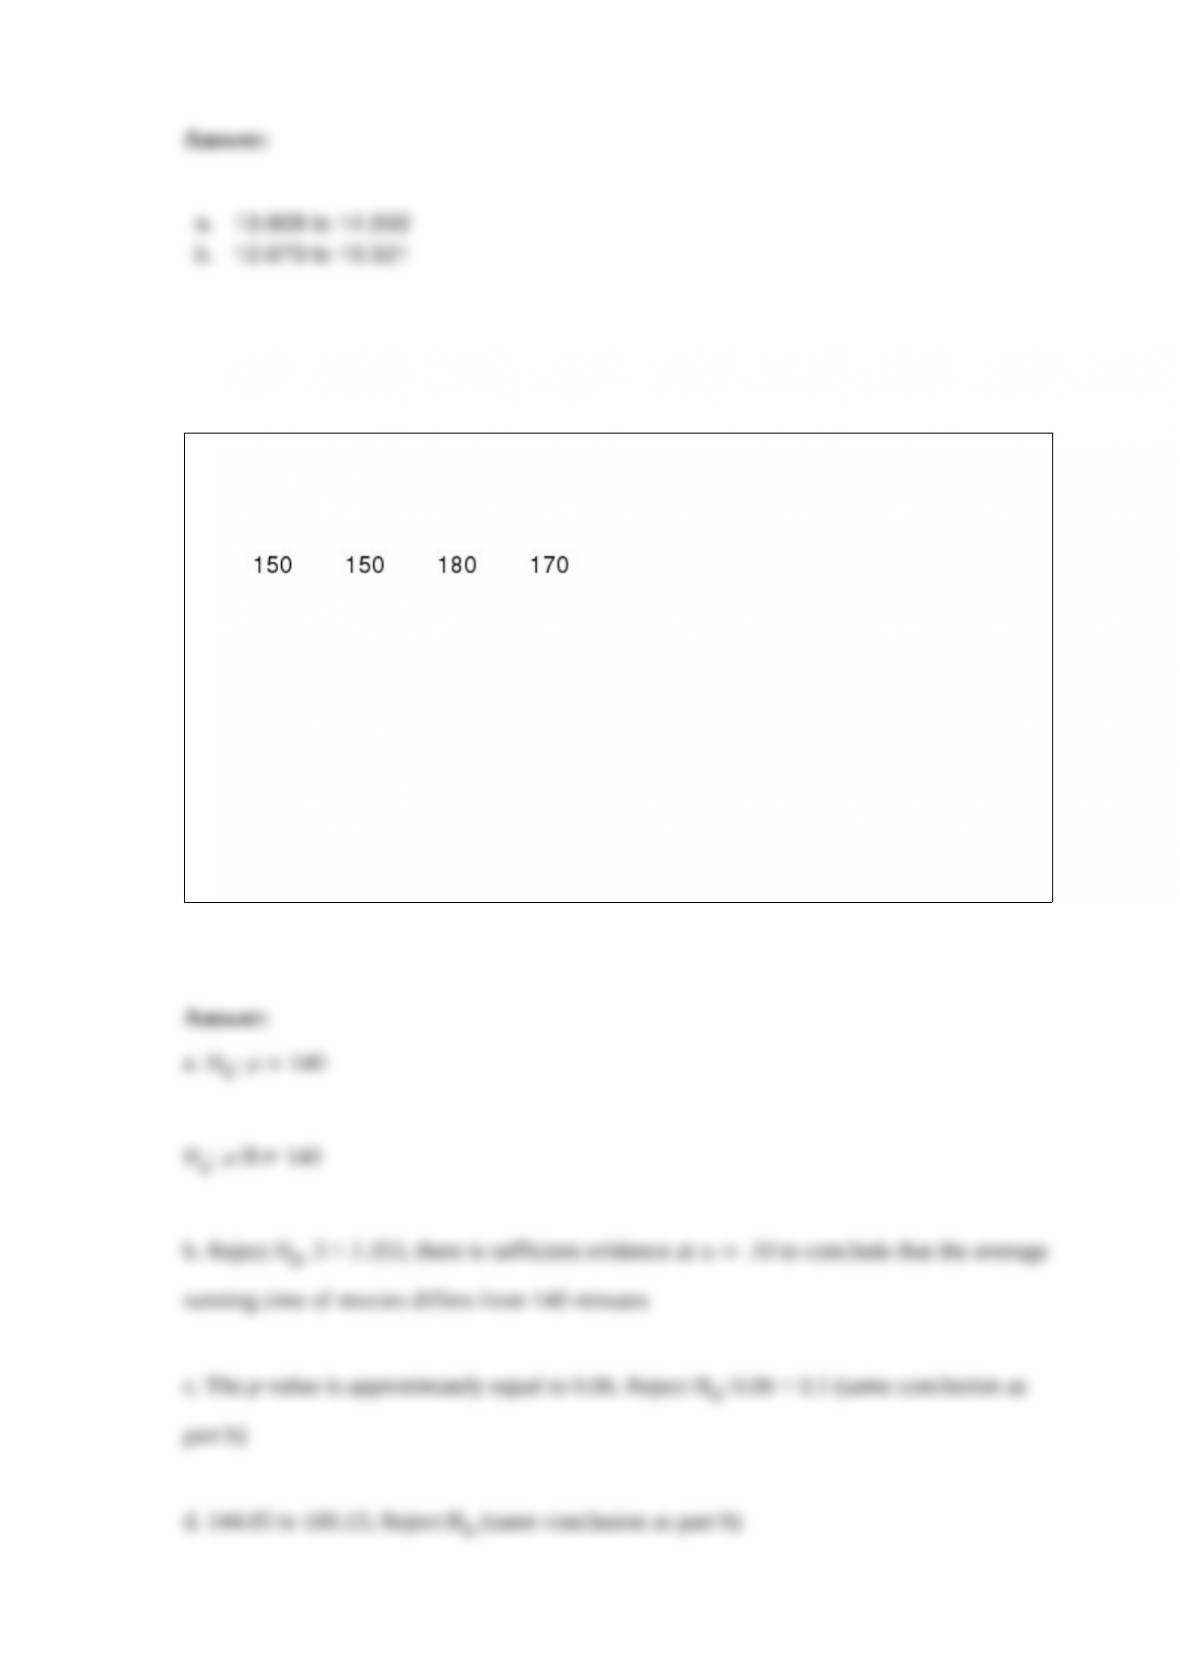
Nancy believes that the average running time of movies is equal to 140 minutes. A
sample of 4 movies was taken and the following running times were obtained. Assume
the distribution of the population is normally distributed.
a. State the null and alternative hypotheses.
b. Using a critical value, test the hypothesis at the 10% level of significance.
c. Using a p-value, test the hypothesis at the 10% level of significance.
d. Using a confidence interval, test the hypothesis at the 10% level of significance.
e. Could a Type II error have been committed in this hypothesis test?

A random sample of 150 people was taken from a very large population. Ninety of the
people in the sample were females. The standard error of the proportion of females is
a. 0.0016
b. 0.2400
c. 0.1600
d. 0.0400
Assume you have applied for two scholarships, a Merit scholarship (M) and an Athletic
scholarship (A). The probability that you receive an Athletic scholarship is 0.18. The
probability of receiving both scholarships is 0.11. The probability of getting at least one
of the scholarships is 0.3.
a. What is the probability that you will receive a Merit scholarship?
b. Are events A and M mutually exclusive? Why or why not? Explain.
c. Are the two events, A and M, independent? Explain, using probabilities.
d. What is the probability of receiving the Athletic scholarship given that you have been
awarded the Merit scholarship?
e. What is the probability of receiving the Merit scholarship given that you have been
awarded the Athletic scholarship?
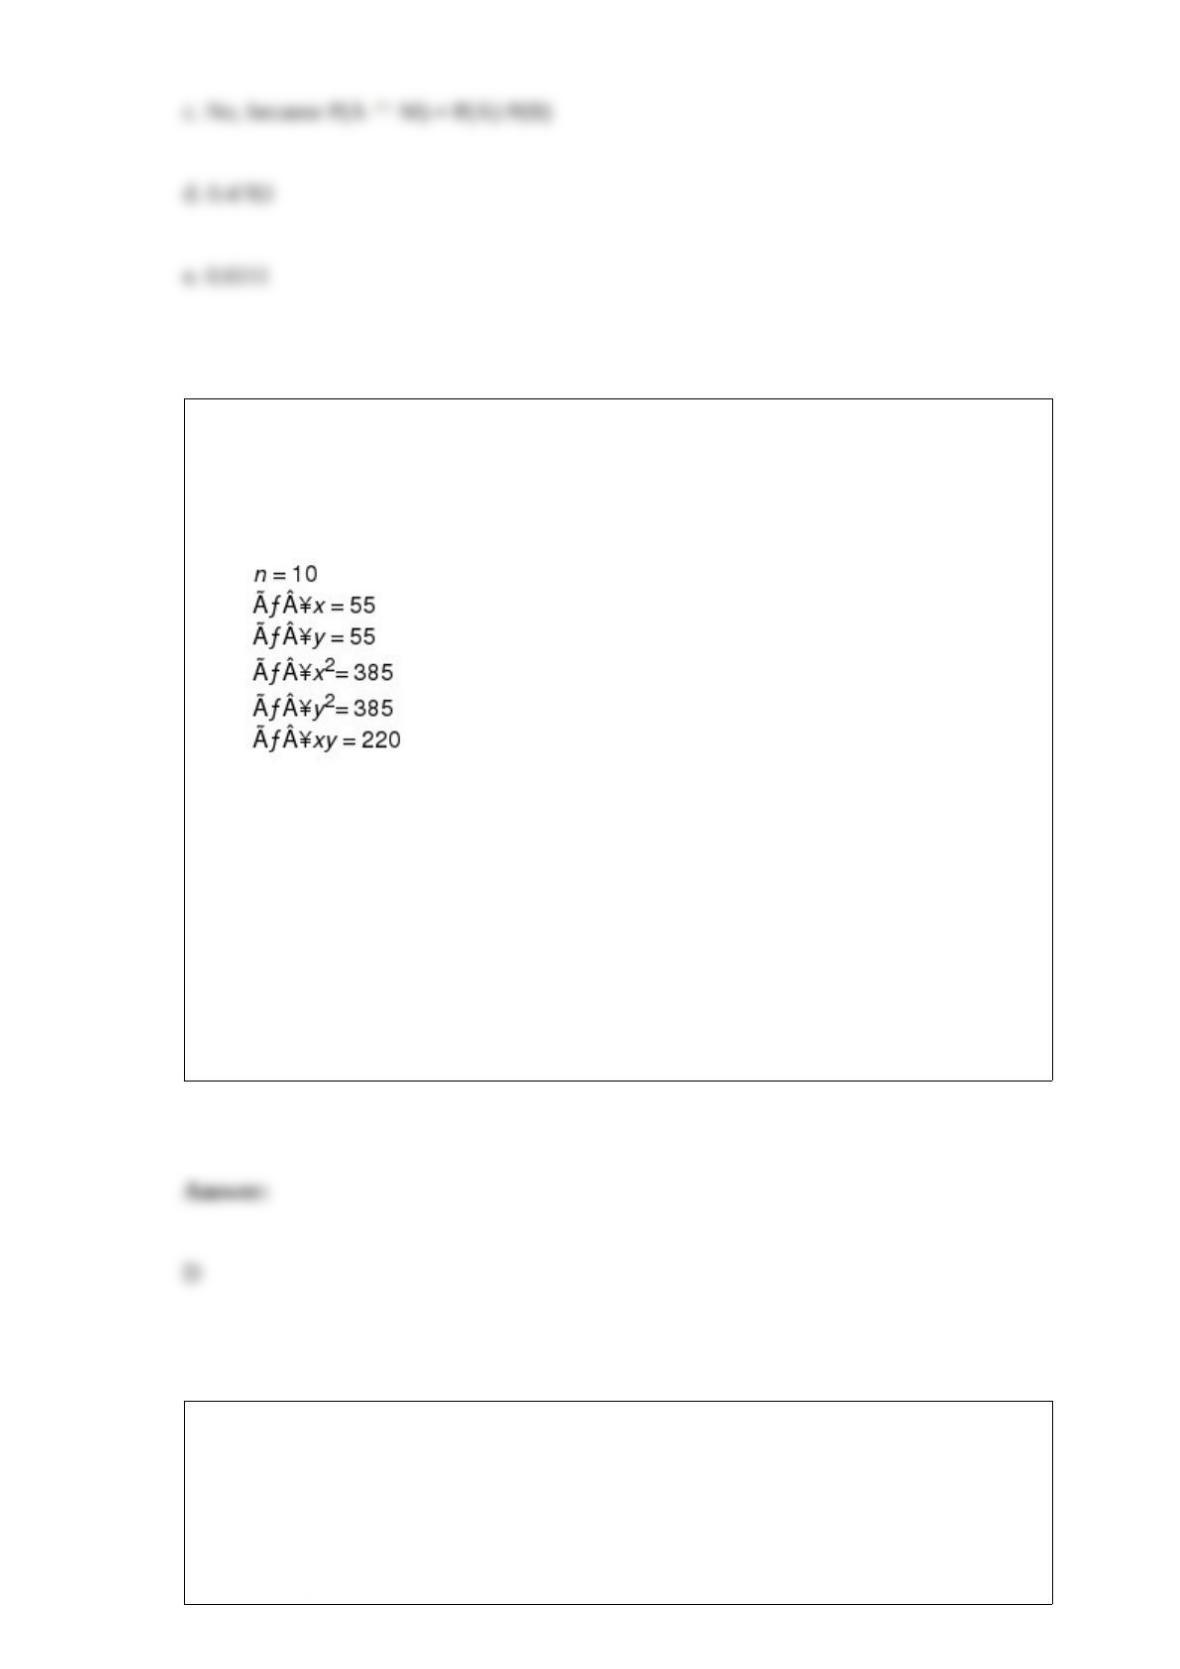
Exhibit 14-1
A regression analysis resulted in the following information regarding a dependent
variable (y) and an independent variable (x).
Refer to Exhibit 14-1. The point estimate of y when x 20 is
a. 0
b. 31
c. 9
d. -9
An exponential probability distribution
a. is a continuous distribution
b. is a discrete distribution
c. can be either continuous or discrete
d. must be normally distributed
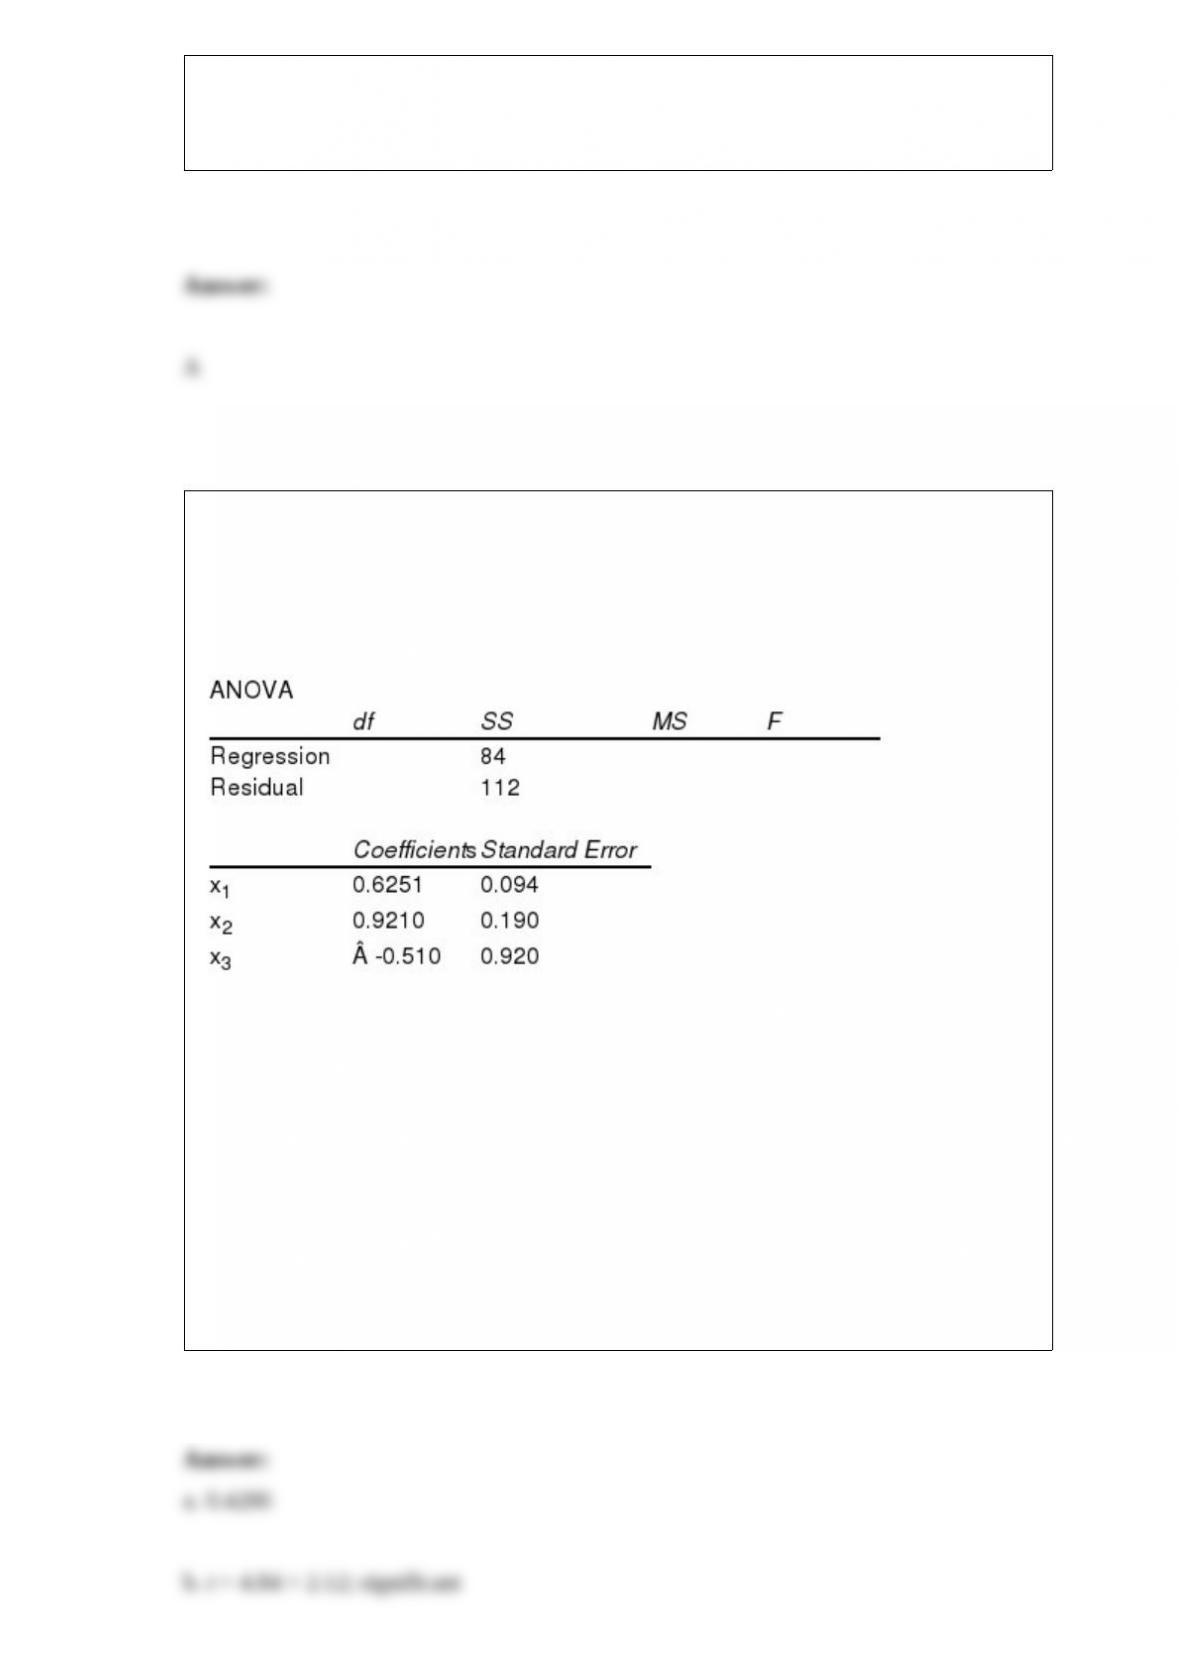
Multiple regression analysis was used to study how an individual’s income (y in
thousands of dollars) is influenced by age (x1 in years), level of education (x2 ranging
from 1 to 5), and the person’s gender (x3 where 0 =female and 1=male). The following
is a partial result of Excel output that was used on a sample of 20 individuals.
a. Compute the coefficient of determination.
b. Perform a t test and determine whether or not the coefficient of the variable “level of
education” (i.e., x2) is significantly different from zero. Let = 0.05.
c. At = 0.05, perform an F test and determine whether or not the regression model is
significant.
d. As you note the coefficient of x3 is -0.510. Fully interpret the meaning of this
coefficient.

Delicious Candy markets a two-pound box of assorted chocolates. Because of
imperfections in the candy making equipment, the actual weight of the chocolate has a
uniform distribution ranging from 31.8 to 32.6 ounces.
a. Define a probability density function for the weight of the box of chocolate.
b. What is the probability that a box weighs (1) exactly 32 ounces; (2) more than 32.3
ounces; (3) less than 31.8 ounces?
c. The government requires that at least 60% of all products sold weigh at least as much
as the stated weight. Is Delicious violating government regulations?
From a population that is normally distributed with an unknown standard deviation, a
sample of 25 elements is selected. For the interval estimation of
, the proper
distribution to use is the
a. standard normal distribution
b. z distribution
c. t distribution with 26 degrees of freedom
d. t distribution with 24 degrees of freedom
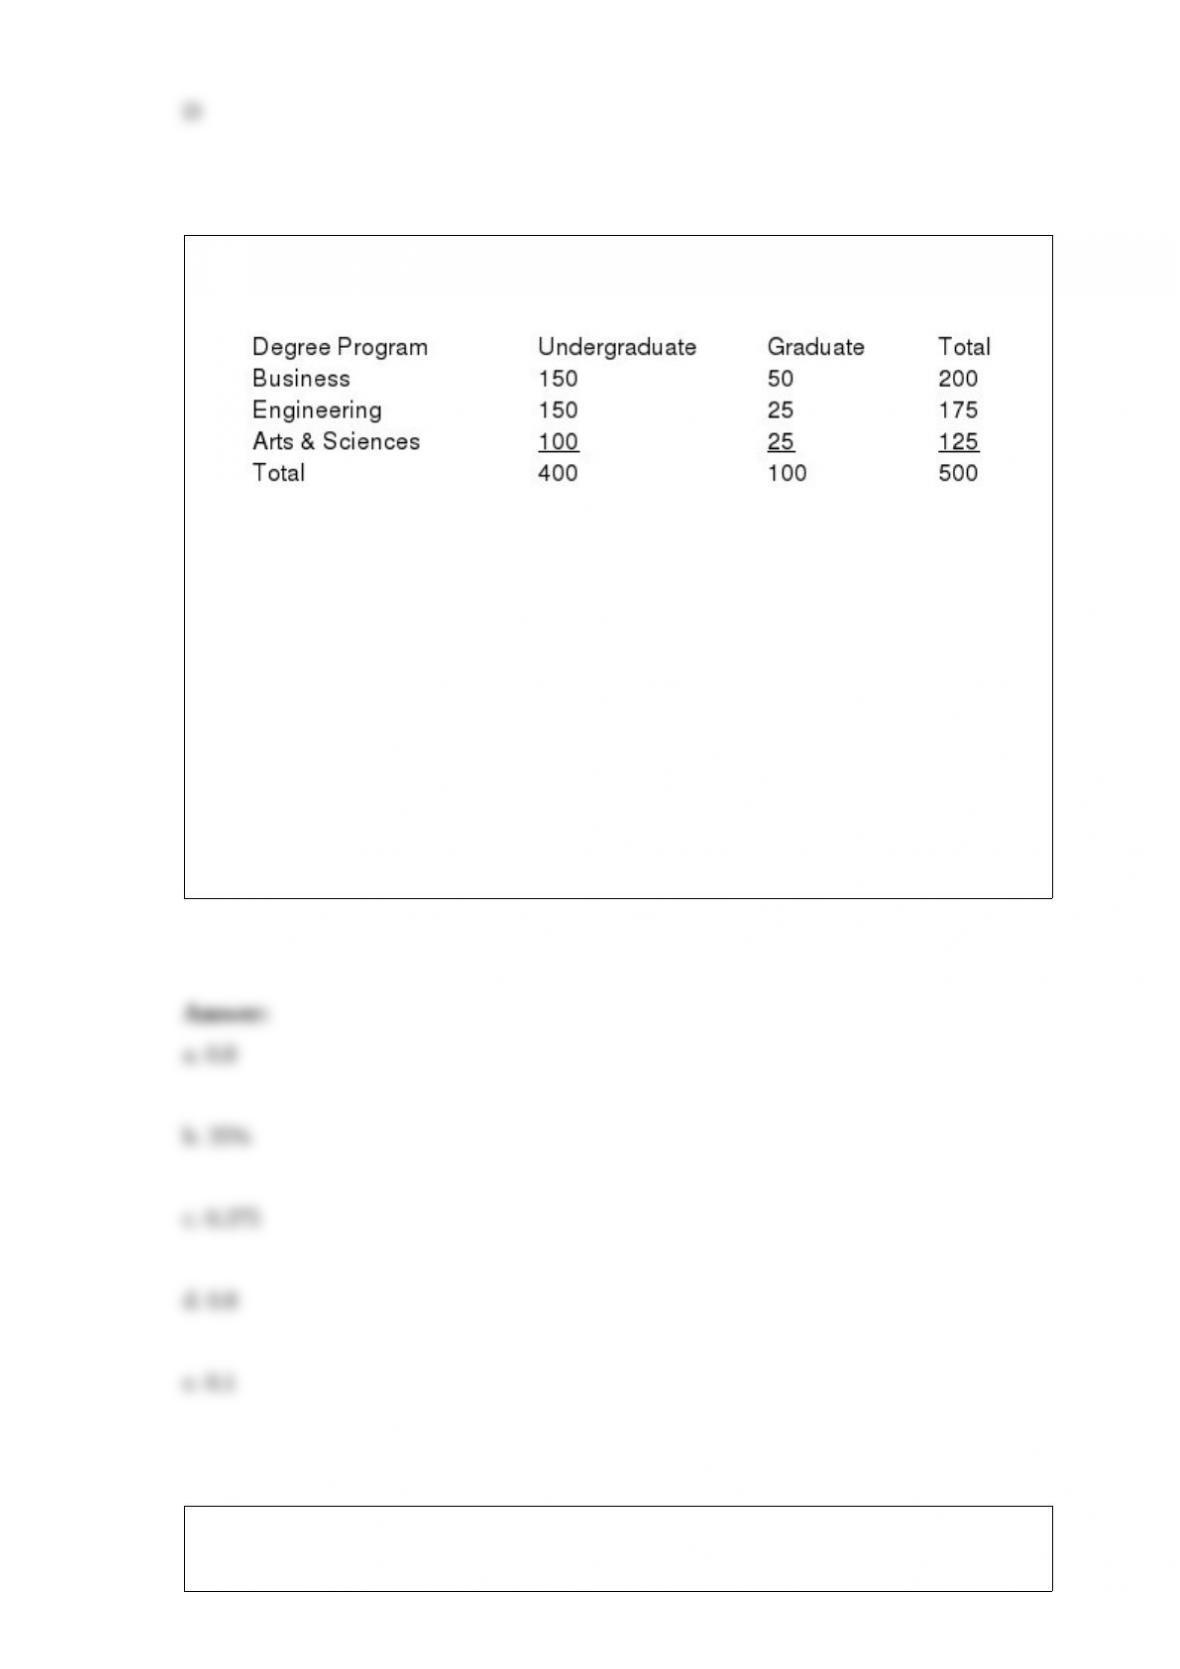
The following table shows the number of students in three different degree programs
and whether they are graduate or undergraduate students:
a. What is the probability that a randomly selected student is an undergraduate?
b. What percentage of students is engineering majors?
c. If we know that a selected student is an undergraduate, what is the probability that he
or she is a business major?
d. A student is enrolled in the Arts and Sciences school. What is the probability that the
student is an undergraduate student?
e. What is the probability that a randomly selected student is a graduate Business
major?
The form of the continuous uniform probability distribution is

a. triangular
b. rectangular
c. bell-shaped
d. a series of vertical lines
An ANOVA procedure is used for data obtained from four populations. Four samples,
each comprised of 30 observations, were taken from the four populations. The
numerator and denominator (respectively) degrees of freedom for the critical value of F
are
a. 3 and 30
b. 4 and 30
c. 3 and 119
d. 3 and 116
In constructing a frequency distribution, as the number of classes are decreased, the
class width
a. decreases
b. remains unchanged
c. increases
d. can increase or decrease depending on the data values

The 95% confidence interval estimate for a population variance when a sample variance
of 30 is obtained from a sample of 12 items is
a. 14.14 to 74.94
b. 15.05 to 86.48
c. 16.42 to 94.35
d. 16.77 to 72.13
Ten percent of the items produced by a machine are defective. A random sample of 100
items is selected and checked for defects.
a. Determine the standard error of the proportion.
b. What is the probability that the sample will contain more than 2.5% defective units?
c. What is the probability that the sample will contain more than 13% defective units?
Two independent random samples of annual starting salaries for individuals with
master’s and bachelor’s degrees in business were taken and the results are shown below
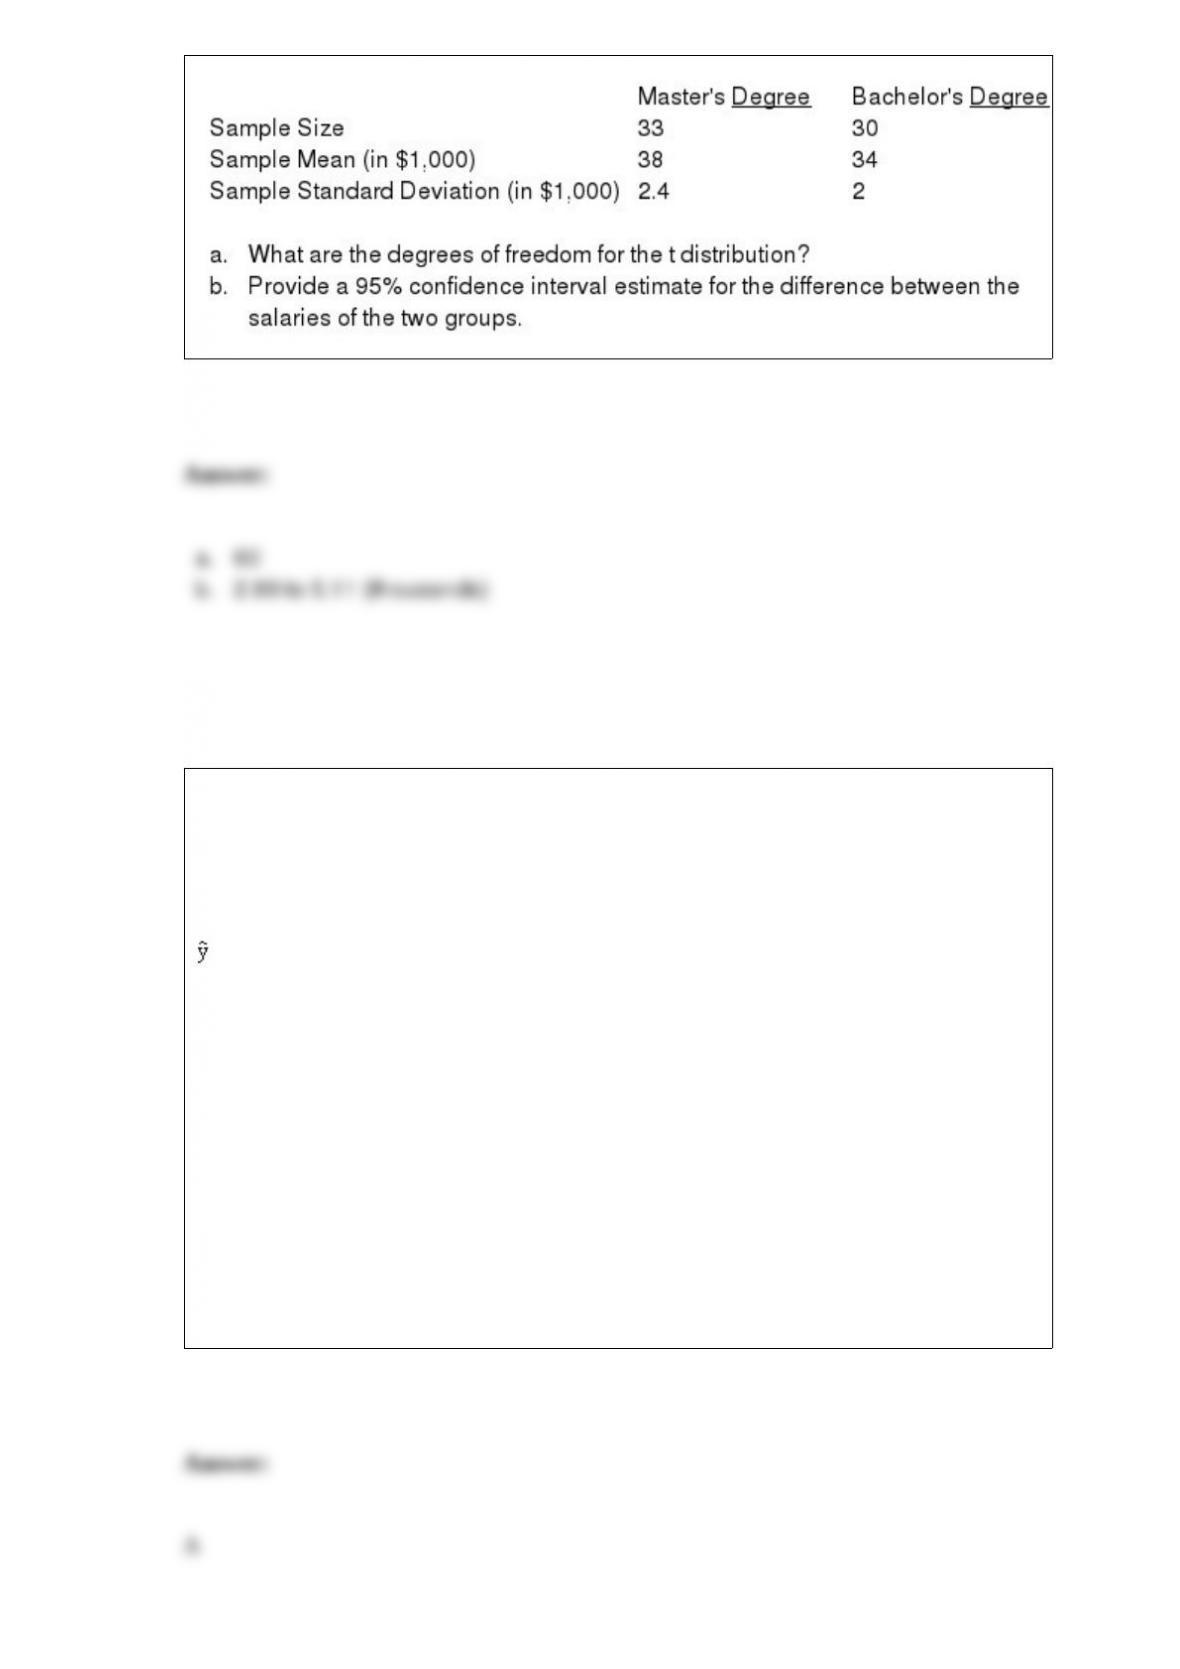
Exhibit 15-8
The following estimated regression model was developed relating yearly income (y in
$1,000s) of 30 individuals with their age (x1) and their gender (x2) (0 if male and 1 if
female).
= 30 + 0.7x1 + 3x2
Also provided are SST = 1,200 and SSE = 384.
Refer to Exhibit 15-8. The model
a. is significant
b. is not significant
c. would be significant is the sample size was larger than 30
d. None of these alternatives is correct.

The forward selection procedure starts with how many independent variable(s) in the
multiple regression model?
a. none
b. one
c. two
d. all of them
If A and B are independent events with P(A) 0.2 and P(B) 0.6, then P(A ˆ B)
a. 0.62
b. 0.12
c. 0.60
d. 0.68
In a multiple regression model, the error term is assumed to be a random variable with
a mean of
a. zero
b. -1
c. 1
d. any value
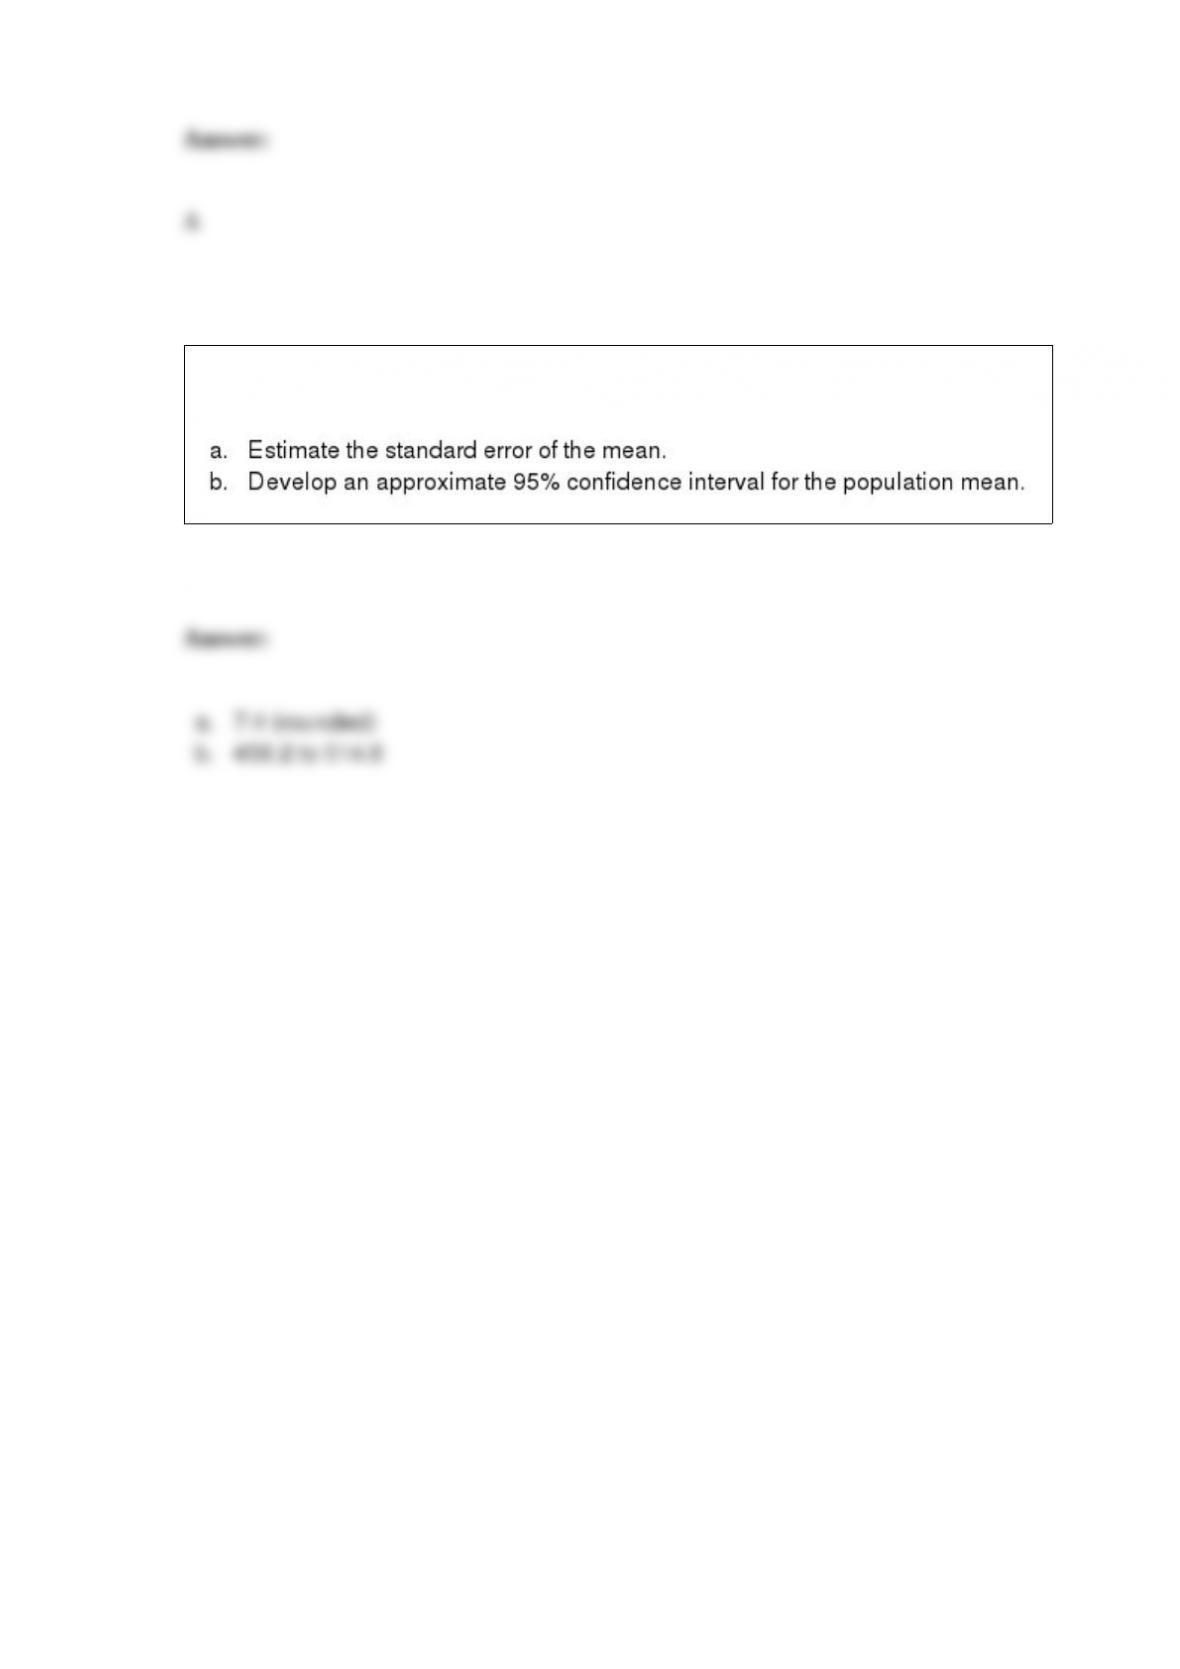
Simple random sampling has been used to obtain a sample of size 60 from a population
of size 700. The sample mean was 500 with a standard deviation of 60.