An element of the sample space is
a. an event
b. an estimator
c. a sample point
d. an outlier
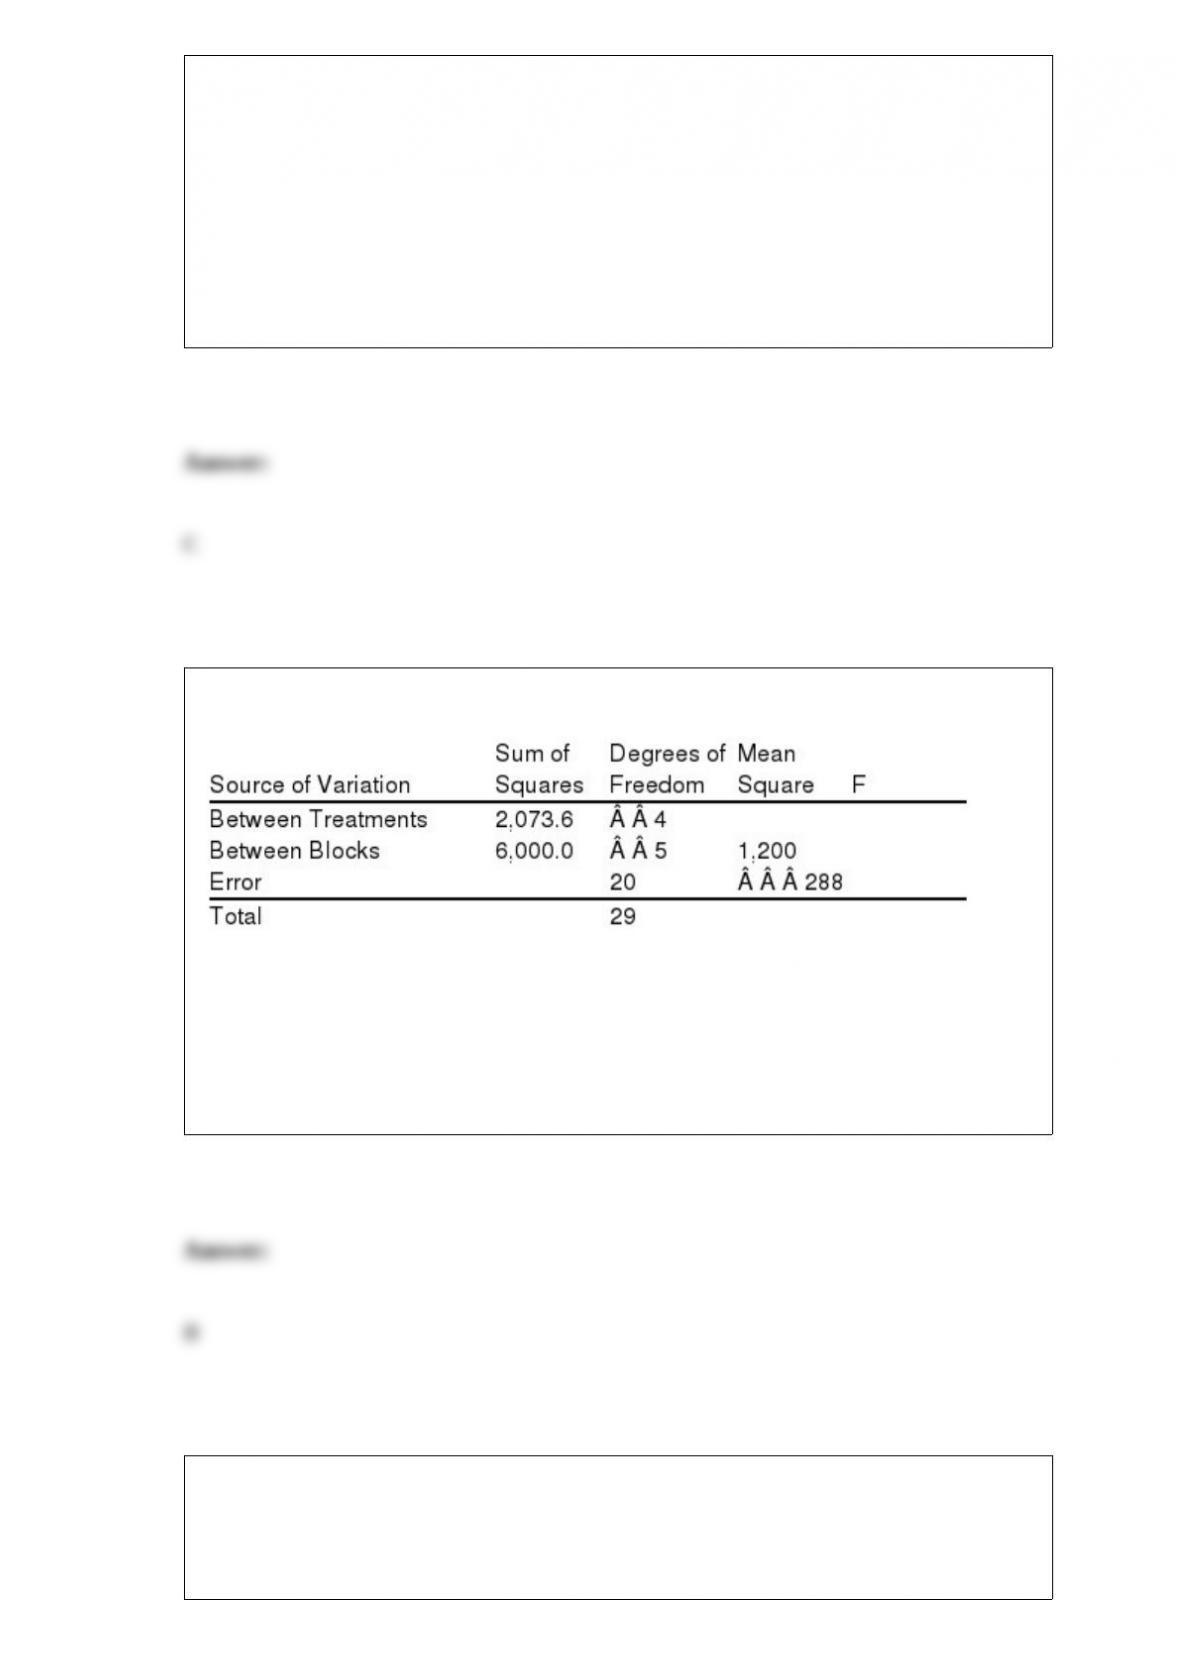
Exhibit 13-2
Refer to Exhibit 13-2. The null hypothesis is to be tested at the 5% level of significance.
The critical value from the table is
a. 2.71
b. 2.87
c. 5.19
d. 5.8
Exhibit 16-2
In a regression model involving 30 observations, the following estimated regression
equation was obtained.

= 170 + 34x1 – 3x2 + 8x3 + 58x4 + 3x5
For this model, SSR = 1,740 and SST = 2,000.
Refer to Exhibit 16-2. The value of MSR is
a. 10.40
b. 348
c. 10.83
d. 52
The expected value for a binomial probability distribution is
a. E(x) pn(1 n)
b. E(x) p(1 p)
c. E(x) np
d. E(x) np(1 p)
If data for a time series analysis is collected on an annual basis only, which pattern can
be ignored?
a. trend
b. seasonal
c. cyclical
d. horizontal
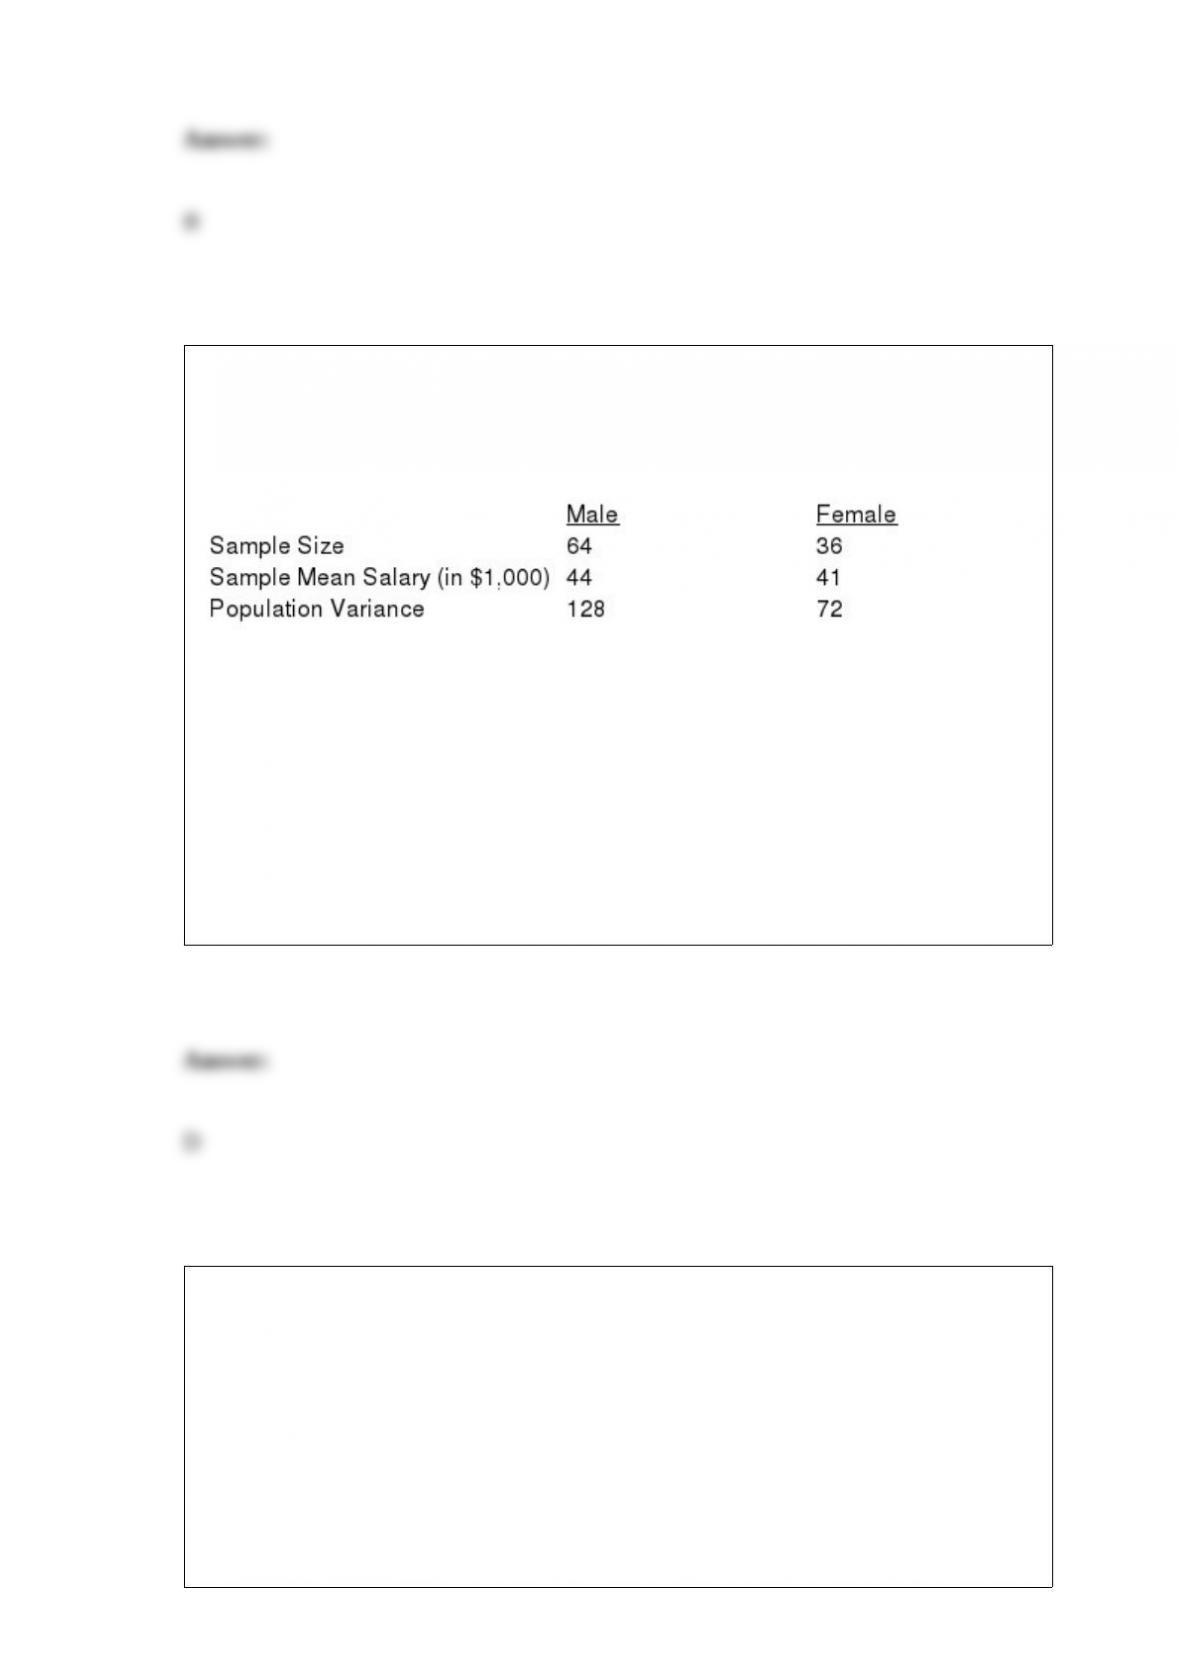
Exhibit 10-1
Salary information regarding male and female employees of a large company is shown
below.
Refer to Exhibit 10-1. At 95% confidence, the conclusion is the
a. average salary of males is significantly greater than females
b. average salary of males is significantly lower than females
c. salaries of males and females are equal
d. None of these alternatives is correct.
Exhibit 7-4
A random sample of 121 bottles of cologne showed an average content of 4 ounces. It is
known that the standard deviation of the contents (i.e., of the population) is 0.22
ounces.
Refer to Exhibit 7-4. In this problem the 0.22 is
a. a parameter
b. a statistic
c. the standard error of the mean
d. the average content of colognes in the long run
The degrees of freedom associated with a t distribution are a function of the
c. confidence coefficient
d. sample size
Which of the following is not a measure of dispersion?
a. the range
b. the 50th percentile
c. the standard deviation
d. the interquartile range
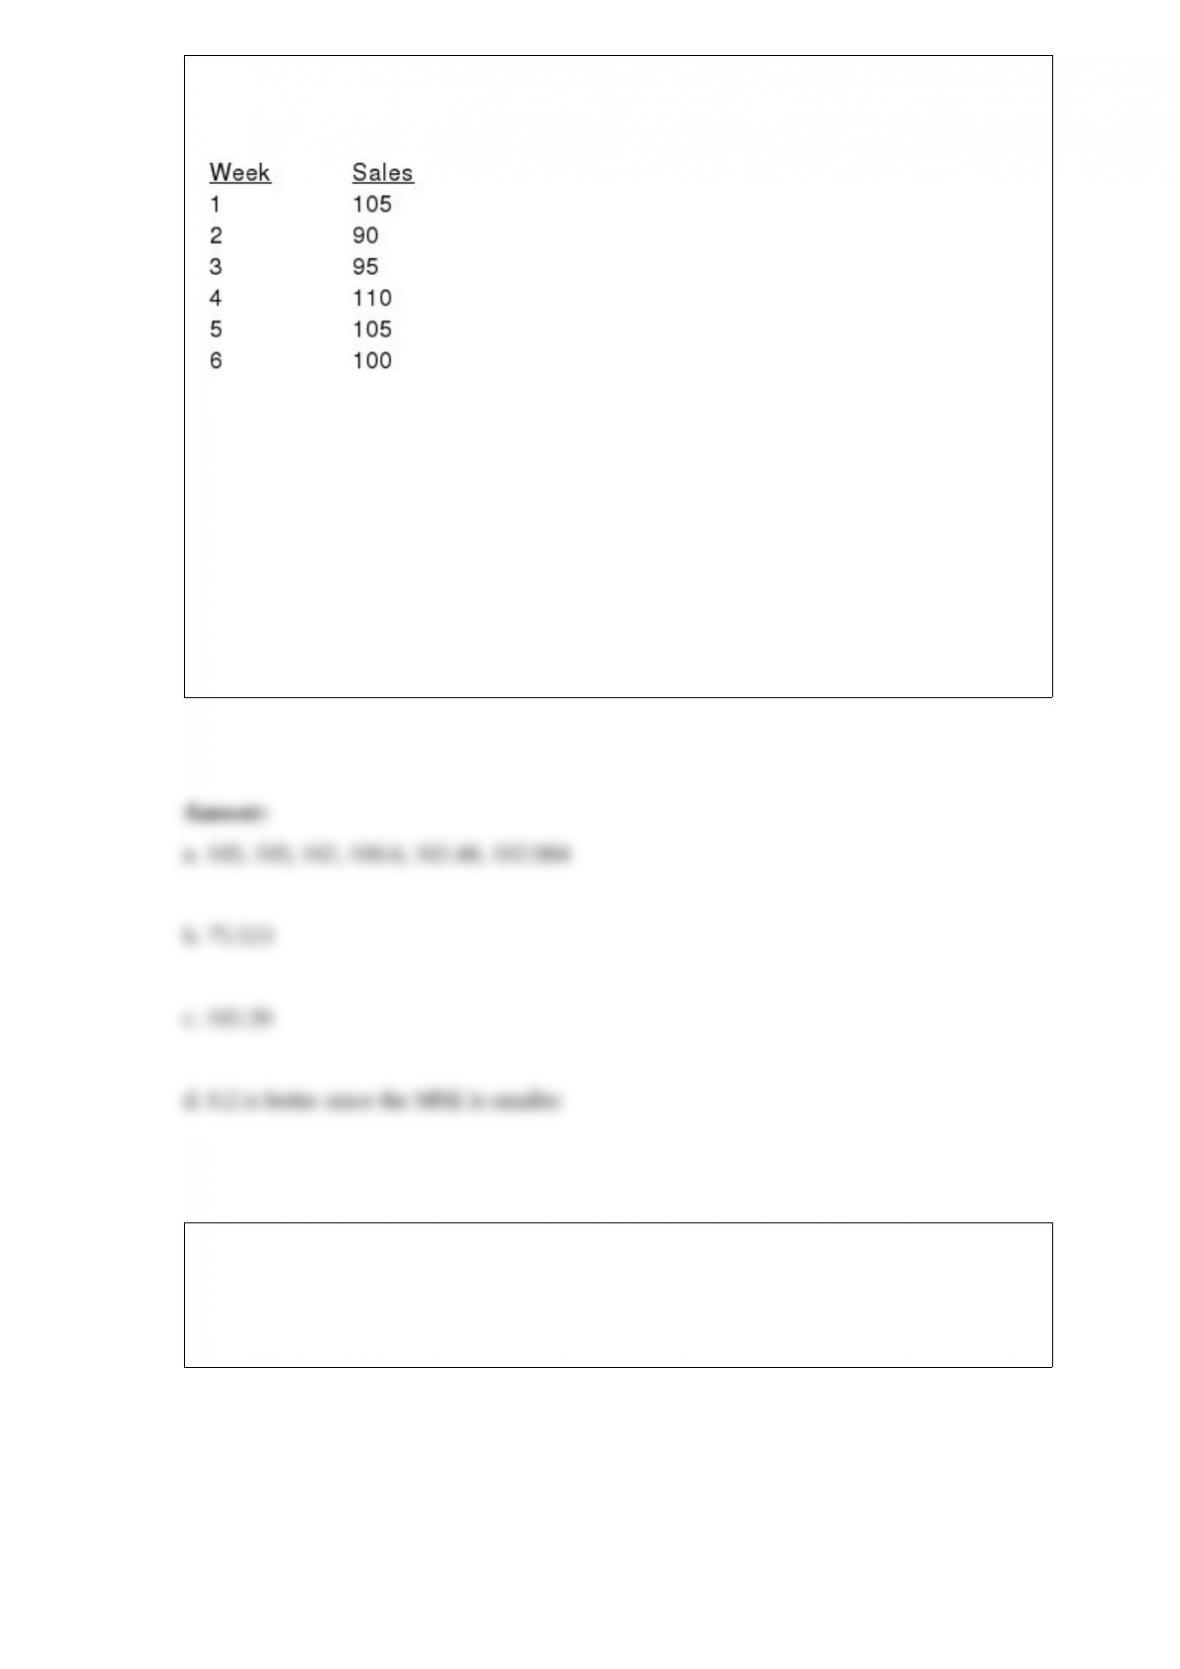
The following information has been collected on the sales of greeting cards for the past
6 weeks.
a. Produce exponential smoothing forecasts for the series using a smoothing constant of
.2.
b. Compute the mean square error for the forecasts produced with a smoothing constant
of .2.
c. What is the forecast of sales for week 7?
d. Is a smoothing constant of .2 or .3 better for the sales data? Explain.
Exhibit 5-4
A local bottling company has determined the number of machine breakdowns per
month and their respective probabilities as shown below.
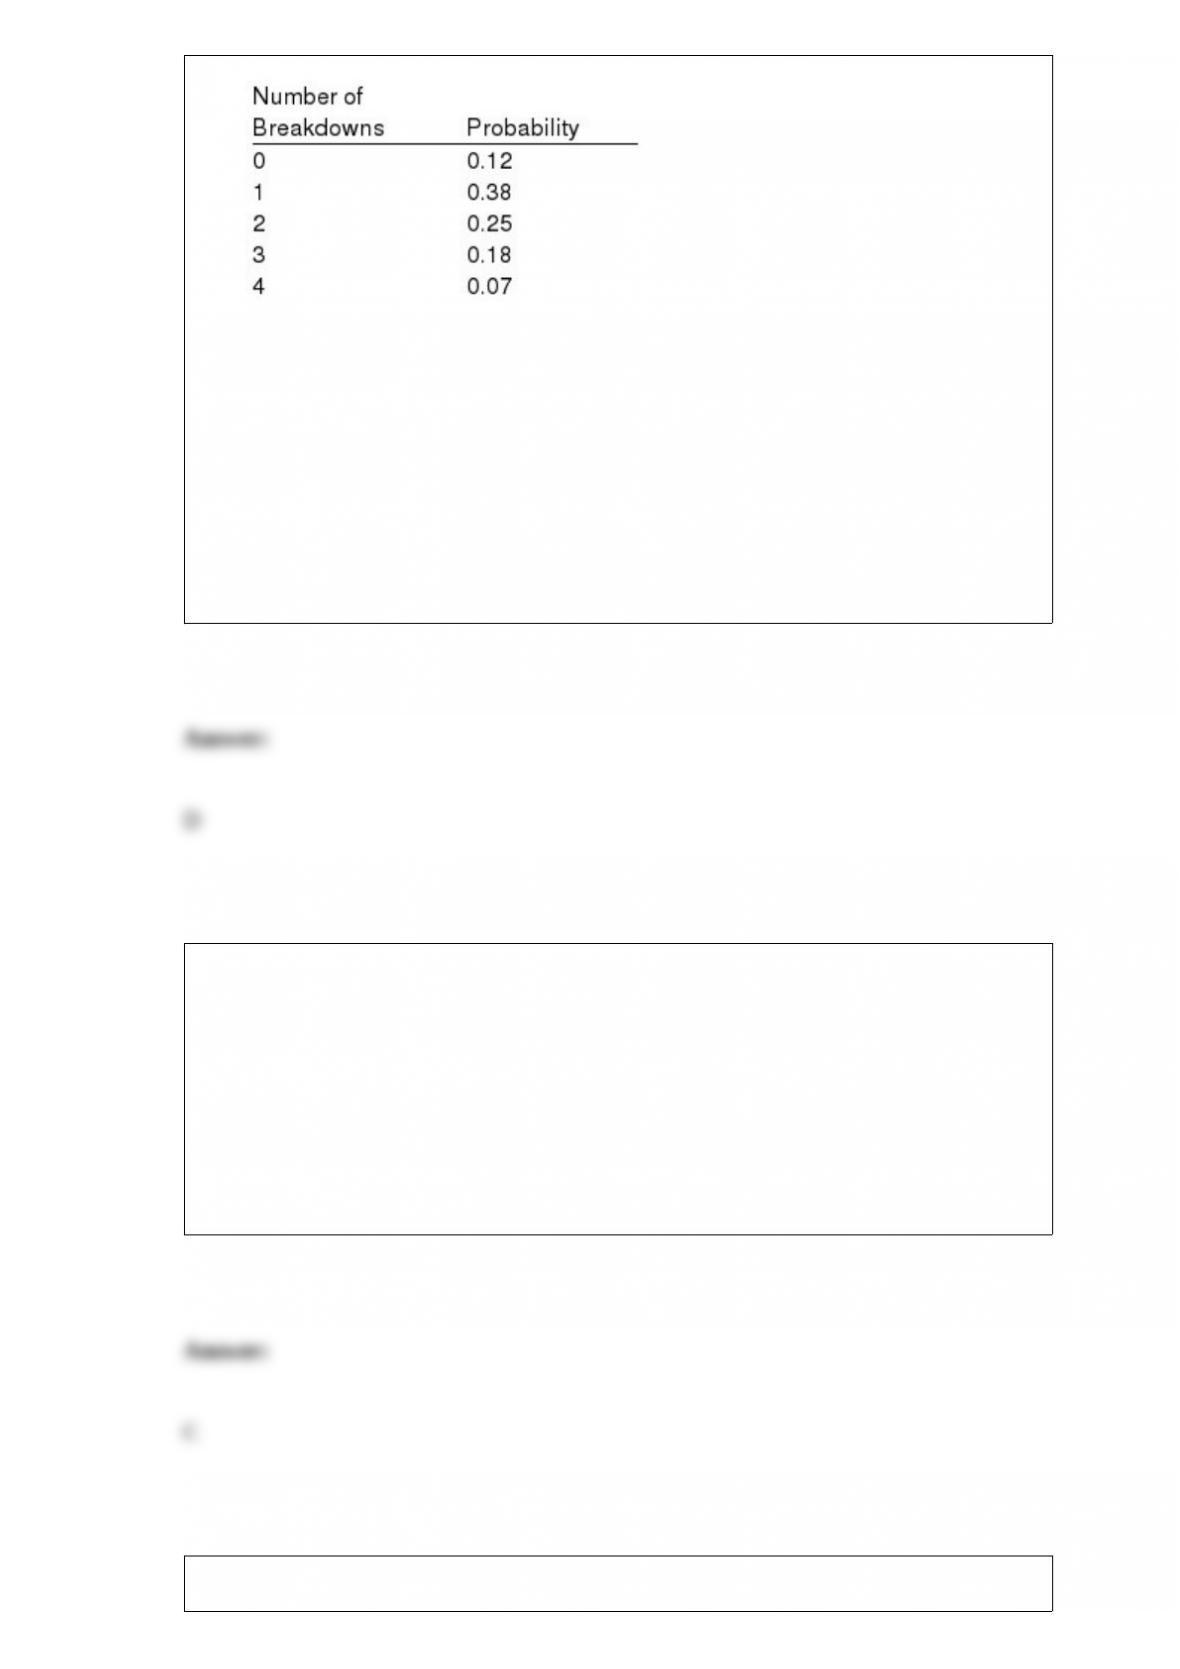
Refer to Exhibit 5-4. The probability of no breakdowns in a month is
a. 0.88
b. 0.00
c. 0.50
d. None of the alternative answers is correct.
A group of items such as incoming shipments of raw material is called
a. a sample plan
b. an incoming control
c. a lot
d. None of the other answers is correct.
Exhibit 10-1
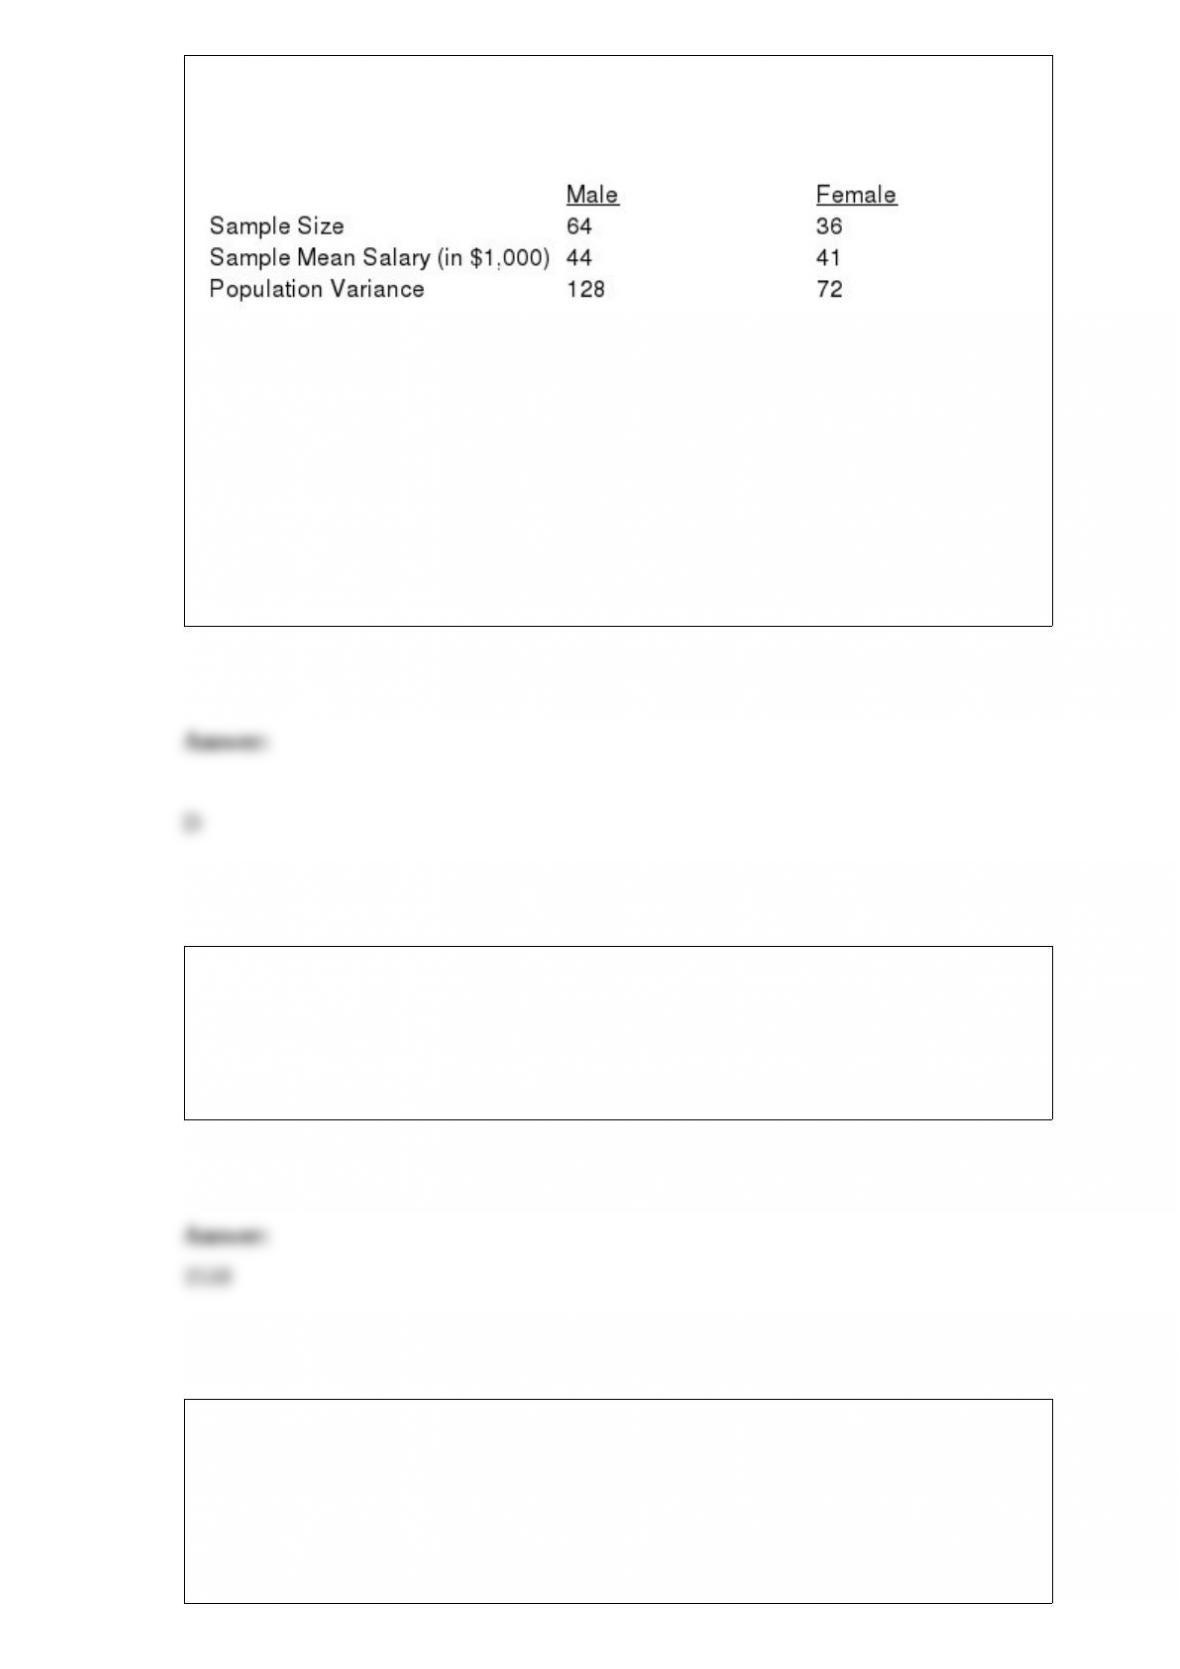
Salary information regarding male and female employees of a large company is shown
below.
Refer to Exhibit 10-1. The standard error for the difference between the two means is
a. 4
b. 7.46
c. 4.24
d. 2.0
A real estate agent wants to estimate the mean selling price of two-bedroom homes in a
particular area. She wants to estimate the mean selling price to within $10,000 with an
89.9% level of confidence. The standard deviation of selling prices is unknown but the
agent estimates that the highest selling price is $1,000,000 and the lowest is $50,000.
How many homes should be sampled?
The confidence associated with an interval estimate is called the
a. level of significance
b. degree of association

c. confidence level
d. precision