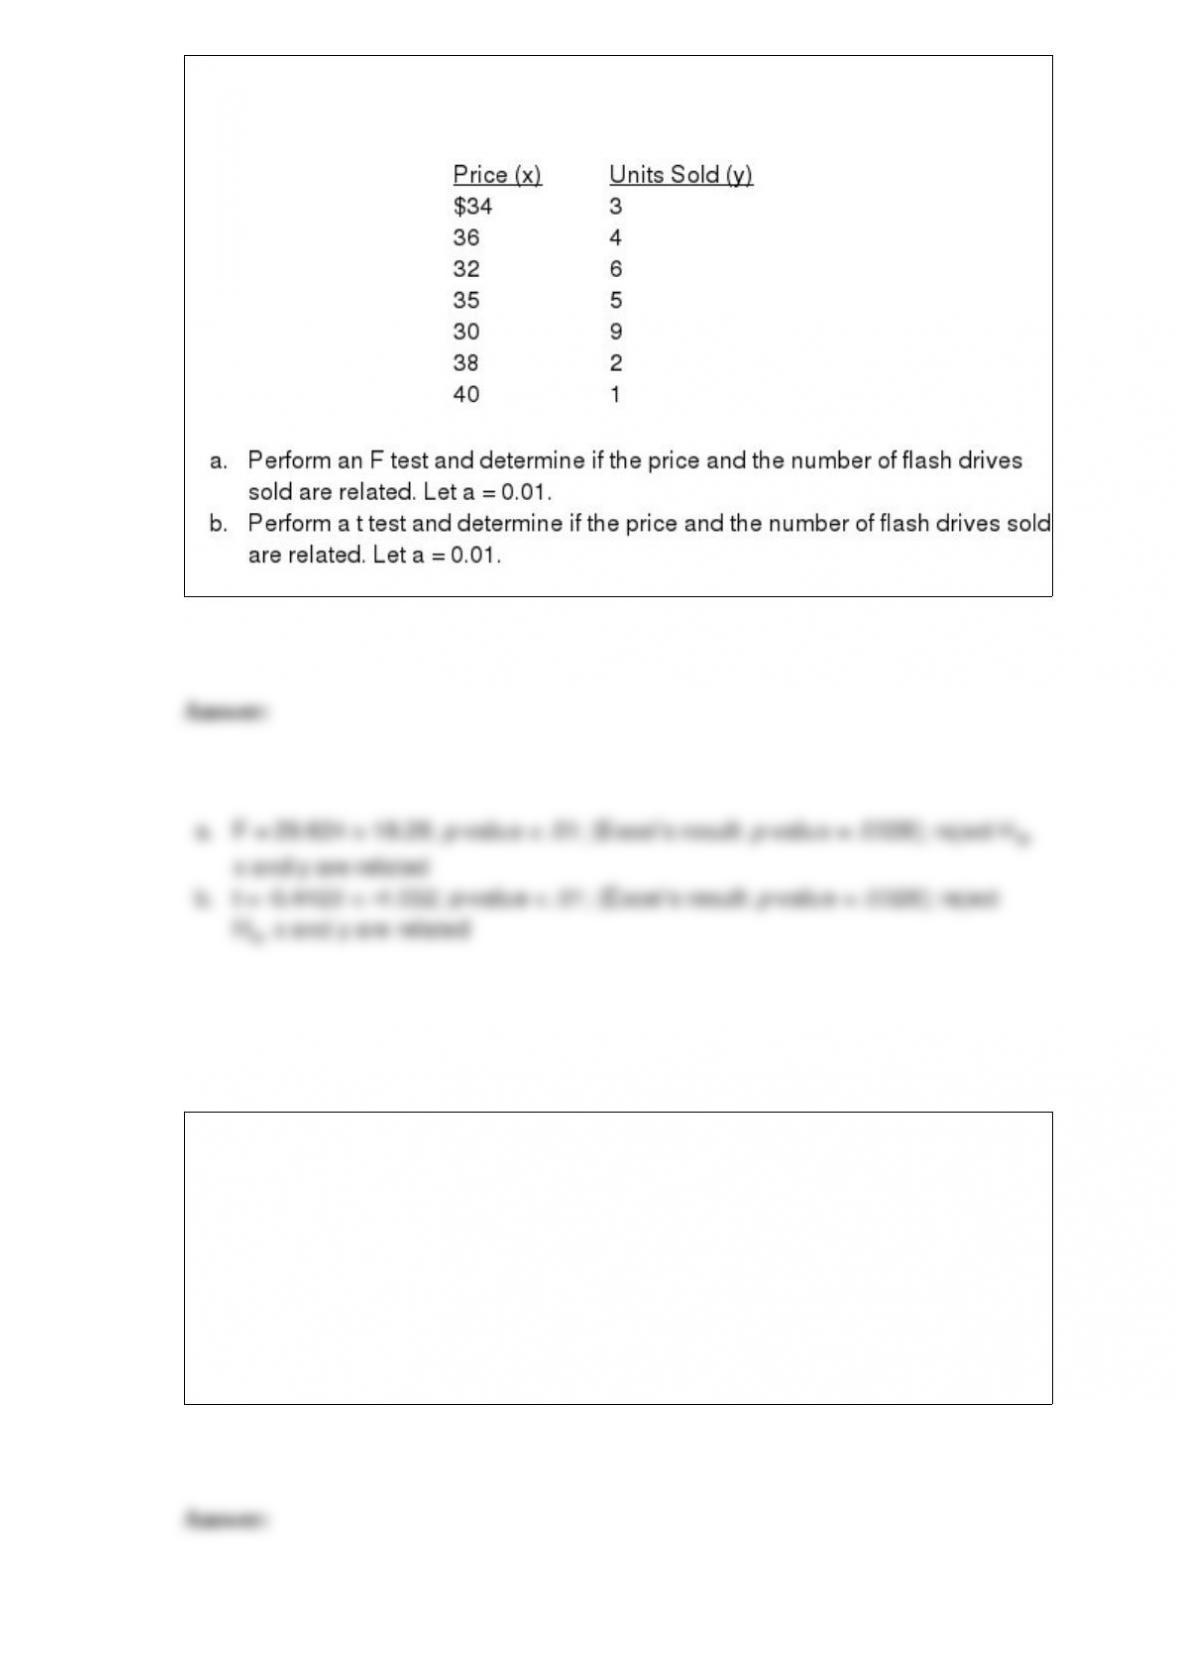
The following data represent the number of flash drives sold per day at a local computer
shop and their prices.
All the data collected in a particular study are referred to as the
a. census
b. inference
c. variable
d. data set

The required condition for using an ANOVA procedure on data from several
populations is that the
a. the selected samples are dependent on each other
b. sampled populations are all uniform
c. sampled populations have equal variances
d. sampled populations have equal means
The manager of the service department of a local car dealership has noted that the
service times of a sample of 30 new automobiles has a standard deviation of 6 minutes.
A 95% confidence interval estimate for the standard deviation of the service times for
all their new automobiles is
a. 16.05 to 45.72
b. 4.78 to 8.07
c. 2.93 to 6.31
d. 22.83 to 65.06
Exhibit 5-11
The random variable x is the number of occurrences of an event over an interval of ten
minutes. It can be assumed that the probability of an occurrence is the same in any two
time periods of an equal length. It is known that the mean number of occurrences in ten
minutes is 5.3.
Refer to Exhibit 5-11. The probability that there are 8 occurrences in ten minutes is
a. .0241
b. .0771
c. .1126
d. .9107
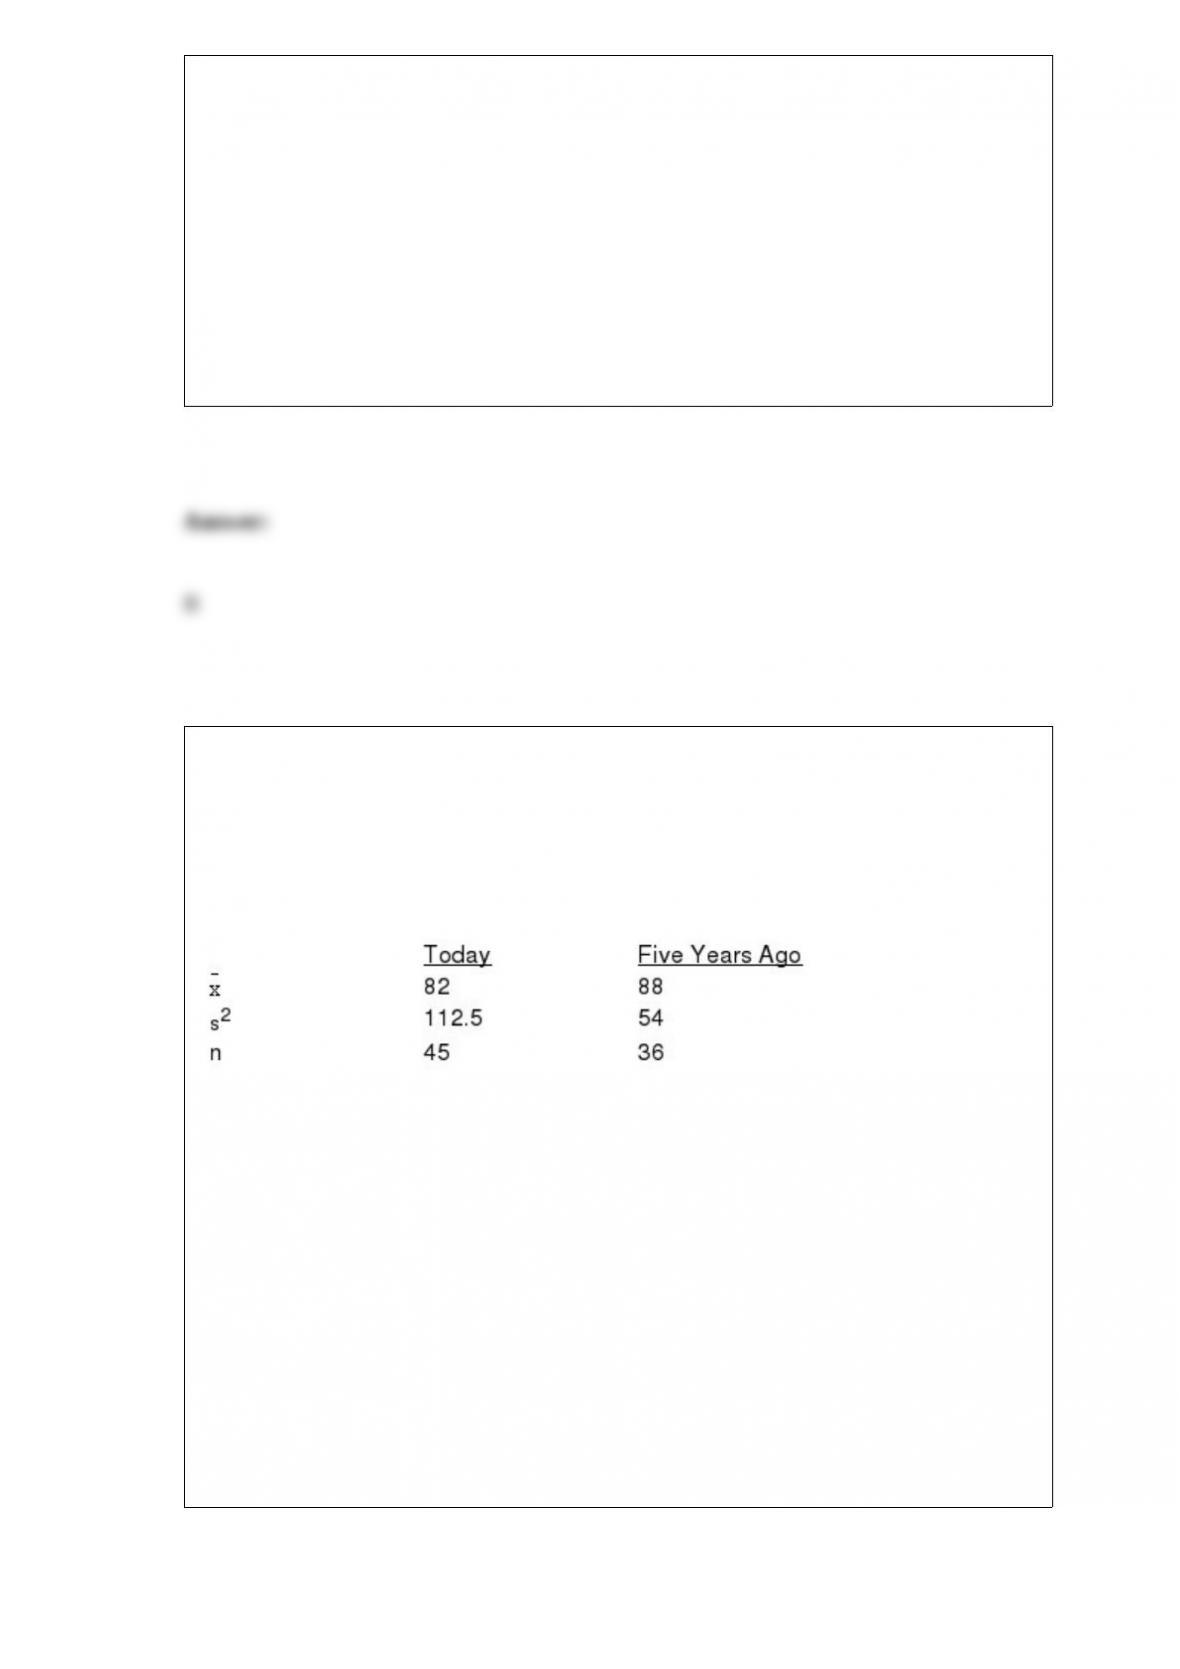
Exhibit 10-3
A statistics teacher wants to see if there is any difference in the abilities of students
enrolled in statistics today and those enrolled five years ago. A sample of final
examination scores from students enrolled today and from students enrolled five years
ago was taken. You are given the following information.
Refer to Exhibit 10-3. What is the conclusion that can be reached about the difference
in the average final examination scores between the two classes? (Use a .05 level of
significance.)
a. There is a statistically significant difference in the average final examination scores
between the two classes.
b. There is no statistically significant difference in the average final examination scores
between the two classes.
c. It is impossible to make a decision on the basis of the information given.
d. There is a difference, but it is not significant.

Exhibit 3-2
A researcher has collected the following sample data. The mean of the sample is 5.
Refer to Exhibit 3-2. The range is
a. 1
b. 2
c. 10
d. 12
The random variable for a chi-square distribution may assume
a. any value between -1 to 1
b. any value between – infinity to +infinity
c. any negative value
d. any value greater than zero
Exhibit 15-3

In a regression model involving 30 observations, the following estimated regression
equation was obtained:
= 17 + 4x1 – 3x2 + 8x3 + 8x4
For this model SSR = 700 and SSE = 100.
Refer to Exhibit 15-3. The conclusion is that the
a. model is not significant
b. model is significant
c. slope of x1 is significant
d. slope of x2 is significant
A measure of goodness of fit for the estimated regression equation is the
a. multiple coefficient of determination
b. mean square due to error
c. mean square due to regression
d. sample size
The probability of the intersection of two mutually exclusive events
a. can be any value between 0 to 1

b. must always be equal to 1
c. must always be equal to 0
d. can be any positive value
Exhibit 3-2
A researcher has collected the following sample data. The mean of the sample is 5.
Refer to Exhibit 3-2. The variance is
a. 80
b. 4.062
c. 13.2
d. 16.5
When sampling without replacement, the probability of obtaining a certain sample is
best given by a
a. hypergeometric distribution
b. binomial distribution
c. Poisson distribution
d. normal distribution

Excel’s __________ can be used to construct a frequency distribution for categorical
data.
a. DISTRIBUTION function
b. SUM function
c. FREQUENCY function
d. COUNTIF function
If A and B are mutually exclusive events with P(A) 0.3 and P(B) 0.5, then P(A B)
a. 0.30
b. 0.15
c. 0.00
d. 0.20
Exhibit 16-4
In a laboratory experiment, data were gathered on the life span (y in months) of 33 rats,
units of daily protein intake (x1), and whether or not agent x2 (a proposed life extending

agent) was added to the rats diet (x2 = 0 if agent x2 was not added, and x2 = 1 if agent
was added.) From the results of the experiment, the following regression model was
developed.
= 36 + 0.8x1 – 1.7x2
Also provided are SSR = 60 and SST = 180.
Refer to Exhibit 16-4. The degrees of freedom associated with SSR are
a. 3
b. 33
c. 32
d. 30
Exhibit 1-2
In a sample of 3,200 registered voters, 1,440, or 45%, approve of the way the President
is doing his job.
Refer to Exhibit 1-2. The 45% approval is an example of
a. a sample
b. descriptive statistics
c. statistical inference
d. a population
Excel’s NORM.S.INV function can be used to compute

a. cumulative probabilities for a standard normal z value
b. the standard normal z value given a cumulative probability
c. cumulative probabilities for a normally distributed x value
d. the normally distributed x value given a cumulative probability
A form of acceptance sampling in which more than one sample or stage is used is called
a
a. single-sample plan
b. multiple-sampling plan
c. multinomial sampling plan
d. None of the other answers is correct.
Exhibit 7-2
Four hundred registered voters were randomly selected asked whether gun laws should
be changed. Three hundred said “yes,” and one hundred said “no.”
Refer to Exhibit 7-2. The point estimate of the proportion in the population who will
respond “yes” is
a. 300
b. approximately 300
c. 0.75
d. 0.25
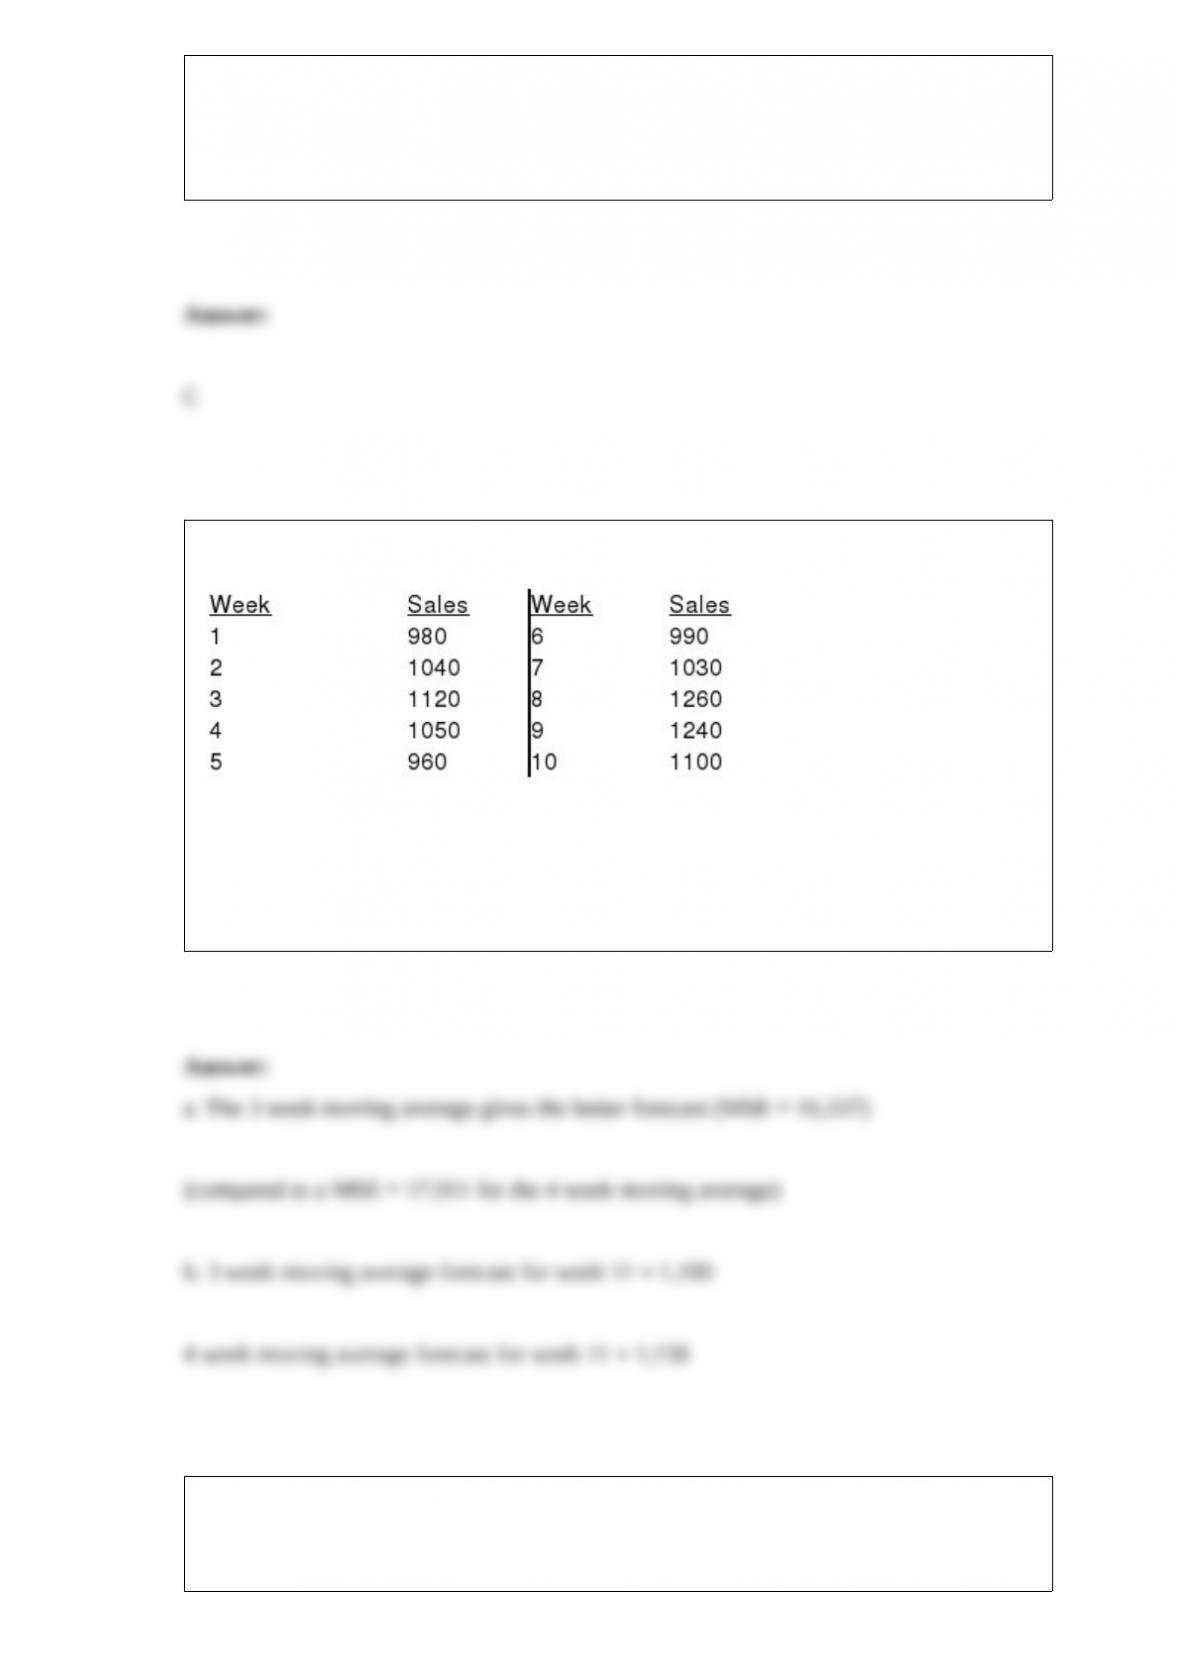
Weekly sales of the Weber Dicamatic food processor for the past ten weeks have been:
a. Determine, on the basis of minimizing the mean square error, whether a three period
or four period simple moving average model gives a better forecast for this problem.
b. For each model, forecast sales for week 11.
The average starting salary for this year’s graduates of a large community college is
$30,000 with a standard deviation of $8,000. Furthermore, it is known that the starting
salaries are normally distributed.

a. What is the probability that a randomly selected graduate of this community college
will have a starting salary of at least $30,400?
b. Individuals with starting salaries of less than $15,600 receive a low income tax break.
What percentage of the graduates will receive the tax break?
c. What are the minimum and the maximum starting salaries of the middle 95% of the
graduates?
d. If 303 of the recent graduates have salaries of at least $43,120, how many students
graduated this year from this community college?
The practice of concluding ‘œdo not reject H0‘ is preferred over ‘œaccept H0‘ when we
a. are conducting a one-tailed test
b. are testing the validity of a claim
c. have an insufficient sample size
d. have not controlled for the Type II error

Below you are given the examination scores of 20 students.
a. Construct a frequency distribution for this data. Let the first class be 50 –
59 and draw a histogram.
b. Construct a cumulative frequency distribution.
c. Construct a relative frequency distribution.
d. Construct a cumulative relative frequency distribution.
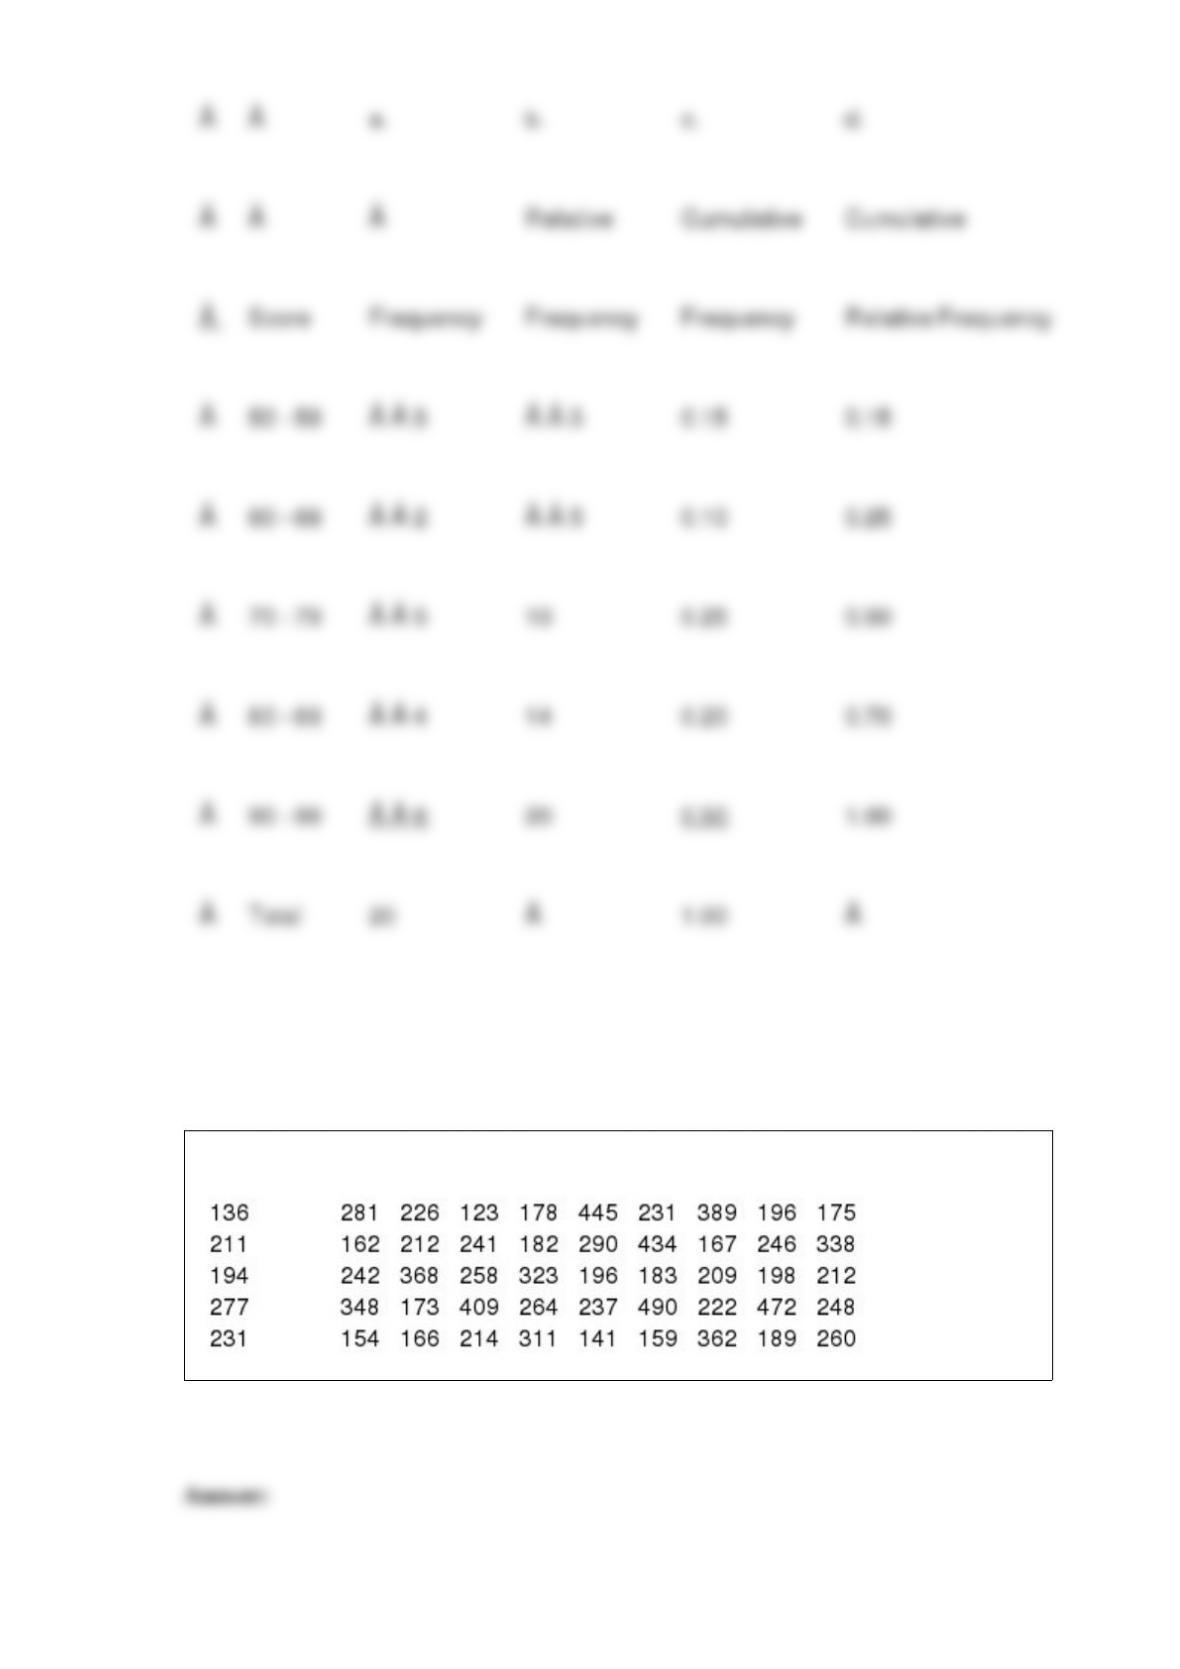
Develop a stretched stem-and-leaf display for the data set below, using a leaf unit of 10.
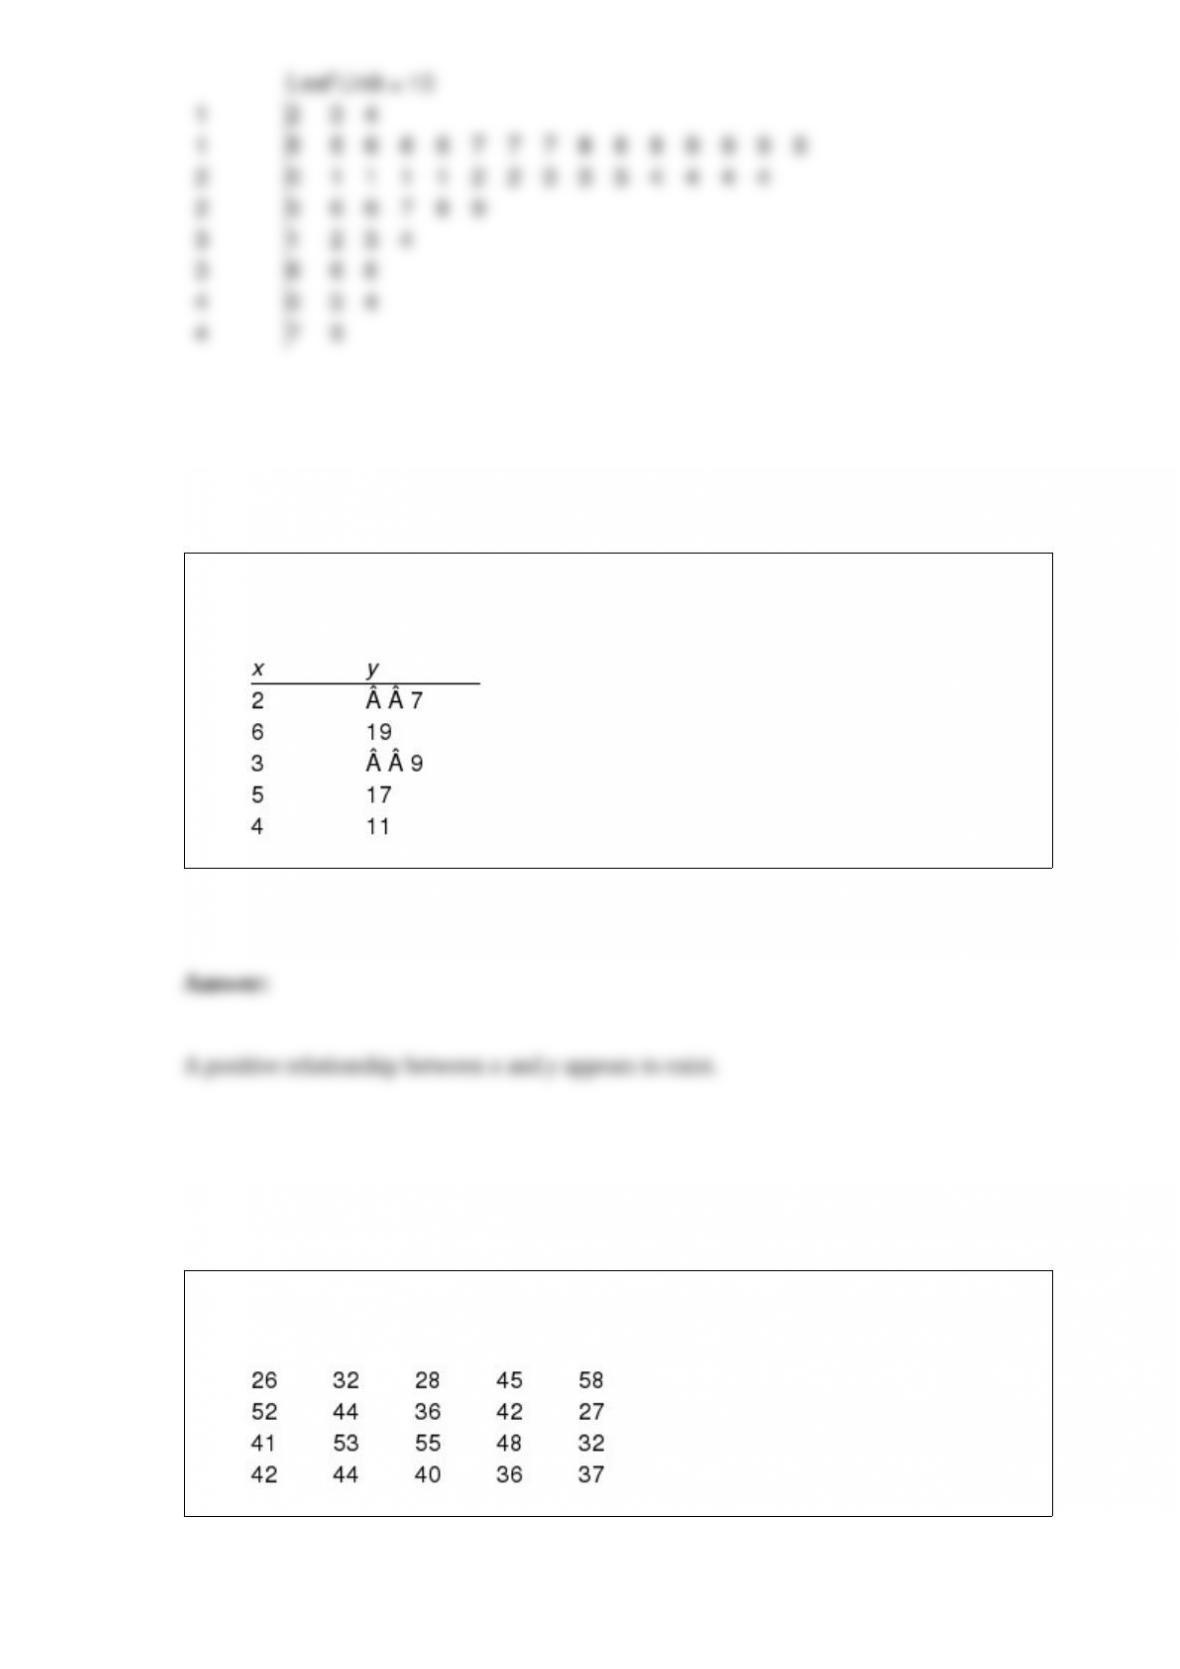
For the following observations, plot a scatter diagram and indicate what kind of
relationship (if any) exist between x and y.
You are given the following data on the ages of employees at a company. Construct a
stem-and-leaf display. Specify the leaf unit for the display.
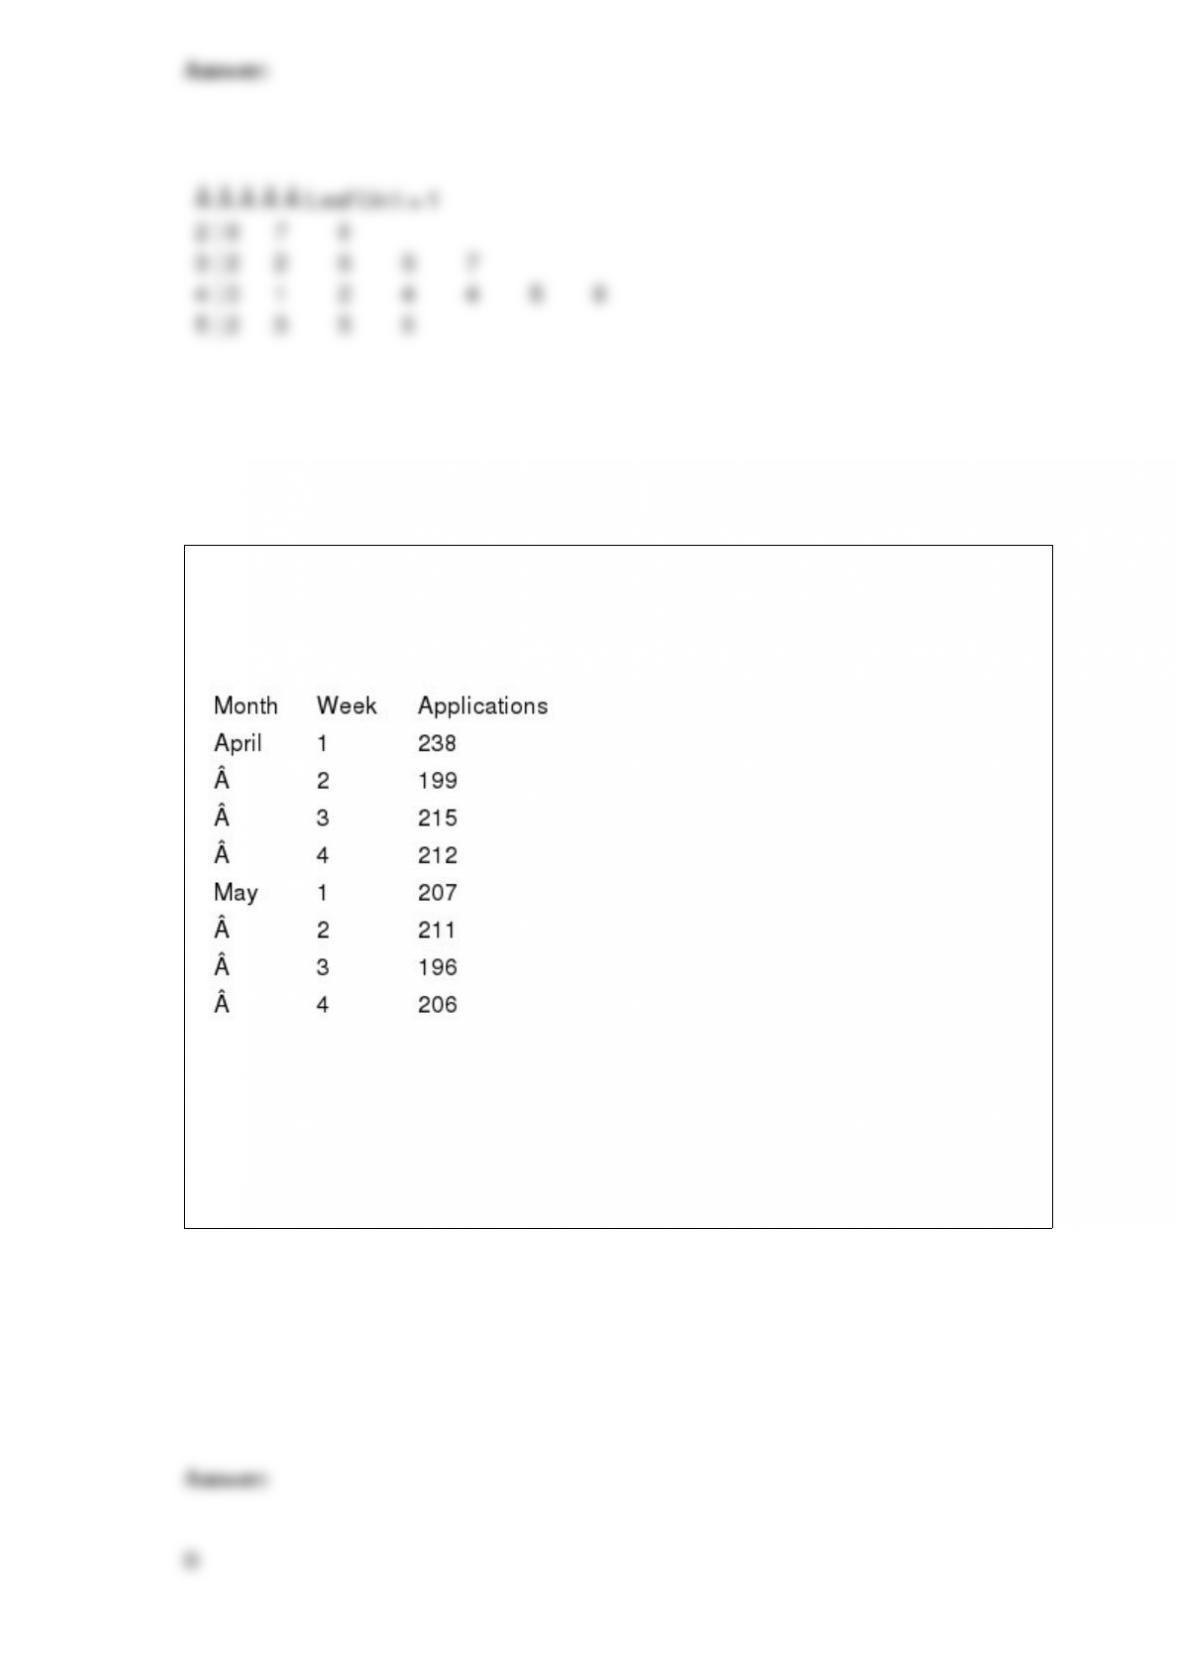
Exhibit 17-5
State Division of Motor Vehicles (DMV) statistics show the rate of new driver’s license
applications to be as shown below:
Refer to Exhibit 17-5. Using a 3-week moving average, what is the forecast for the 1st
week in April?
201.00
204.33
206.00
217.33

In a sample of 120 people, 50 indicated that they prefer domestic automobiles, 60 said
they prefer foreign-made cars, and 10 indicated no difference in their preference. At a
0.05 level of significance, determine if there is evidence of a significant difference in
the preferences for the two makes of automobiles.
You are given the following information obtained from a random sample of 4
observations taken from a large, normally distributed population.
Construct a 95% confidence interval for the mean of the population.