20
22
18
12
12
14
20
16
17
18
12
14
a.
State the null and alternative hypotheses.
b.
Calculate the test statistic.
c.
What would you advise the dietician about the effectiveness of the three diets? Use a .05 level
of significance.
19. Allied Corporation wants to increase the productivity of its line workers. Four different programs have
been suggested to help increase productivity. Twenty employees, making up a sample, have been
randomly assigned to one of the four programs and their output for a day’s work has been recorded.
You are given the results below.
Program A
Program B
Program C
Program D
150
150
185
175
130
120
220
150
120
135
190
120
180
160
180
130
145
110
175
175
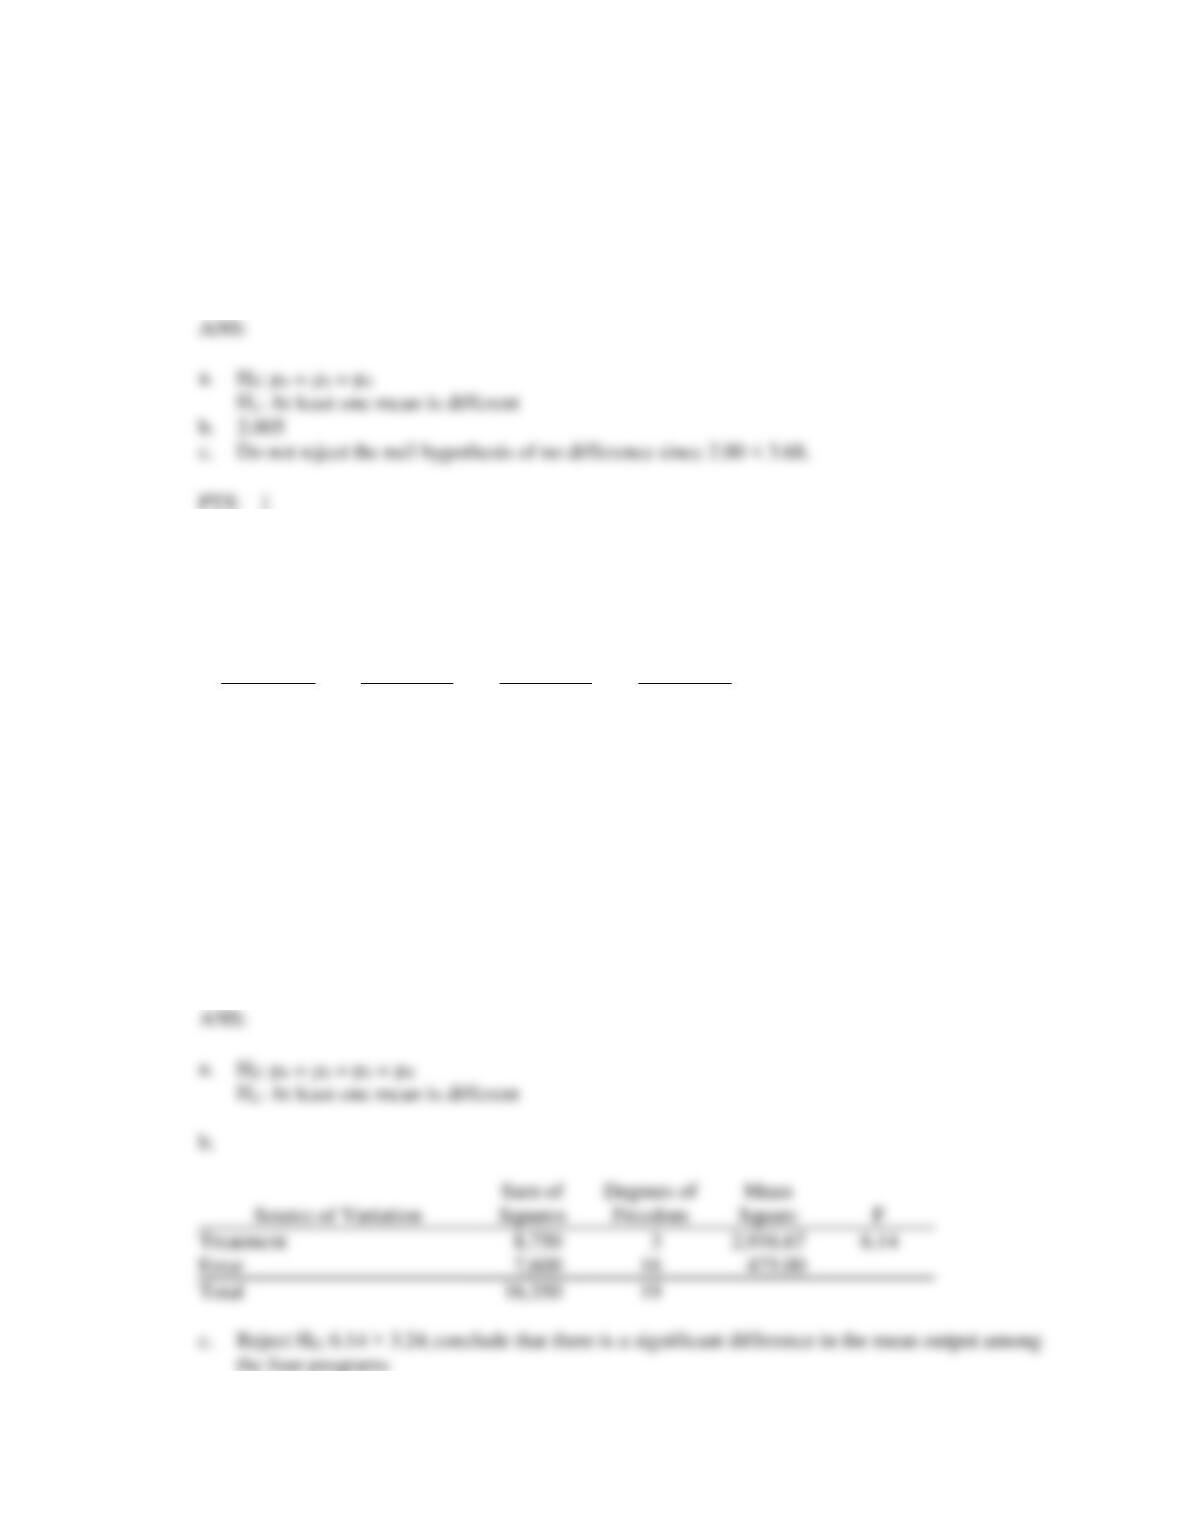
a.
State the null and alternative hypotheses.
b.
Construct an ANOVA table.
c.
As the statistical consultant to Allied, what would you advise them? Use a .05 level of
significance.
d.
Use Fisher’s LSD procedure and determine which population mean (if any) is different from
the others. Let = .05.
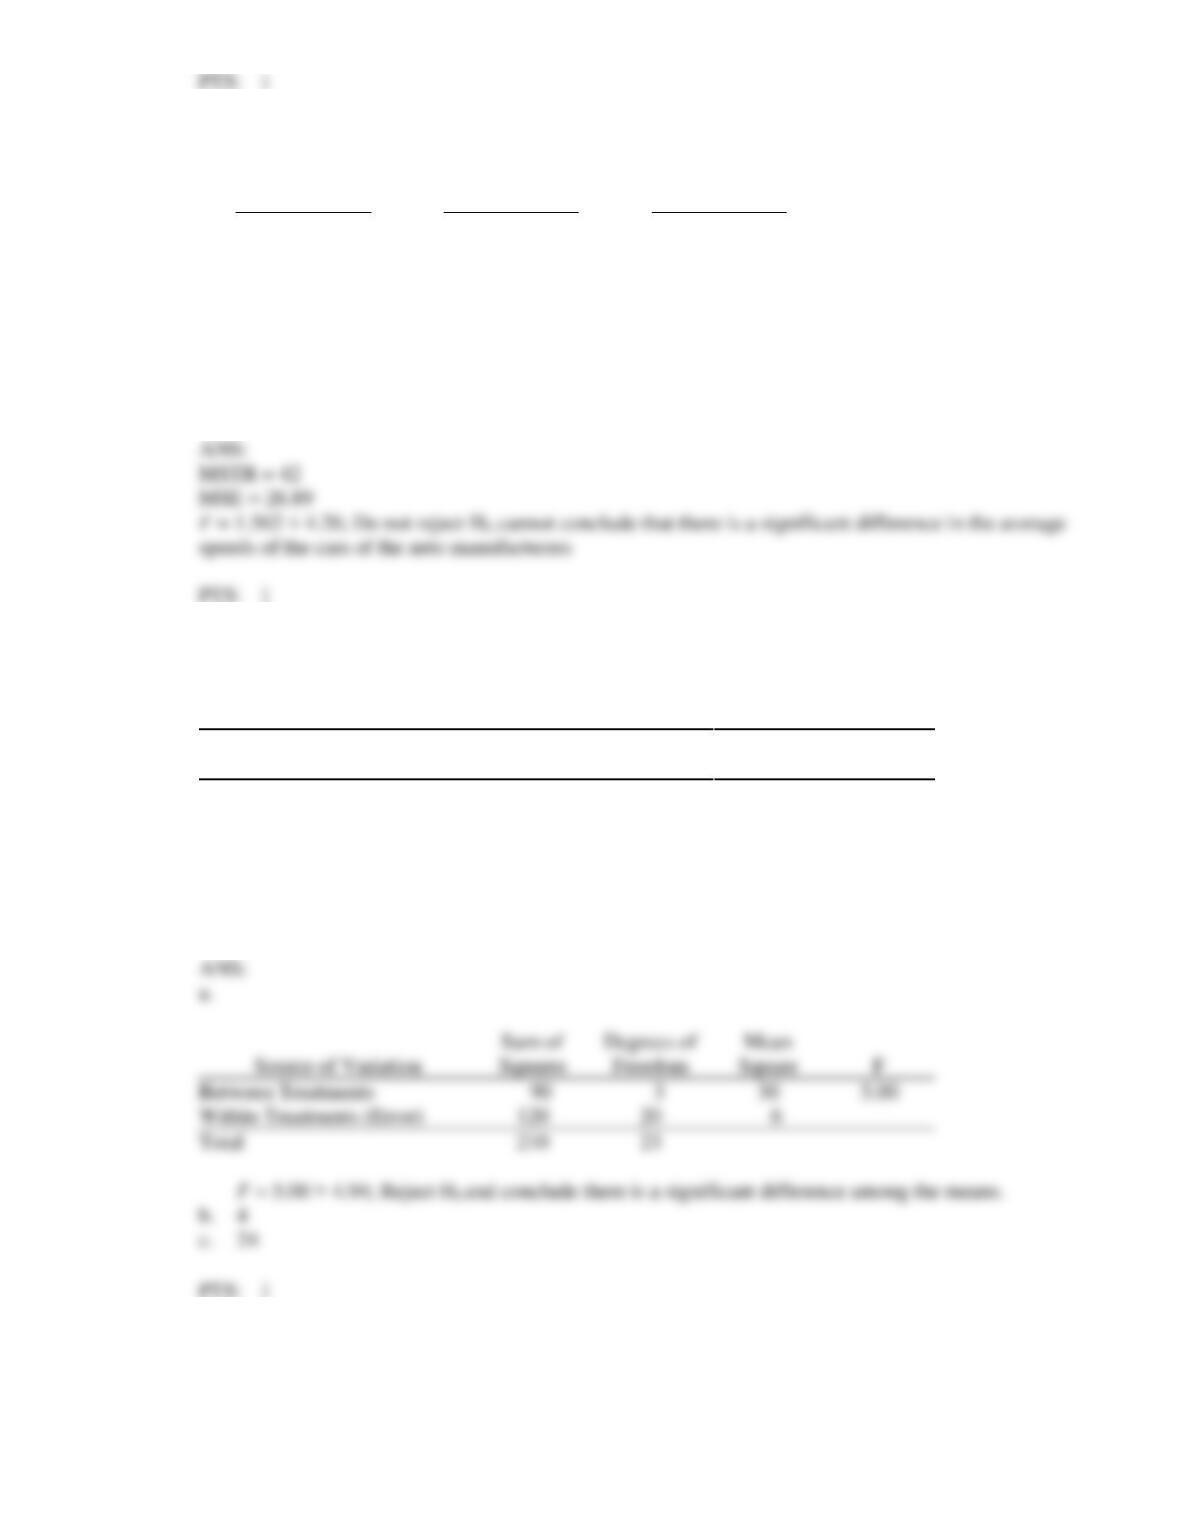
Treatment
Error
Total
b.
2.005
c.
Do not reject the null hypothesis of no difference since 2.00 < 3.68.
20. The marketing department of a company has designed three different boxes for its product. It wants to
determine which box will produce the largest amount of sales. Each box will be test marketed in five
different stores for a period of a month. Below you are given the information on sales.
Store 1
Store 2
Store 3
Store 4
Store 5
Box 1
210
230
190
180
190
Box 2
195
170
200
190
193
Box 3
295
275
290
275
265
a.
State the null and alternative hypotheses.
b.
Construct an ANOVA table.
c.
What conclusion do you draw?
d.
Use Fisher’s LSD procedure and determine which mean (if any) is different from the others.
Let = 0.01.
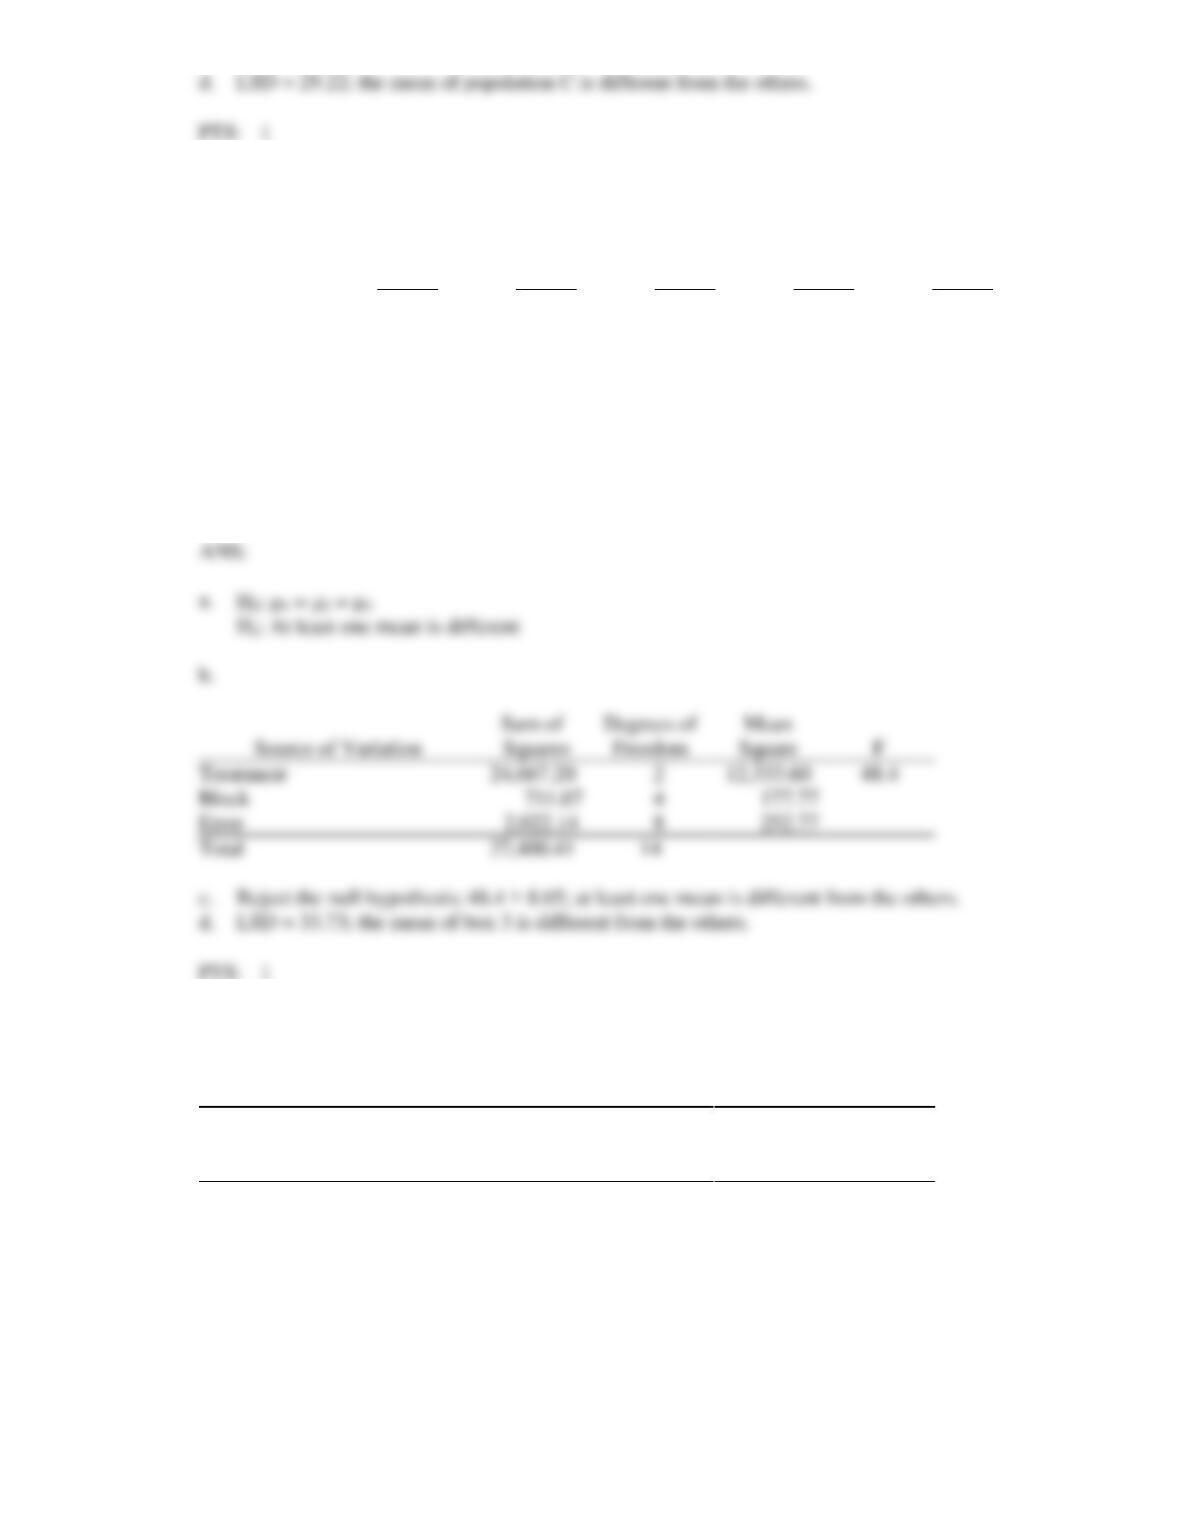
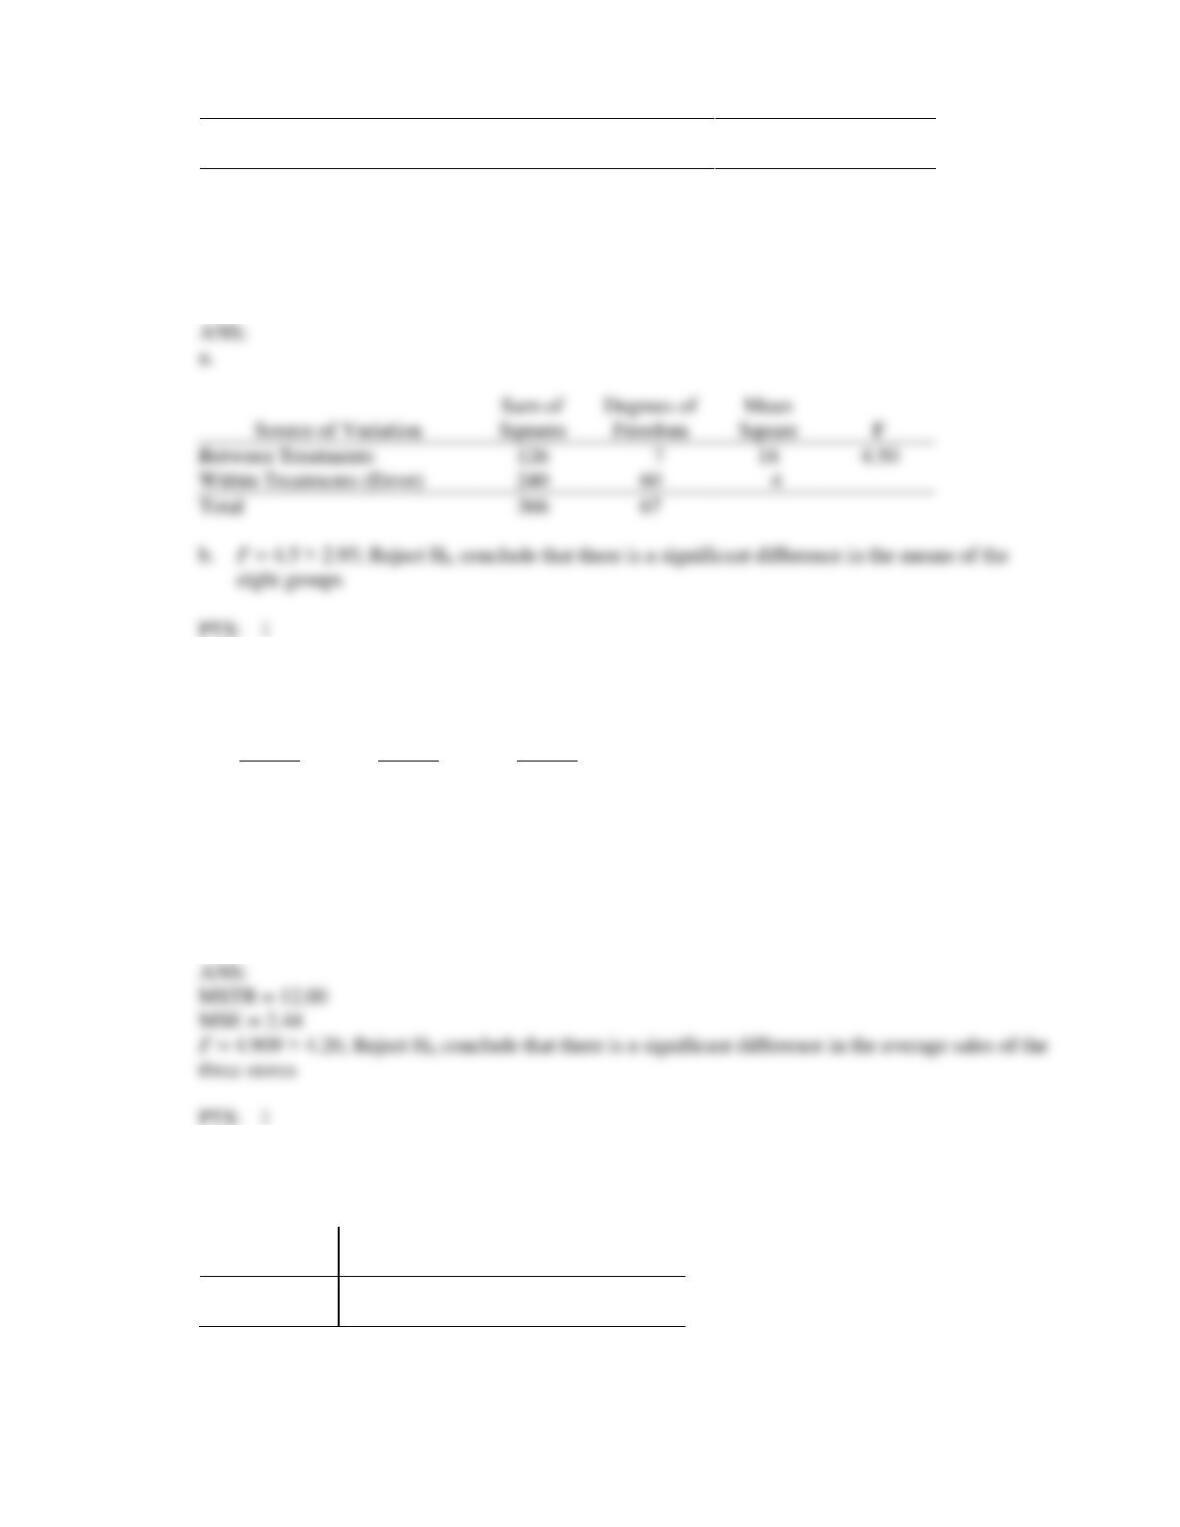
b.
Treatment
Error
Total
c.
Reject the null hypothesis; 48.4 > 8.65; at least one mean is different from the others.
d.
LSD = 33.73; the mean of box 3 is different from the others.
21. You are given an ANOVA table below with some missing entries.
Source of Variation
Sum of
Squares
Degrees of
Freedom
Mean
Square
F
Between Treatments
3
1,198.8
Between Blocks
5,040
6
840.0
Error
5,994
18
Total
27
a.
State the null and alternative hypotheses.
b.
Compute the sum of squares between treatments.
c.
Compute the mean square due to error.
d.
Compute the total sum of squares.
e.
Compute the test statistic F.
f.
Test the null hypothesis stated in Part a at the 1% level of significance. Be sure to state your
d.
LSD = 29.22; the mean of population C is different from the others.
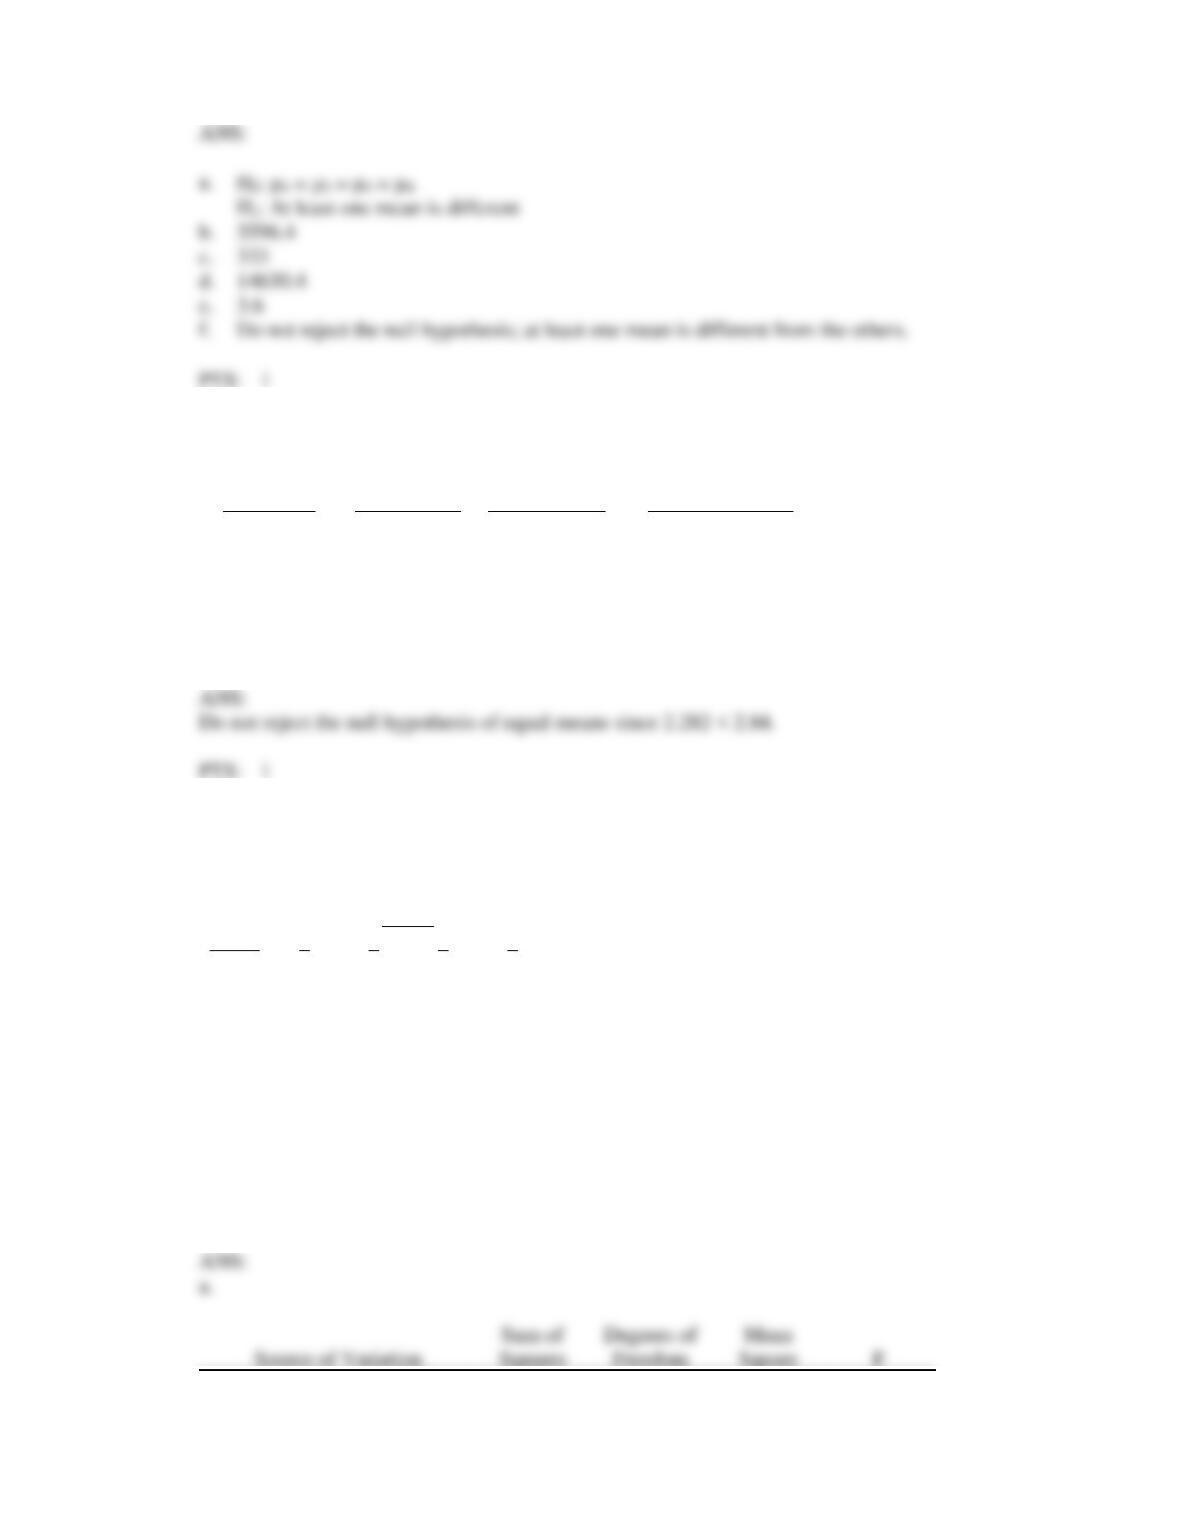
conclusion.
22. For four populations, the population variances are assumed to be equal. Random samples from each
population provide the following data.
Population
Sample Size
Sample Mean
Sample Variance
1
11
40
23.4
2
11
35
21.6
3
11
39
25.2
4
11
37
24.6
Using a .05 level of significance, test to see if the means for all four populations are the same.
23. A research organization wishes to determine whether four brands of batteries for transistor radios
perform equally well. Three batteries of each type were randomly selected and installed in the three
test radios. The number of hours of use for each battery is given below.
Brand
Radio
1
2
3
4
A
25
27
20
28
B
29
38
24
37
C
21
28
16
19
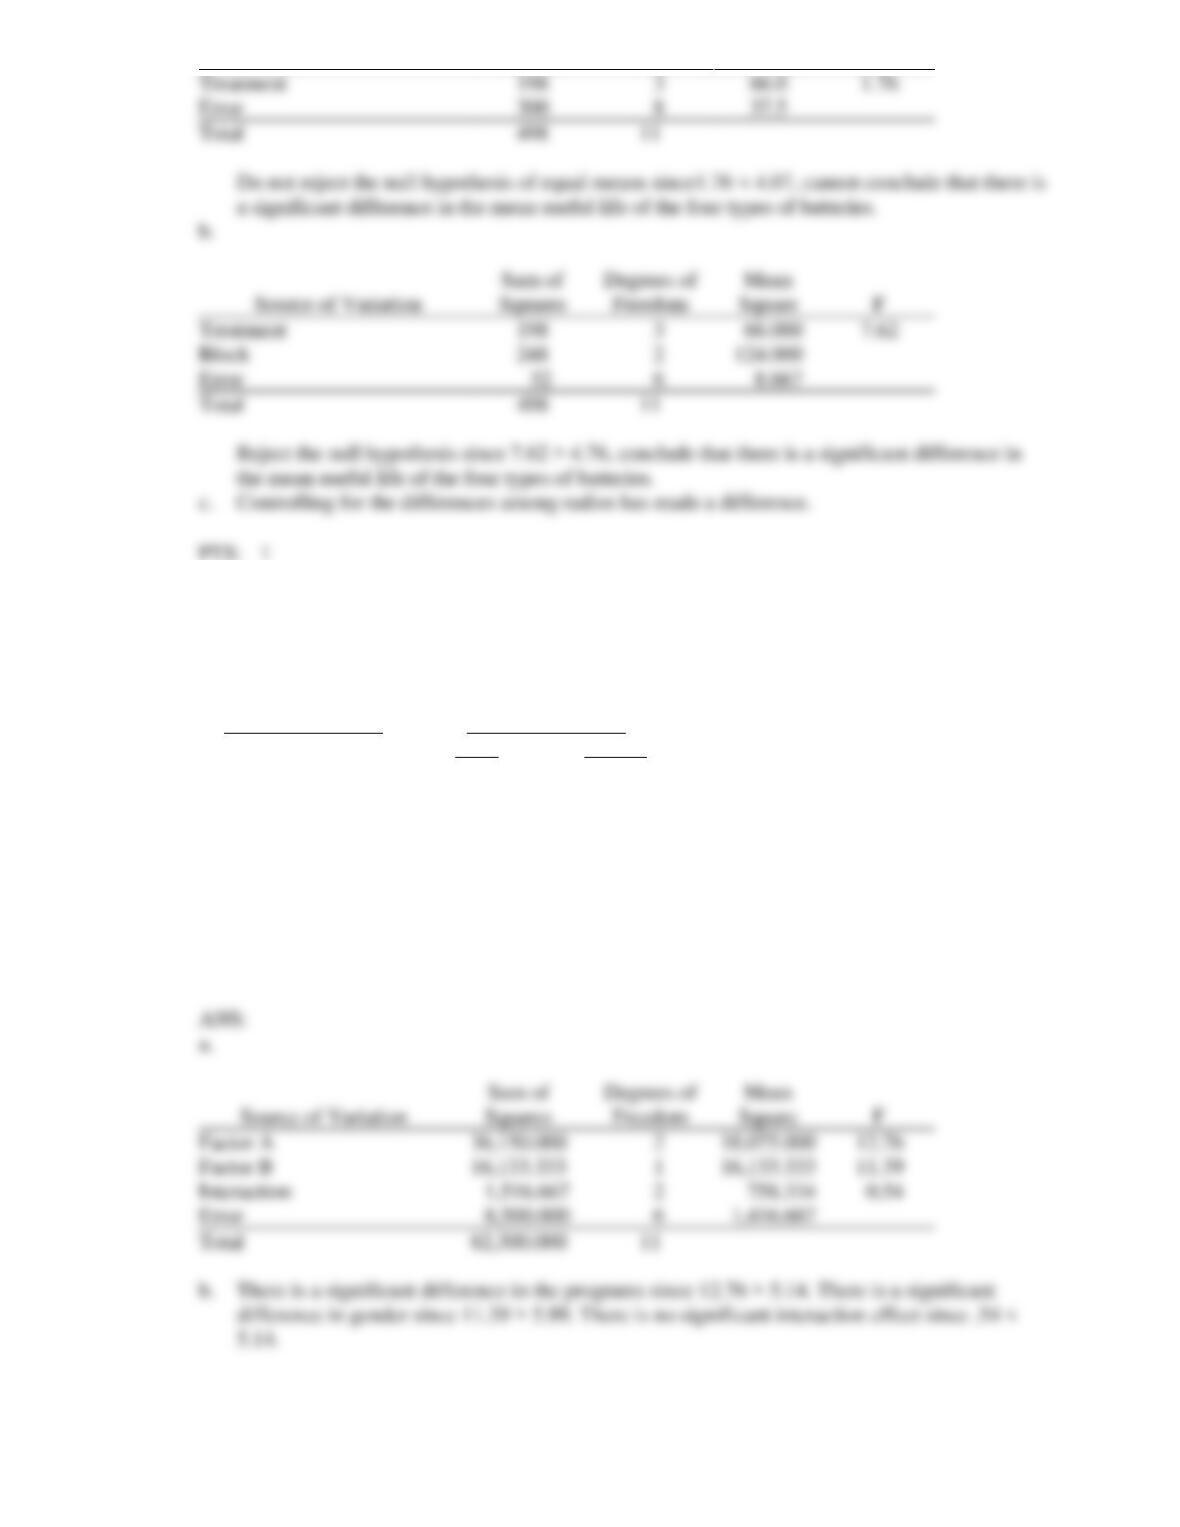
a.
Use the analysis of variance procedure for completely randomized designs to determine
whether there is a significant difference in the mean useful life of the four types of batteries.
(Ignore the fact that there are different test radios.) Use the .05 level of significance and be sure
to construct the ANOVA table.
b.
Now consider the three different test radios and carry out the analysis of variance procedure for
a randomized block design. Include the ANOVA table.
c.
Compare the results in Parts a and b.
Squares
Freedom
b.
3596.4
333
d.
14630.4
3.6
Do not reject the null hypothesis; at least one mean is different from the others.
24. Employees of MNM Corporation are about to undergo a retraining program. Management is trying to
determine which of three programs is the best. They believe that the effectiveness of the programs may
be influenced by gender. A factorial experiment was designed. You are given the following
information.
Factor A: Program
Factor B: Gender
Male
Female
Program 1
320
380
240
300
Program 2
160
240
180
210
Program 3
240
360
290
380
a.
Set up the ANOVA table.
b.
What advice would you give MNM? Use a .05 level of significance.
Factor A
Factor B
Interaction
Error
Total
Treatment
Error
300
Total
b.
Treatment
198
Block
Error
Total
the mean useful life of the four types of batteries.
Controlling for the differences among radios has made a difference.
25. The final examination grades of random samples of students from three different classes are shown
below.
Class A
Class B
Class C
92
91
85
85
85
93
96
90
82
95
86
84
At the = .05 level of significance, is there any difference in the mean grades of the three classes?
26. Individuals were randomly assigned to three different production processes. The hourly units of
production for the three processes are shown below.
Production Process
Process 1
Process 2
Process 3
33
33
28
30
35
36
28
30
30
29
38
34
Use the analysis of variance procedure with = 0.05 to determine if there is a significant difference in
the mean hourly units of production for the three types of production processes.
27. Random samples of employees from three different departments of MNM Corporation showed the
following yearly incomes (in $1,000).
Department A
Department B
Department C
40
46
46
37
41
40
43
43
41
41
33
48
35
41
39
38
42
45
At = .05, test to determine if there is a significant difference among the average incomes of the
employees from the three departments.
28. The heating bills for a selected sample of houses using various forms of heating are given below
(values are in dollars).
Gas Heated Homes
Central Electric
Heat Pump
83
90
81
80
88
83
82
87
80
83
82
82
82
83
79
At = 0.05, test to see if there is a significant difference among the average bills of the homes.
29. Three universities in your state decided to administer the same comprehensive examination to the
recipients of MBA degrees from the three institutions. From each institution, MBA recipients were
randomly selected and were given the test. The following table shows the scores of the students from
each university.
Northern University
Central University
Southern University
75
85
80
80
89
81
84
86
84
85
88
79
81
83
85
At = 0.01, test to see if there is any significant difference in the average scores of the students from
the three universities. (Note that the sample sizes are not equal.)
30. The three major automobile manufacturers have entered their cars in the Indianapolis 500 race. The
speeds of the tested cars are given below.
Manufacturer A
Manufacturer B
Manufacturer C
180
177
175
175
180
176
179
167
177
176
172
190
At = .05, test to see if there is a significant difference in the average speeds of the cars of the auto
manufacturers.
31. Part of an ANOVA table is shown below.
Source of Variation
Sum of
Squares
Degrees of
Freedom
Mean
Square
F
Between Treatments
90
3
_____?
_____?
Within Treatments (Error)
120
20
_____?
Total
_____?
_____?
a.
Compute the missing values and fill in the blanks in the above table. Use = .01 to determine
if there is any significant difference among the means.
b.
How many groups have there been in this problem?
c.
What has been the total number of observations?
Source of Variation
Sum of
Squares
Degrees of
Freedom
Mean
Square
F
Between Treatments
90
3
Within Treatments (Error)
120
20
Total
210
23
b.
4
c.
24
32. Part of an ANOVA table involving 8 groups for a study is shown below.
Source of Variation
Sum of
Squares
Degrees of
Freedom
Mean
Square
F
Between Treatments
126
_____?
_____?
_____?
Within Treatments (Error)
240
_____?
_____?
Total
_____?
67
a.
Complete all the missing values in the above table and fill in the blanks.
b.
Use = 0.01 to determine if there is any significant difference among the means of the eight
groups.
33. MNM, Inc. has three stores located in three different areas. Random samples of the daily sales of the
three stores (in $1,000) are shown below.
Store 1
Store 2
Store 3
9
10
6
8
11
7
7
10
8
8
13
11
At a 5% level of significance, test to see if there is a significant difference in the average sales of the
three stores.
34. Five drivers were selected to test drive 2 makes of automobiles. The following table shows the number
of miles per gallon for each driver driving each car.
Driver
Automobile
1
2
3
4
5
A
30
31
30
27
32
B
36
35
28
31
30
Source of Variation
Sum of
Squares
Degrees of
Freedom
Mean
Square
F
Between Treatments
126
Within Treatments (Error)
240
60
Total
366
eight groups
Consider the makes of automobiles as treatments and the drivers as blocks, test to see if there is any
difference in the miles/gallon of the two makes of automobiles. Let = .05.
35. A factorial experiment involving 2 levels of factor A and 2 levels of factor B resulted in the following.
Factor B
Factor A
Level 1
Level 2
Level 1
14
18
16
12
Level 2
18
16
20
14
Set up the ANOVA table and test for any significant main effect and any interaction effect. Use =
.05.
36. Ten observations were selected from each of 3 populations, and an analysis of variance was performed
on the data. The following are the results:
Source of Variation
Sum of
Squares
Degrees of
Freedom
Mean
Square
F
Between Treatments
82.4
Within Treatments (Error)
158.4
Total
a.
Using = .05, test to see if there is a significant difference among the means of the three
populations.
b.
If in Part a you concluded that at least one mean is different from the others, determine which
mean is different. The three sample means are
= 24.8, = 23.4, and = 27.4. Use Fisher’s LSD procedure and let = .05.
b.
LSD = 2.22
37. The following are the results from a completely randomized design consisting of 3 treatments.
Source of Variation
Sum of
Squares
Degrees of
Freedom
Mean
Square
F
Between Treatments
390.58
Within Treatments (Error)
158.40
Total
548.98
23
a.
Using = .05, test to see if there is a significant difference among the means of the three
populations. The sample sizes for the three treatments are equal.
b.
If in Part a you concluded that at least one mean is different from the others, determine which
mean(s) is (are) different. The three sample means are = 17.000, = 21.625, and =
26.875. Use Fisher’s LSD procedure and let = .05.
b.
LSD = 2.856
All three means are different from one another.
38. Eight observations were selected from each of 3 populations, and an analysis of variance was
performed on the data. The following are part of the results.
Source of Variation
Sum of
Squares
Degrees of
Freedom
Mean
Square
F
Between Treatments
195.58
Within Treatments (Error)
10.77
Total
Using = .05, test to see if there is a significant difference among the means of the three populations.
The sample sizes for the three treatments are equal.
39. Random samples of individuals from three different cities were asked how much time they spend per
day watching television. The results (in minutes) for the three groups are shown below.
The mean of the third population is different.
City I
City II
City III
260
178
211
280
190
190
240
220
250
260
240
300
At = 0.05, test to see if there is a significant difference in the averages of the three groups.
40. Three different brands of tires were compared for wear characteristics. From each brand of tire, ten
tires were randomly selected and subjected to standard wear-testing procedures. The average mileage
obtained for each brand of tire and sample variances (both in 1,000 miles) are shown below.
Brand A
Brand B
Brand C
Average Mileage
37
38
33
Sample Variance
3
4
2
Show the complete ANOVA table for this problem.
SSTR = 140
MSTR = 70
SSE = 81
MSE = 3
41. Halls, Inc. has three stores located in three different areas. Random samples of the sales of the three
stores (In $1,000) are shown below.
Store 1
Store 2
Store 3
46
34
33
47
36
31
45
35
35
42
39
45
At a 5% level of significance, test to see if there is a significant difference in the average sales of the
three stores.
ANS:
SSTR = 9,552.92
MSTR = 4,776.46
SSE = 6,322
MSE = 702.44
42. In a completely randomized experimental design, 11 experimental units were used for each of the 4
treatments. Part of the ANOVA table is shown below.
Source of Variation
Sum of
Squares
Degrees of
Freedom
Mean
Square
F
Between Treatments
1,500
_____?
_____?
_____?
Within Treatments (Error)
_____?
_____?
_____?
Total
5,500
Fill in the blanks in the above ANOVA table.
Sum of
Degrees of
Mean
Between Treatments
1,500
Within Treatments (Error)
4,000
Total
5,500
43. Samples were selected from three populations. The data obtained are shown below.
Sample 1
Sample 2
Sample 3
10
16
15
13
14
15
12
13
16
13
14
14
16
10
17
Sample Mean ( )
12
15
14
Sample Variance ( )
2
2.4
5.5
a.
Set up the ANOVA table for this problem.
b.
At a 5% level of significance test to determine whether there is a significant difference in the
means of the three populations.
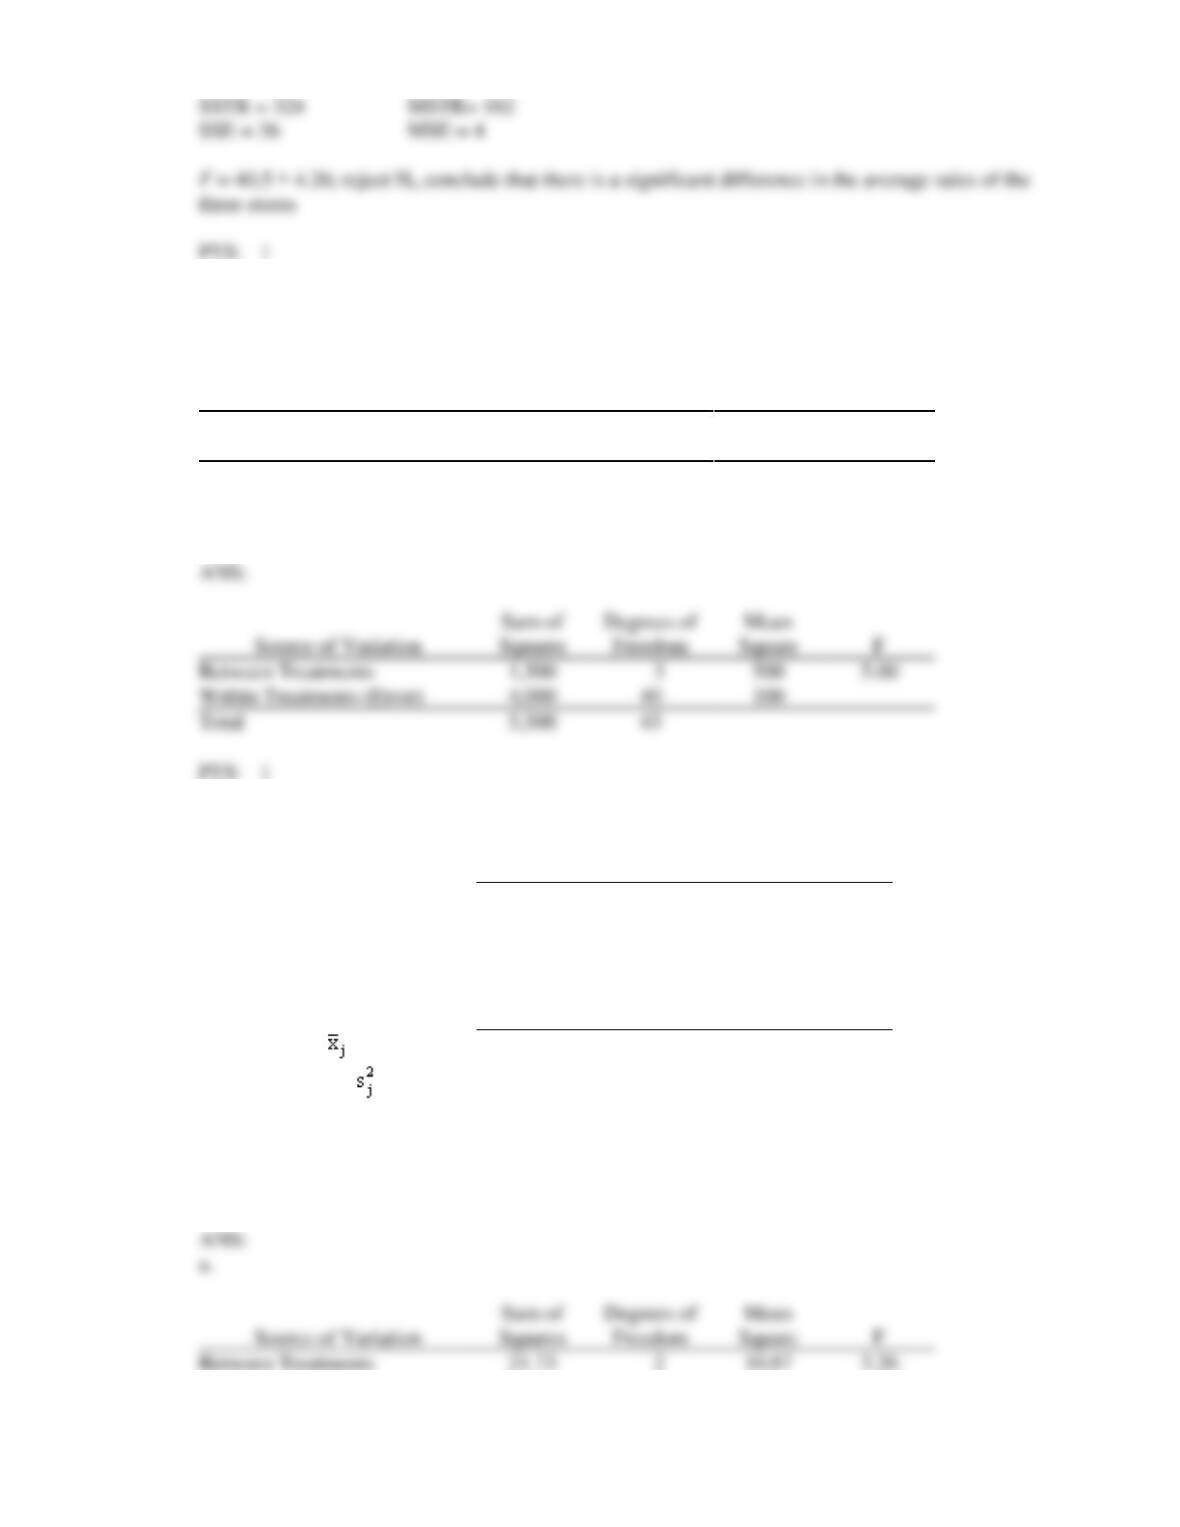
Between Treatments
21.73
10.87
SSTR = 324
MSTR= 162
SSE = 36
MSE = 4