Exhibit 3-2
A researcher has collected the following sample data. The mean of the sample is 5.
Refer to Exhibit 3-2. The standard deviation is
a. 8.944
b. 4.062
c. 13.2
d. 16.5
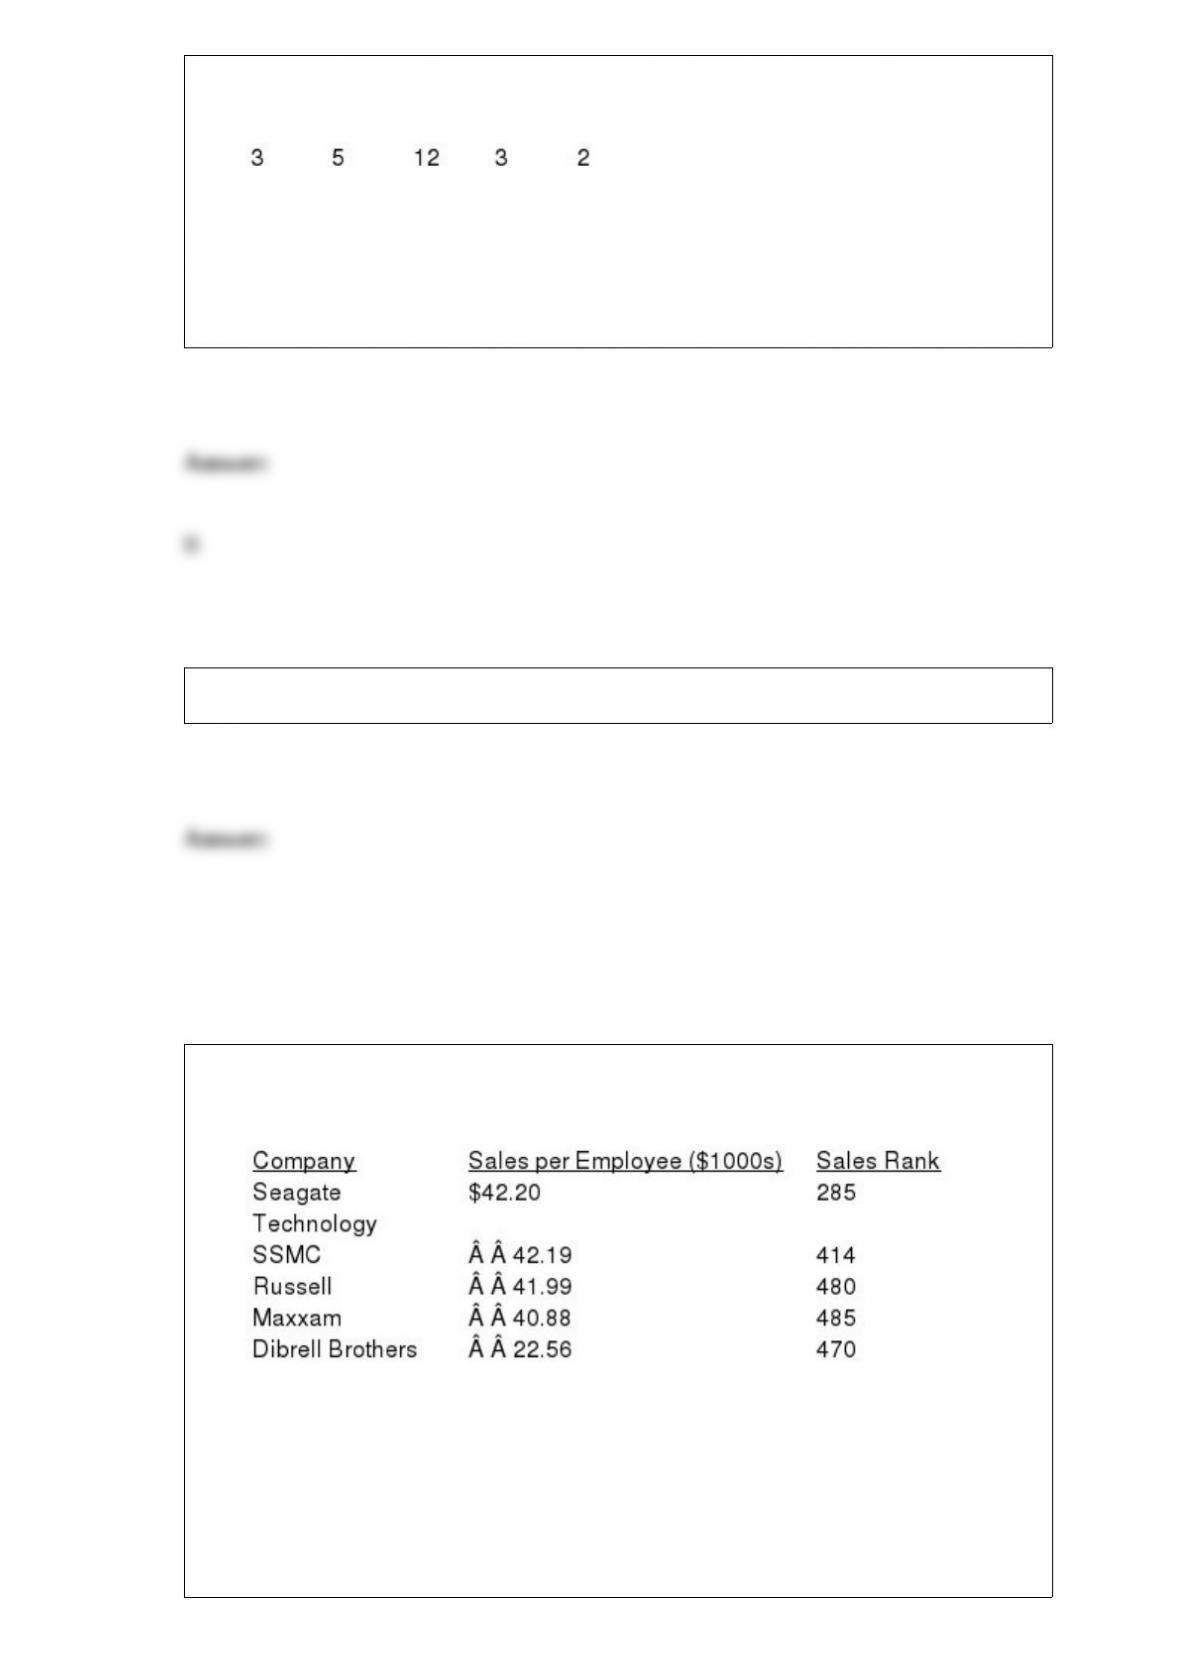
An issue of Fortune Magazine reported that the following companies had the lowest
sales per employee among the Fortune 500 companies.
a. How many elements are in the above data set?
b. How many variables are in the above data set?
c. How many observations are in the above data set?
d. Name the scale of measurement for each of the variables.
e. Name the variables and indicate whether they are categorical or quantitative.
How many different samples of size 3 (without replacement) can be taken from a finite
population of size 10?
a. 30
b. 1,000
c. 720
d. 120
A sample of 26 elements from a normally distributed population is selected. The sample
mean is 10 with a standard deviation of 4. The 95% confidence interval for is
a. 6.000 to 14.000
b. 9.846 to 10.154
c. 8.384 to 11.616
d. 8.462 to 11.538
Survey costs are highest for
a. mail surveys
b. personal interview surveys
c. Internet surveys
d. telephone surveys
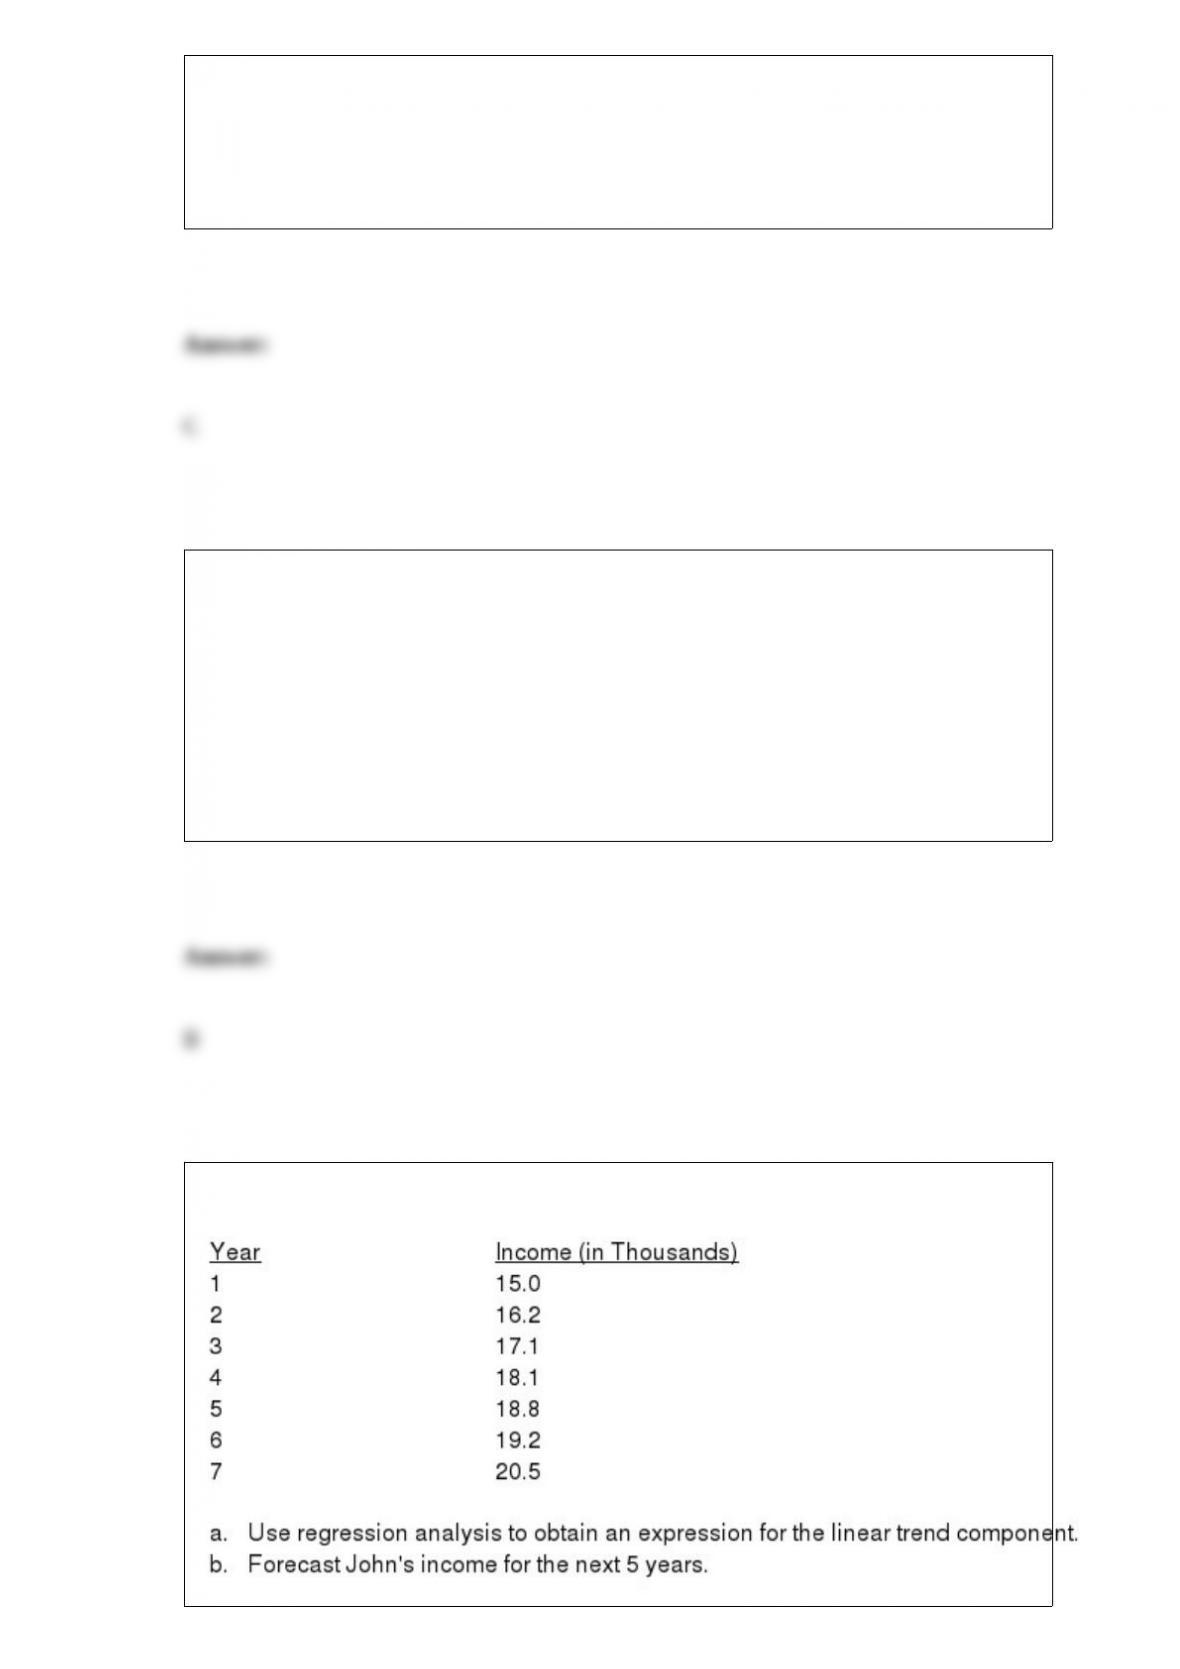
Below you are given information on John’s income for the past 7 years.
Exhibit 9-1
Refer to Exhibit 9-1. The p-value is
a. 0.5107
b. 0.0214
c. 0.0107
d. 2.1
A sample of 41 observations yielded a sample standard deviation of 5. If we want to test
Ho: 2 = 20, the test statistic is
a. 100
b. 10
c. 51.25
d. 50
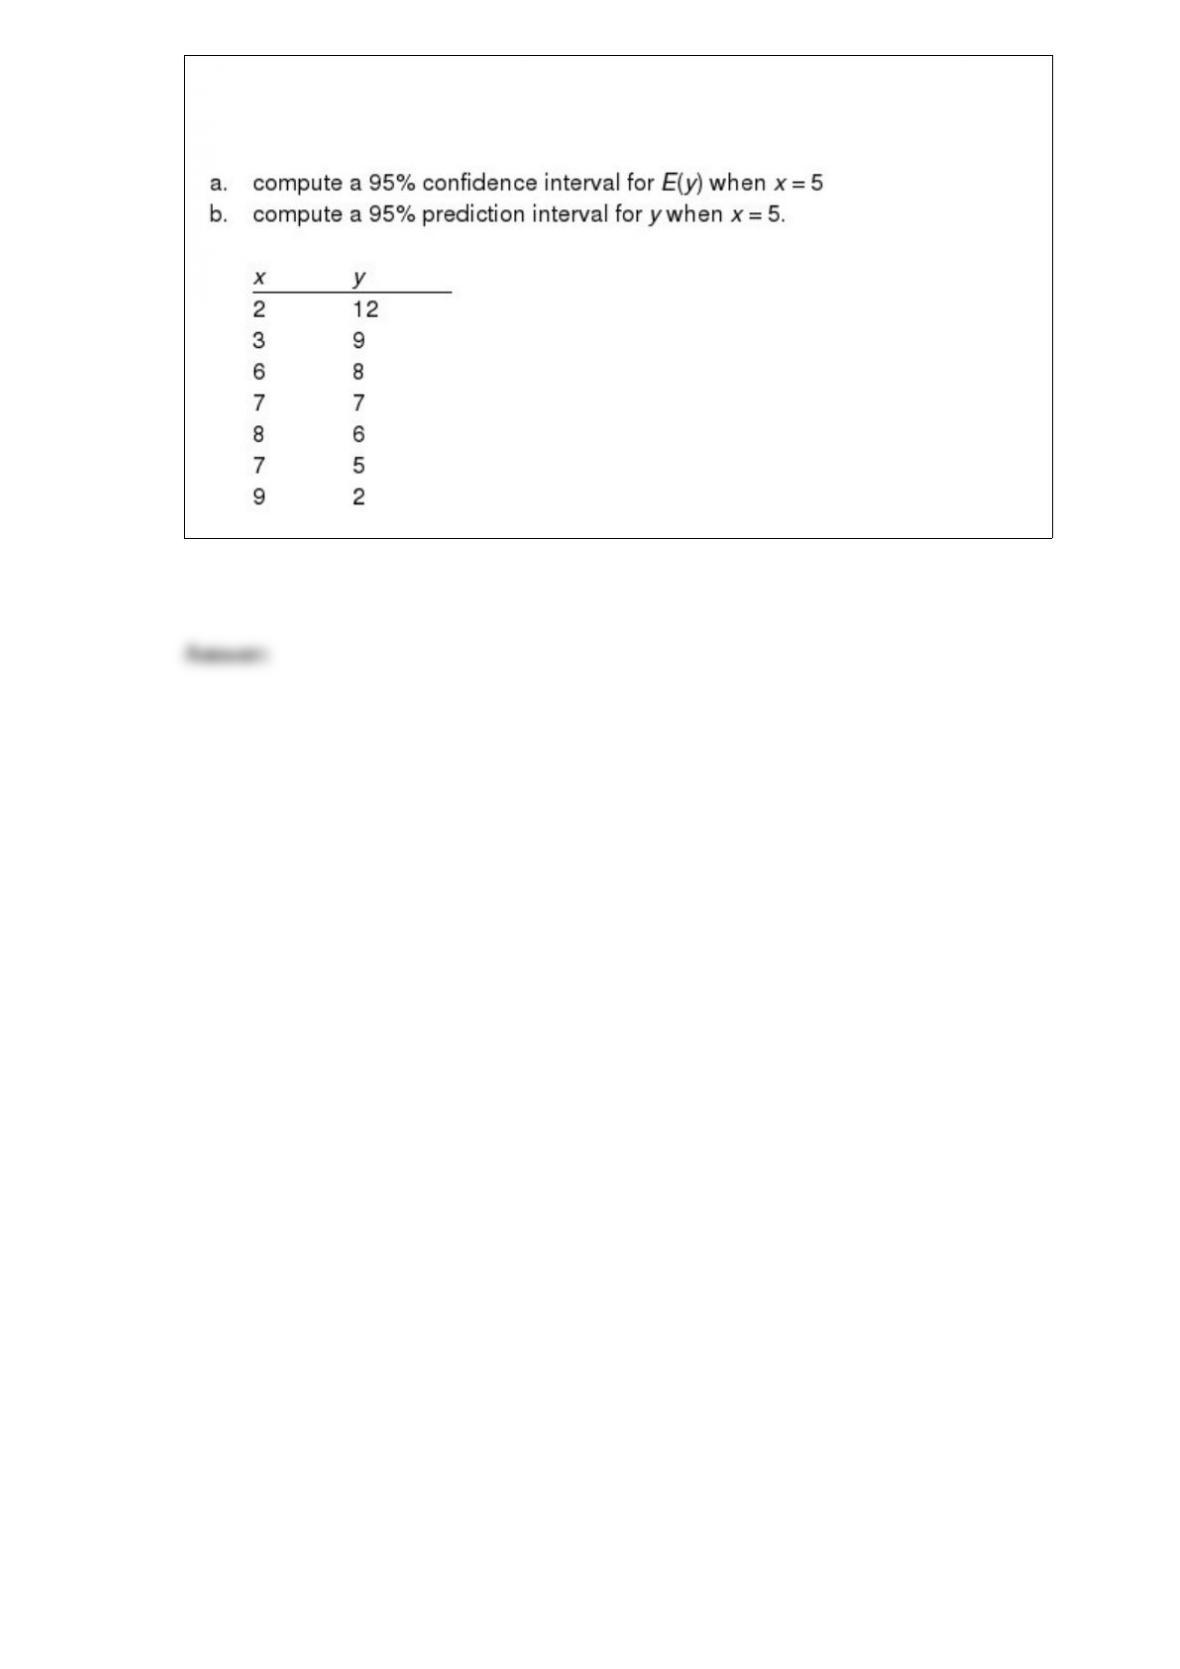
Consider the following data.
Use Excel’s Regression Tool to estimate a general linear model that uses a reciprocal
transformation on the dependent variable.
To construct a histogram using Excel’s Chart Tools, choose __________ as the chart
type.
a. column
b. pie
c. scatter
d. line
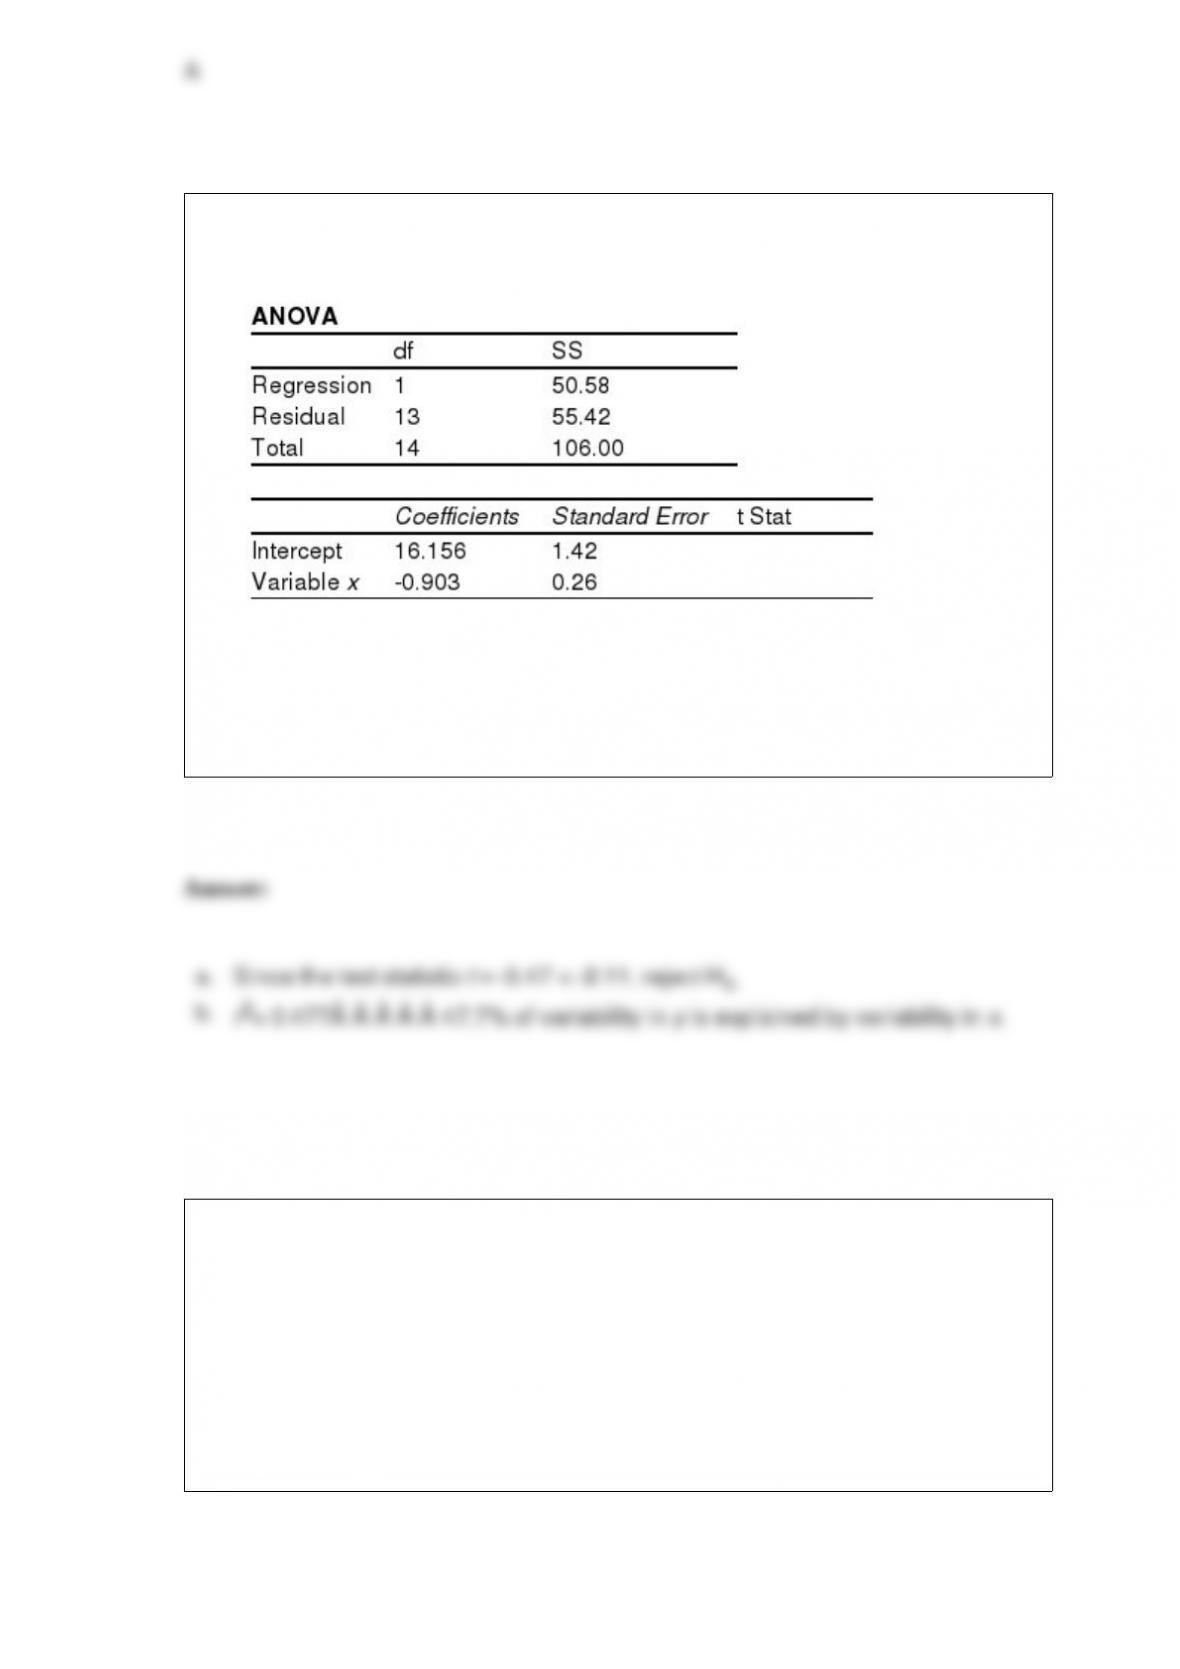
Shown below is a portion of a computer output for a regression analysis relating y
(dependent variable) and x (independent variable).
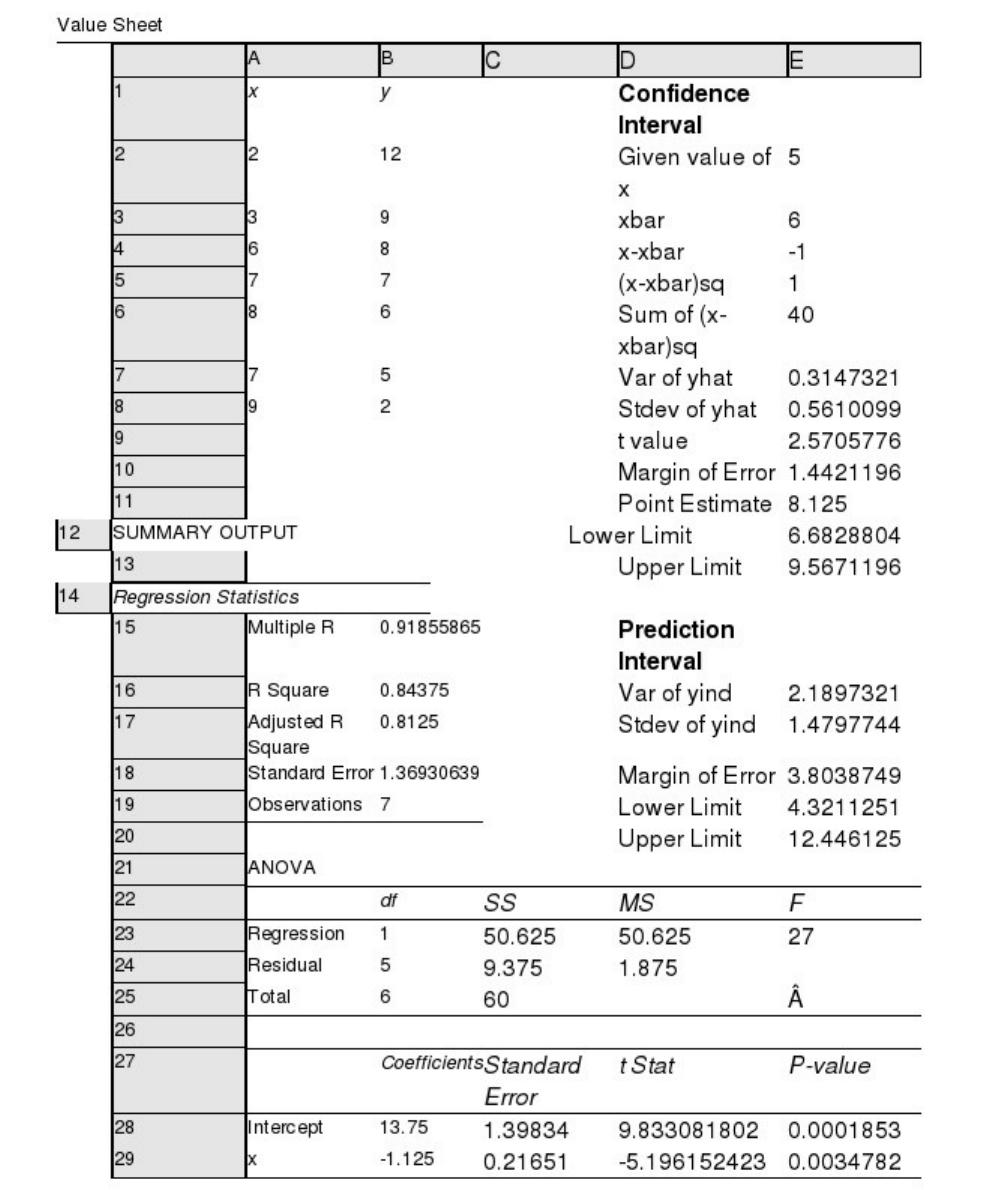
a. Perform a t test and determine whether or not y and x are related. Use 0.05.
b. Compute the coefficient of determination and fully interpret the meaning. Be very
specific.
If the coefficient of determination is a positive value, then the regression equation
a. must have a positive slope
b. must have a negative slope
c. could have either a positive or a negative slope
d. must have a positive y intercept

Random samples of size 525 are taken from a process (an infinite population) whose
population proportion is 0.3. The standard deviation of the sample proportions (i.e., the
standard error of the proportion) is
a. 0.0004
b. 0.2100
c. 0.3000
d. 0.0200
The forecasting method that is appropriate when the time series has no significant trend,
cyclical, or seasonal effect is
a. moving averages
b. mean squared error
c. mean average deviation
d. qualitative forecasting methods
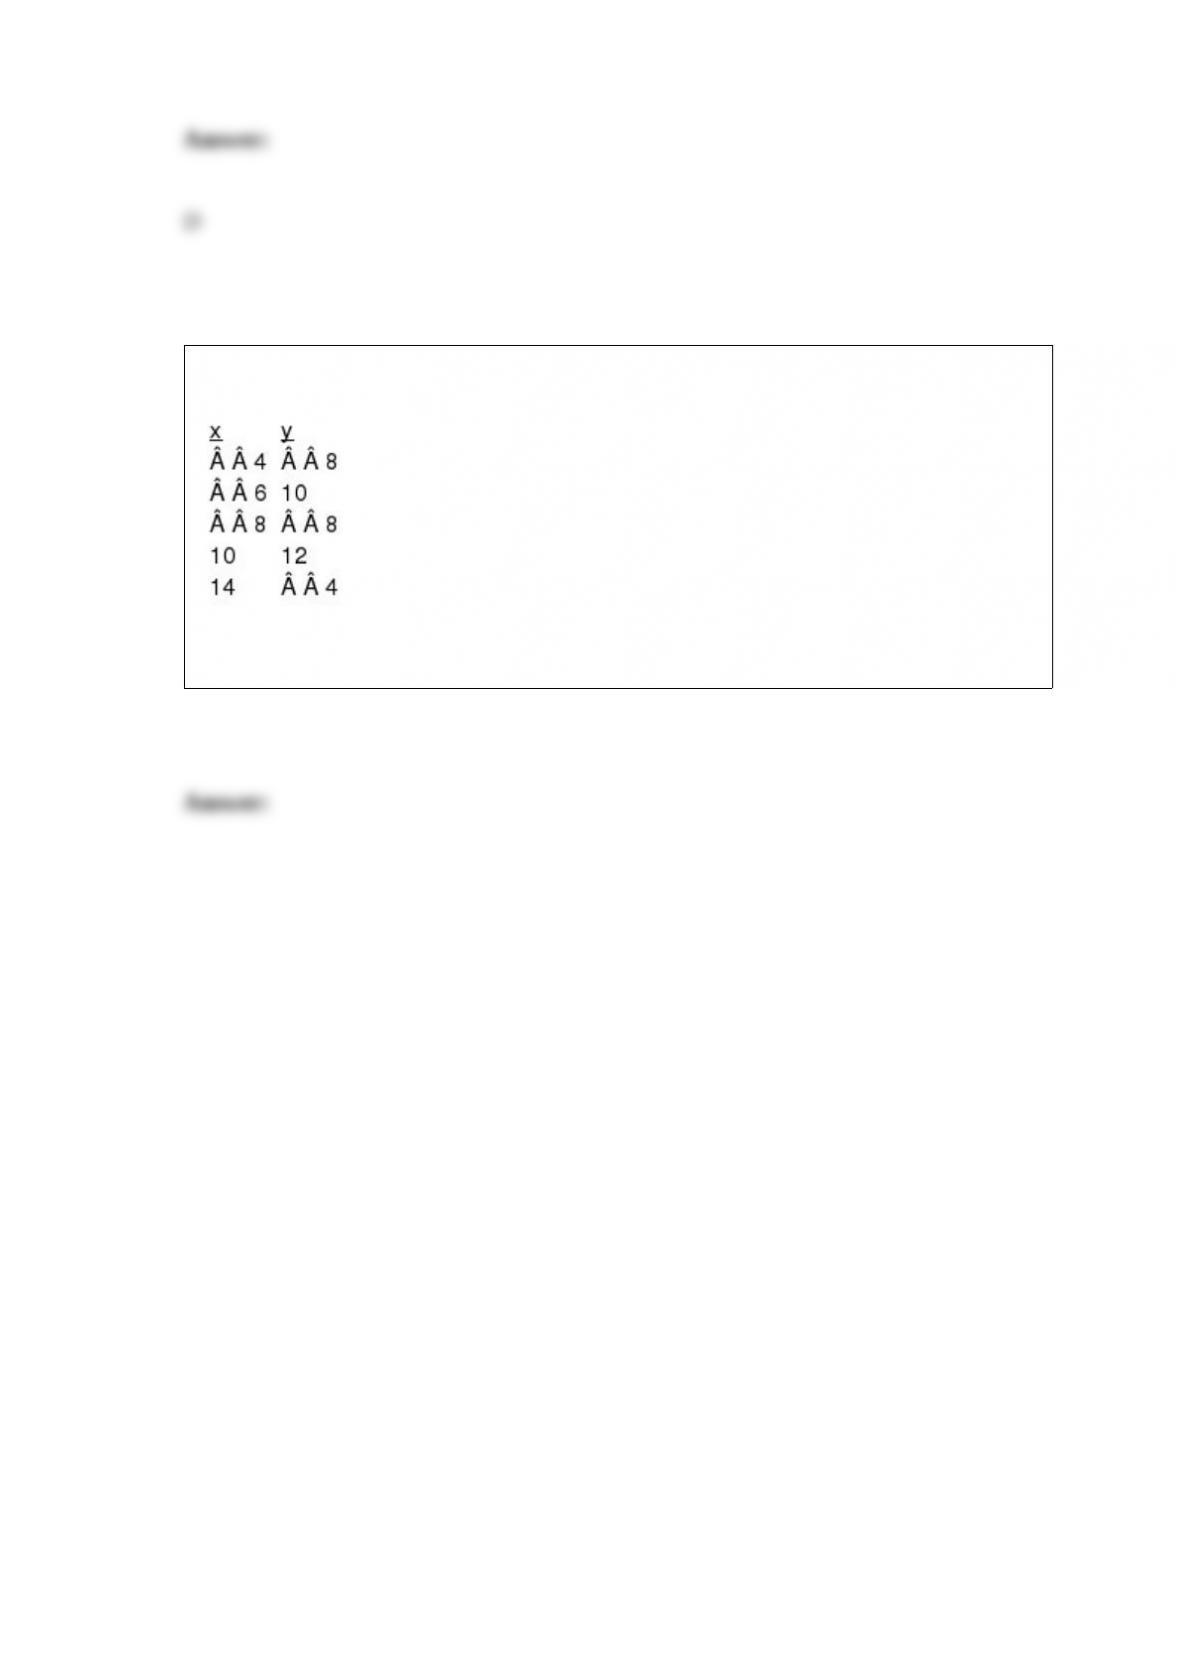
Given below are seven observations collected in a regression study on two variables, x
(independent variable) and y (dependent variable). Use Excel to
Which of the following graphical methods is not intended for quantitative data?
a. ogive
b. dot plot
c. scatter diagram
d. pie chart
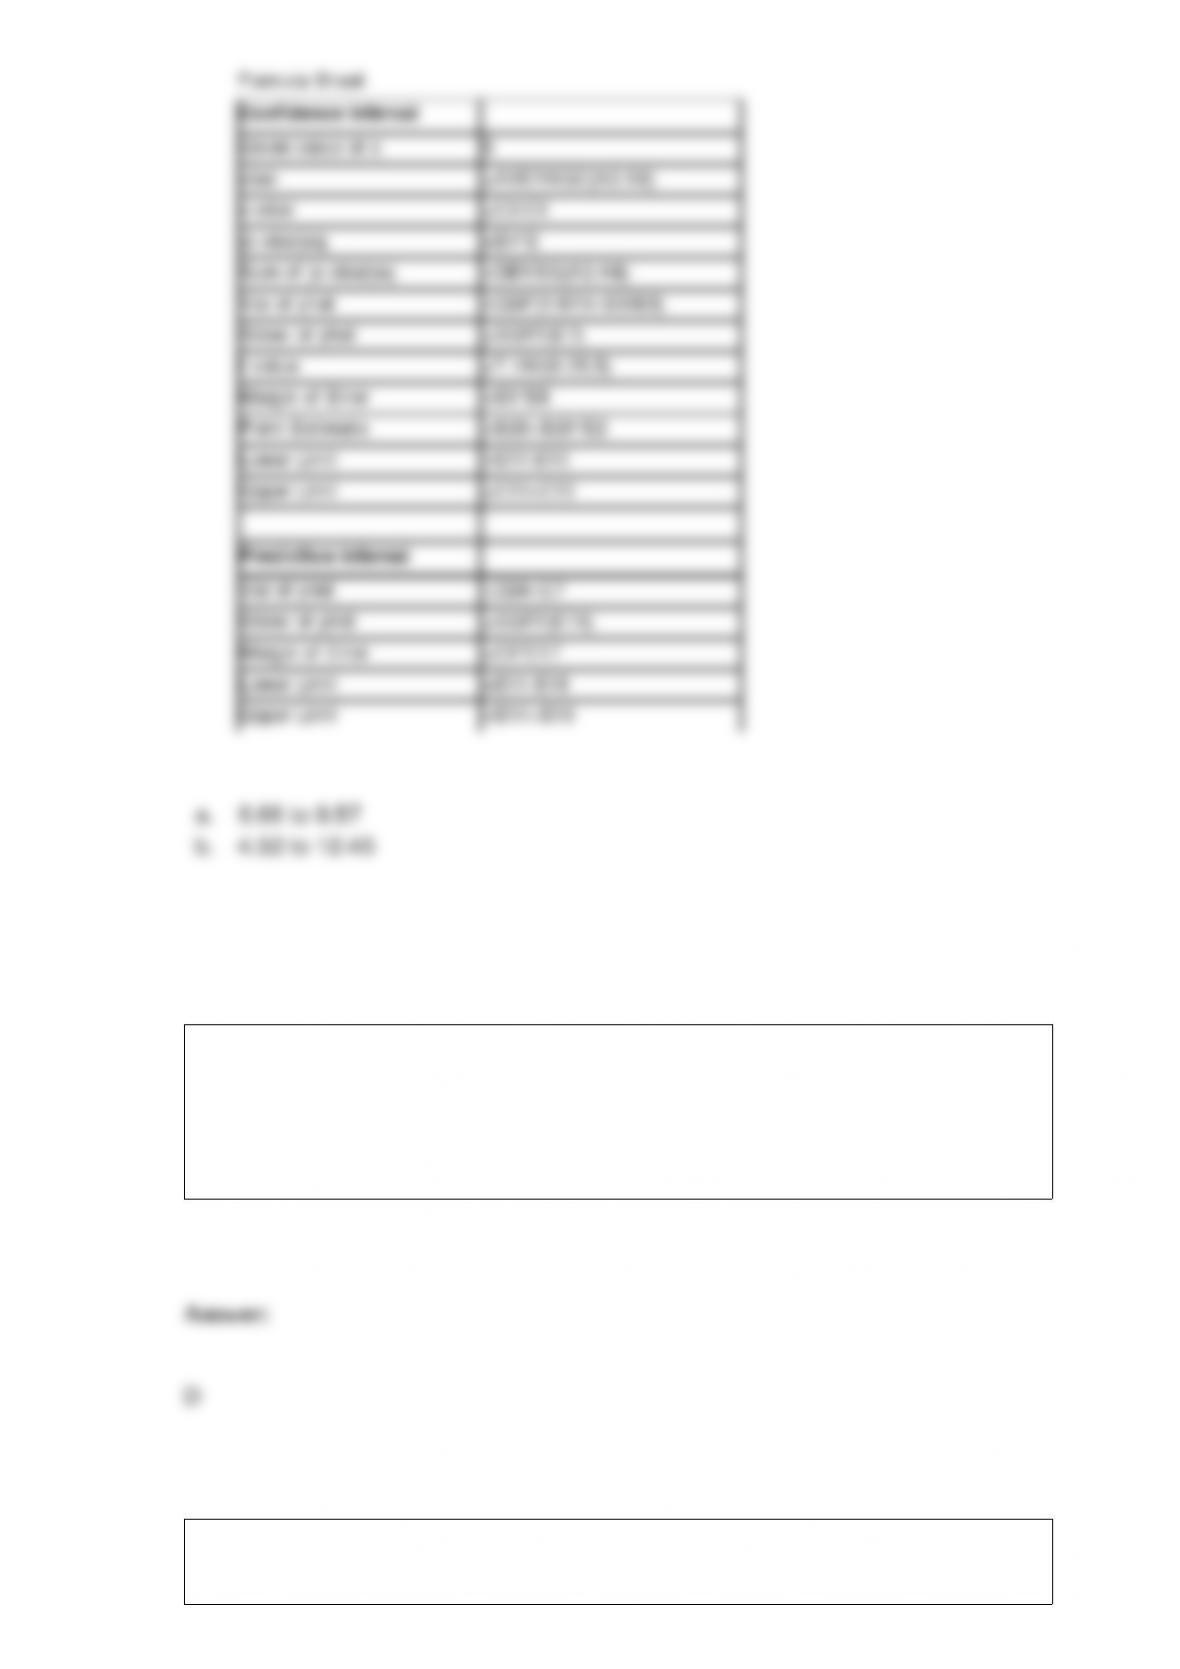
Exhibit 2-1
The numbers of hours worked (per week) by 400 statistics students are shown below.
Refer to Exhibit 2-1. If a cumulative frequency distribution is developed for the above
data, the last class will have a cumulative frequency of
a. 100
b. 1
c. 30 39
d. 400
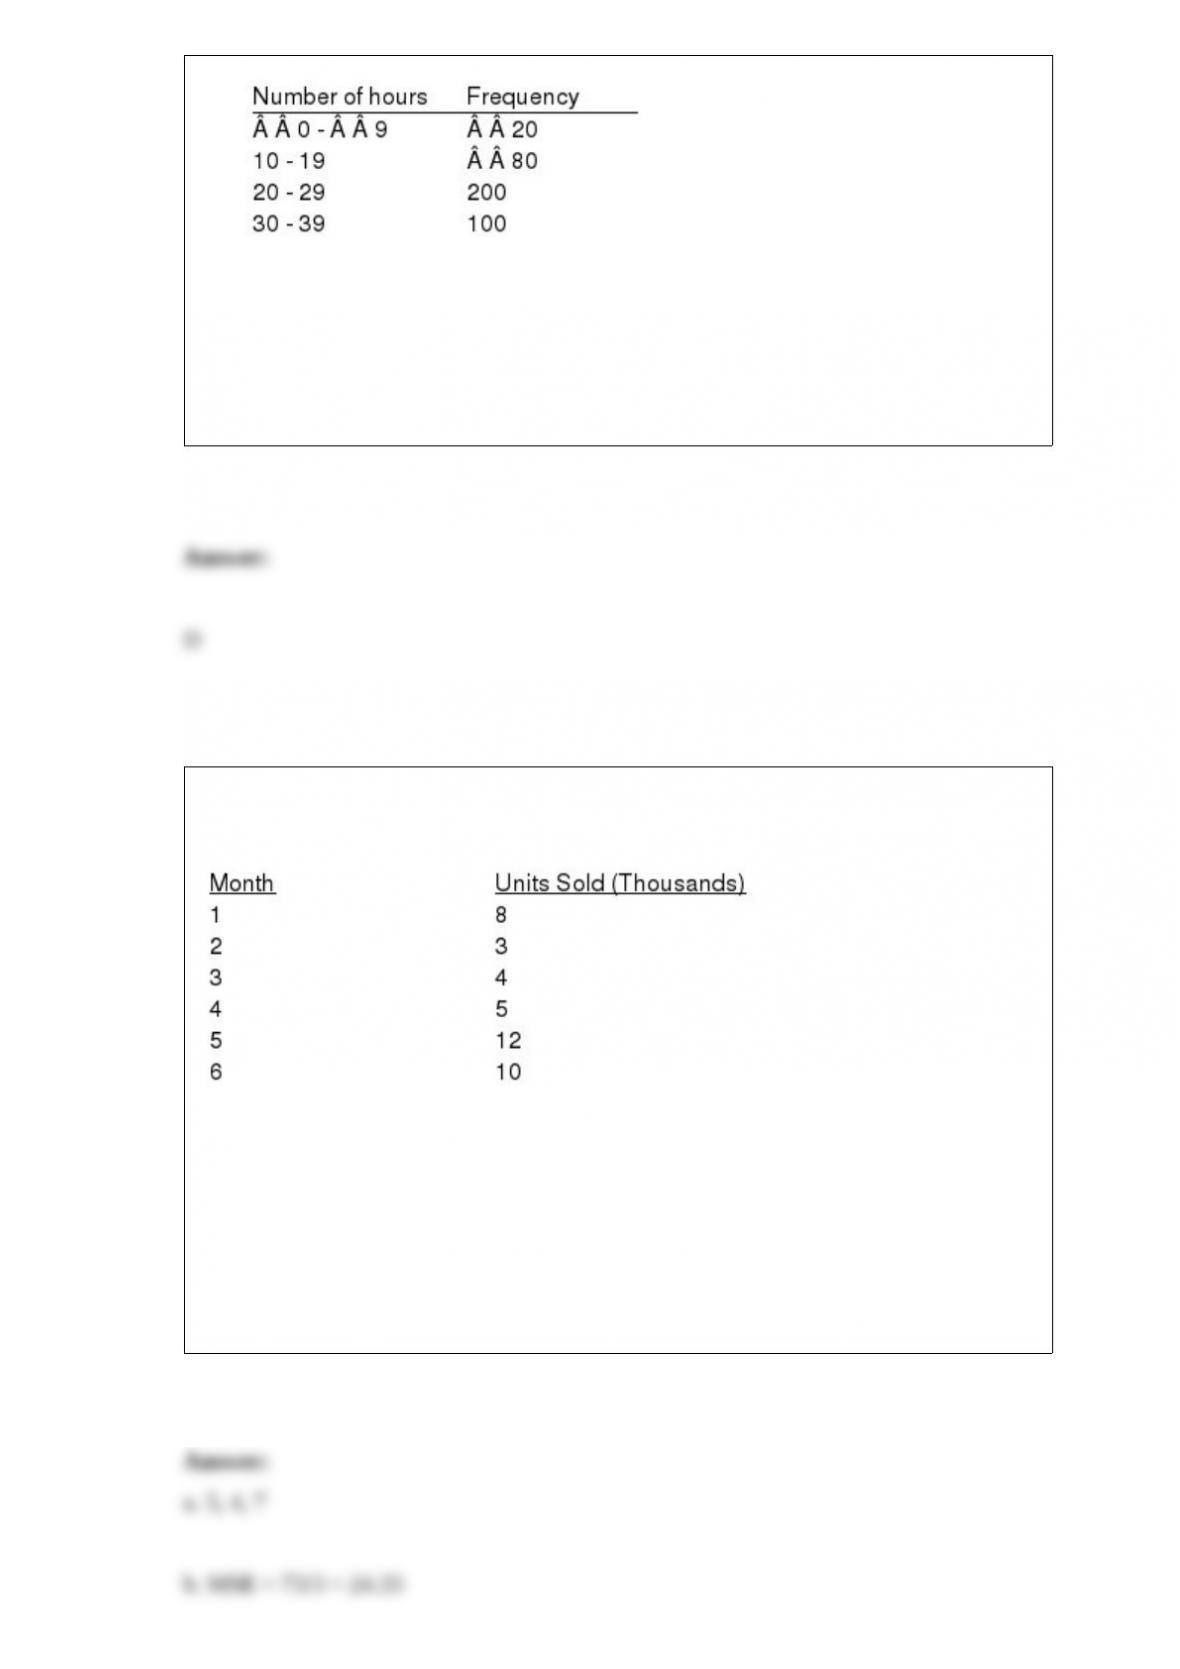
The following time series shows the number of units of a particular product sold over
the past six months.
a. Compute a 3-month moving average (centered) for the above time series.
b. Compute the mean square error (MSE) for the 3-month moving average.
c. Use = 0.2 to compute the exponential smoothing values for the time series.
d. Forecast the sales volume for month 7.
A local university reports that 3% of their students take their general education courses
on a pass/fail basis. Assume that fifty students are registered for a general education
course.
a. Define the random variable in words for this experiment.
b. What is the expected number of students who have registered on a pass/fail basis?
c. What is the probability that exactly five are registered on a pass/fail basis?
d. What is the probability that more than three are registered on a pass/fail basis?
e. What is the probability that less than four are registered on a pass/fail basis?
The length of time patients must wait to see a doctor in a local clinic is uniformly
distributed between 15 minutes and 2 1/2 hours.
a. Define the random variable in words.
b. What is the probability of a patient waiting exactly 50 minutes?
c. What is the probability that a patient would have to wait between 45 minutes and 2
hours?
d. Compute the probability that a patient would have to wait over 2 hours.
e. Determine the expected waiting time and its standard deviation.
Super Cola sales breakdown as 80% regular soda and 20% diet soda. Men purchase
60% of the regular soda, but only 30% of the diet soda. If a woman purchases Super
Cola, what is the probability that it is a diet soda?
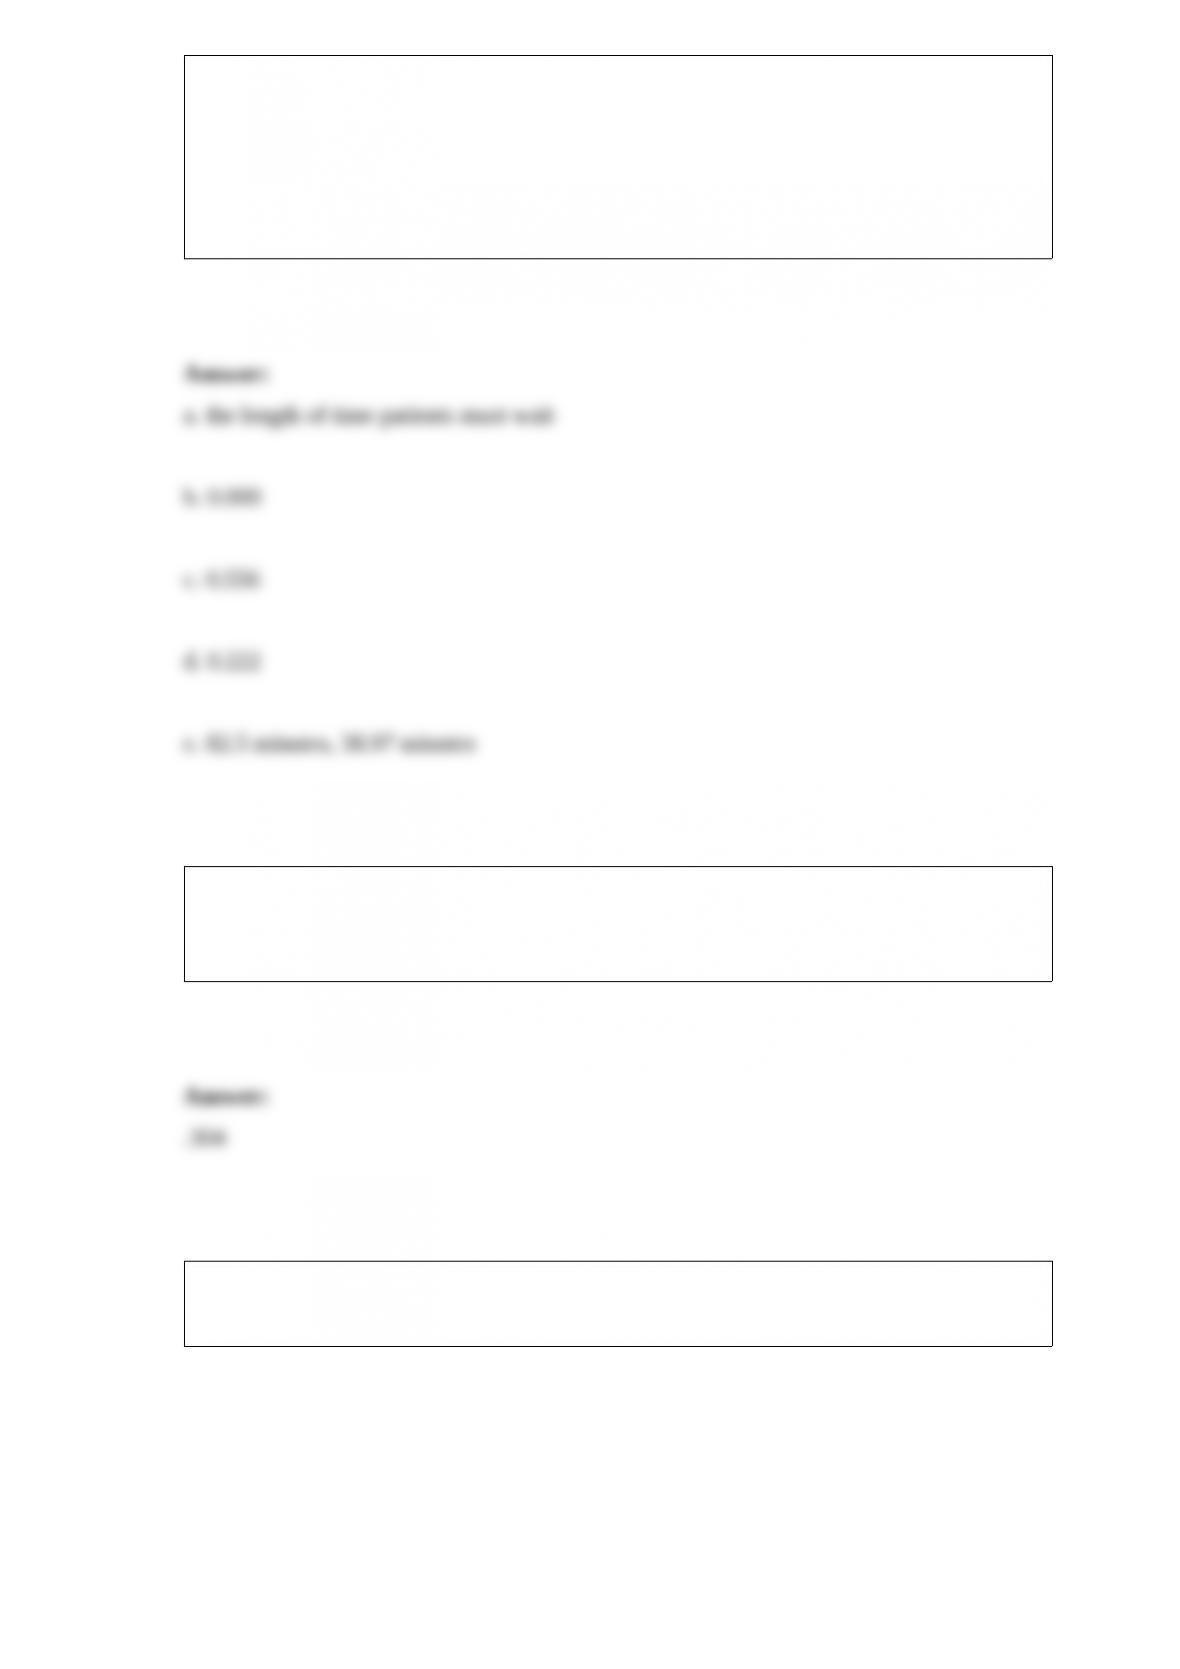
The following data represent the number of flash drives sold per day at a local computer
shop and their prices.
a. Develop a least-squares regression line and explain what the slope of the line
indicates.
b. Compute the coefficient of determination and comment on the strength of
relationship between x and y.
c. Compute the sample correlation coefficient between the price and the number of flash
drives sold. Use = 0.01 to test the relationship between x and y.
The following data show the quarterly sales of a major auto manufacturer for the years
8 through 10.
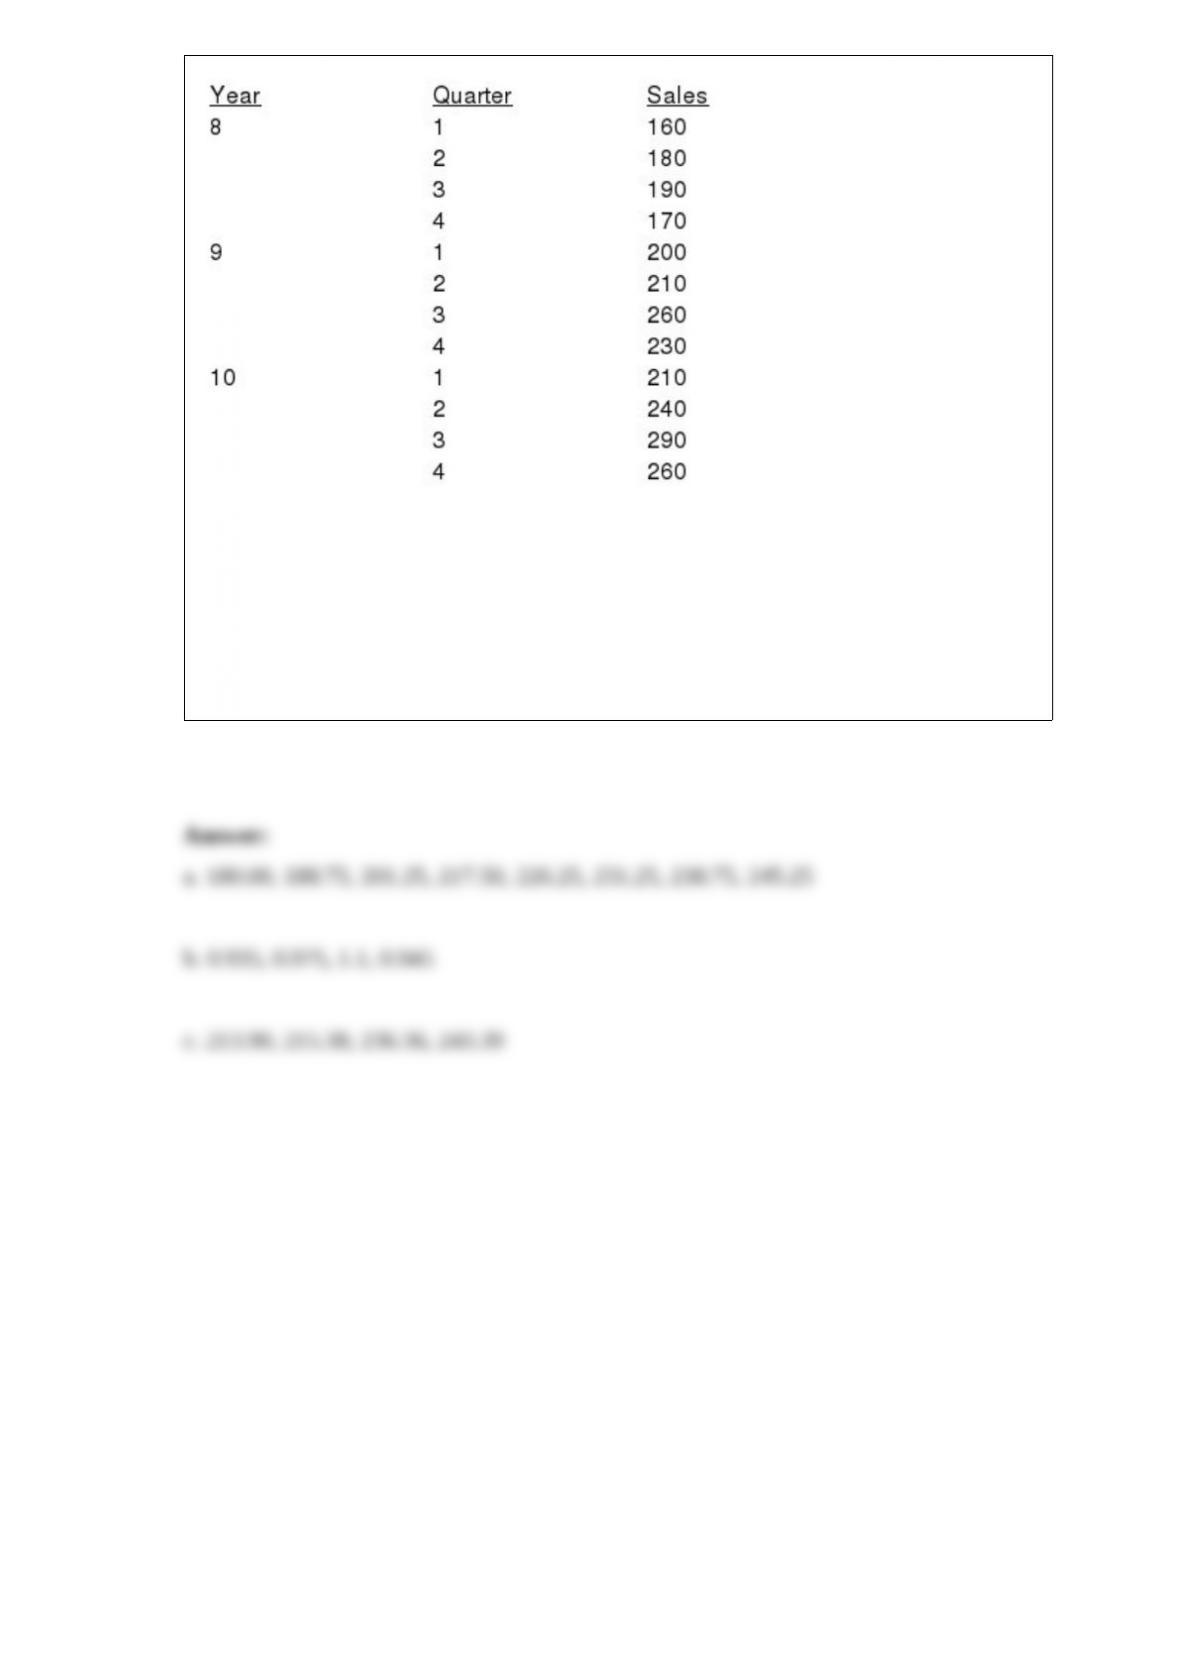
a. Compute the four-quarter moving average values for the above time series.
b. Compute the seasonal factors for the four quarters.
c. Use the seasonal factors developed in Part b to adjust the forecast for the effect of
season for year 9.