
If two events are mutually exclusive, then the probability of their intersection
a. will be equal to zero
b. can have any value larger than zero
c. must be larger than zero, but less than one
d. will be one
In Excel, which of the following functions is used to conduct a hypothesis test for
comparing two population variances?
a. CHISQ.DIST
b. F-Test
c. CHI.INV
d. None of these answers are correct.
The entire system of policies, procedures, and guidelines established by an organization
to achieve and maintain quality is called
a. quality control
b. quality engineering

c. quality assurance
d. Both quality control and quality engineering are correct.
The population we want to make inferences about is the
a. sampled population
b. frame
c. target population
d. finite population
Excel’s __________ function can be used to compute the sample correlation coefficient.
a. MAX
b. COVAR
c. VAR
d. CORREL
The most frequently occurring value of a data set is called the
a. range
b. mode
c. mean
d. None of the other answers are correct.
The variance of a sample of 81 observations equals 64. The standard deviation of the
sample equals
a. 0
b. 4096
c. 8
d. 6,561
Exhibit 11-3
The contents of a sample of 26 cans of apple juice showed a standard deviation of 0.06
ounces. We are interested in testing to determine whether the variance of the population
is significantly more than 0.003.
Refer to Exhibit 11-3. At 95% confidence, the critical value(s) from the table is(are)
a. 13.1197 and 40.6465
b. 37.6525
c. 14.6114 and 37.6525
d. 14.6114
A sample of 51 observations will be taken from a process (an infinite population). The
population proportion equals 0.85. The probability that the sample proportion will be
between 0.9115 and 0.946 is
a. 0.0345
b. 0.0819
c. 0.6900
d. 0.8633
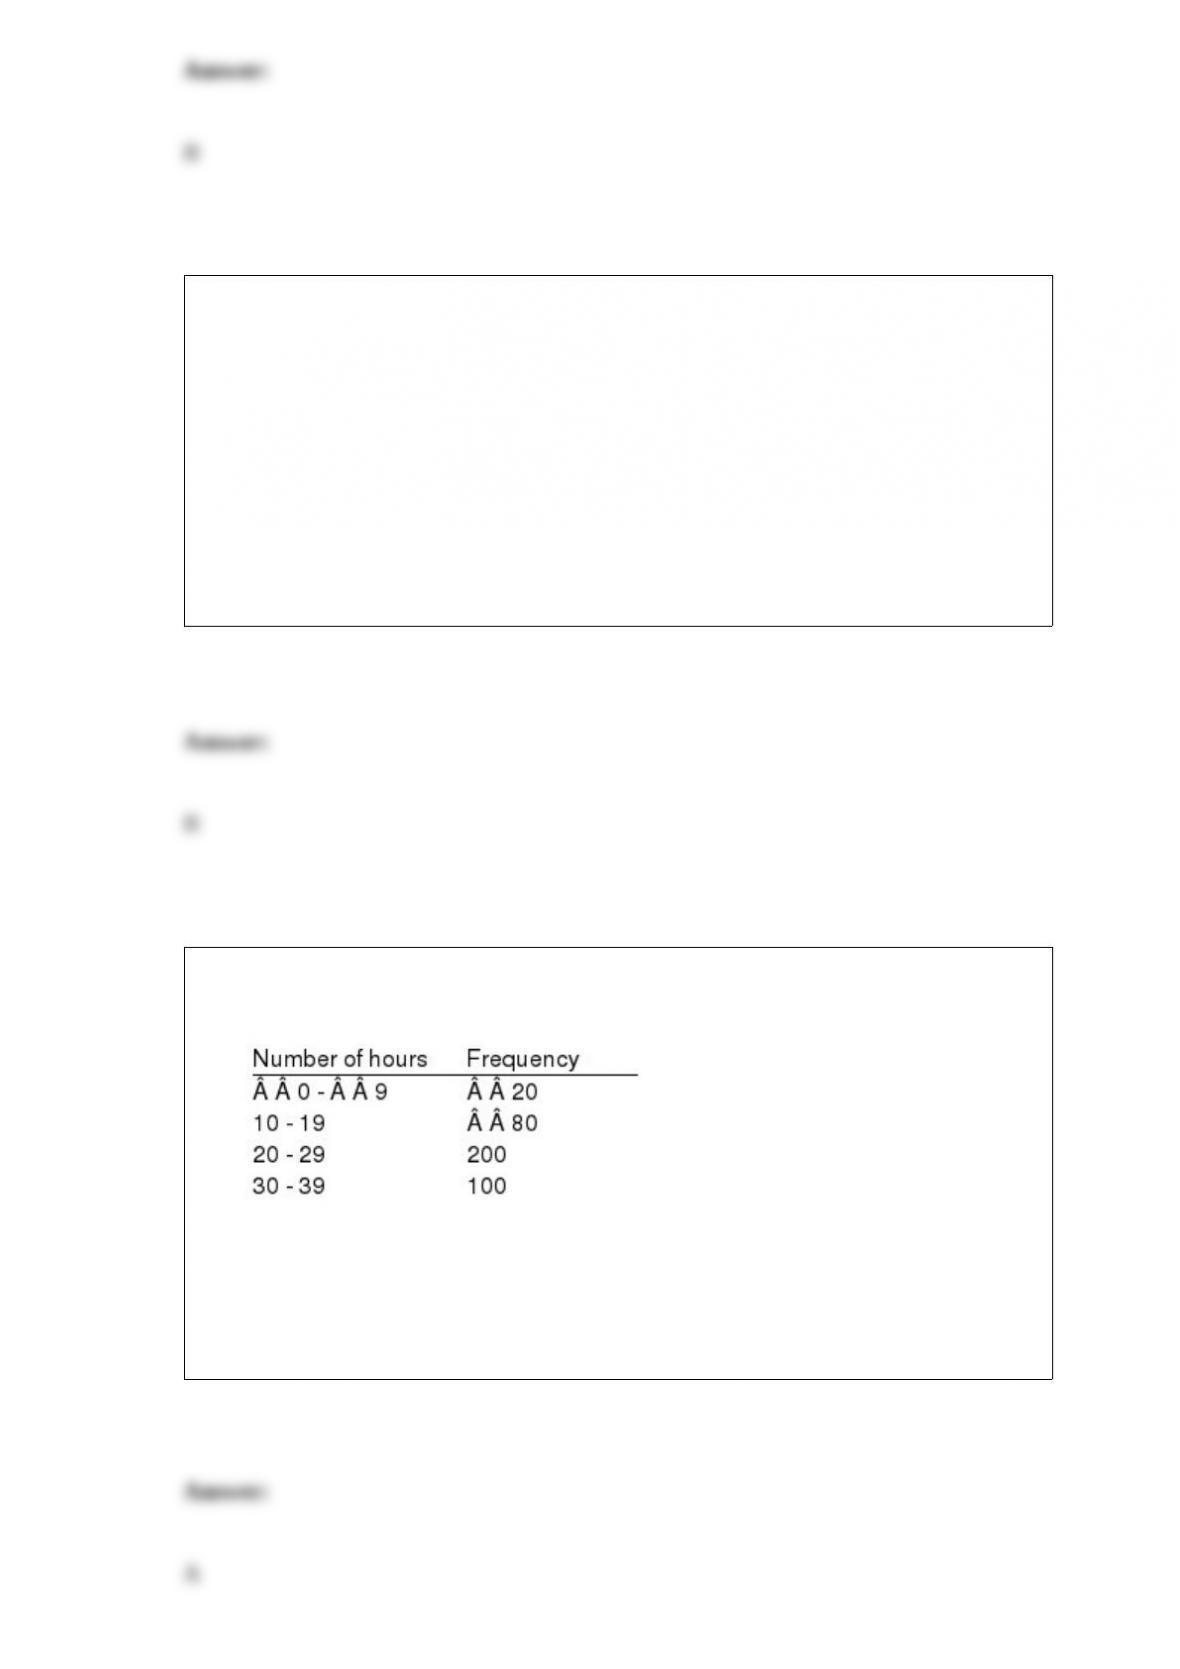
Exhibit 2-1
The numbers of hours worked (per week) by 400 statistics students are shown below.
Refer to Exhibit 2-1. The cumulative percent frequency for the class of 30 39 is
a. 100%
b. 75%
c. 50%
d. 25%
A simple random sample of size 36 is selected from a population of size 750. The
sample mean is 318, and the sample standard deviation is found to be 30.
Since the population is always larger than the sample, the value of the sample mean
a. is always smaller than the true value of the population mean
b. is always larger than the true value of the population mean
c. is always equal to the true value of the population mean
d. could be larger, equal to, or smaller than the true value of the population mean
Control charts based on data that can be measured on a continuous scale are called
a. normal control charts
b. variables control charts
c. attributes control charts
d. precision control charts
Excel’s Regression tool can be used to perform the ____ procedure.
a. stepwise regression
b. forward selection
c. backward elimination
d. best-subsets
is an example of a
a. population parameter
b. sample statistic
c. population variance
d. mode
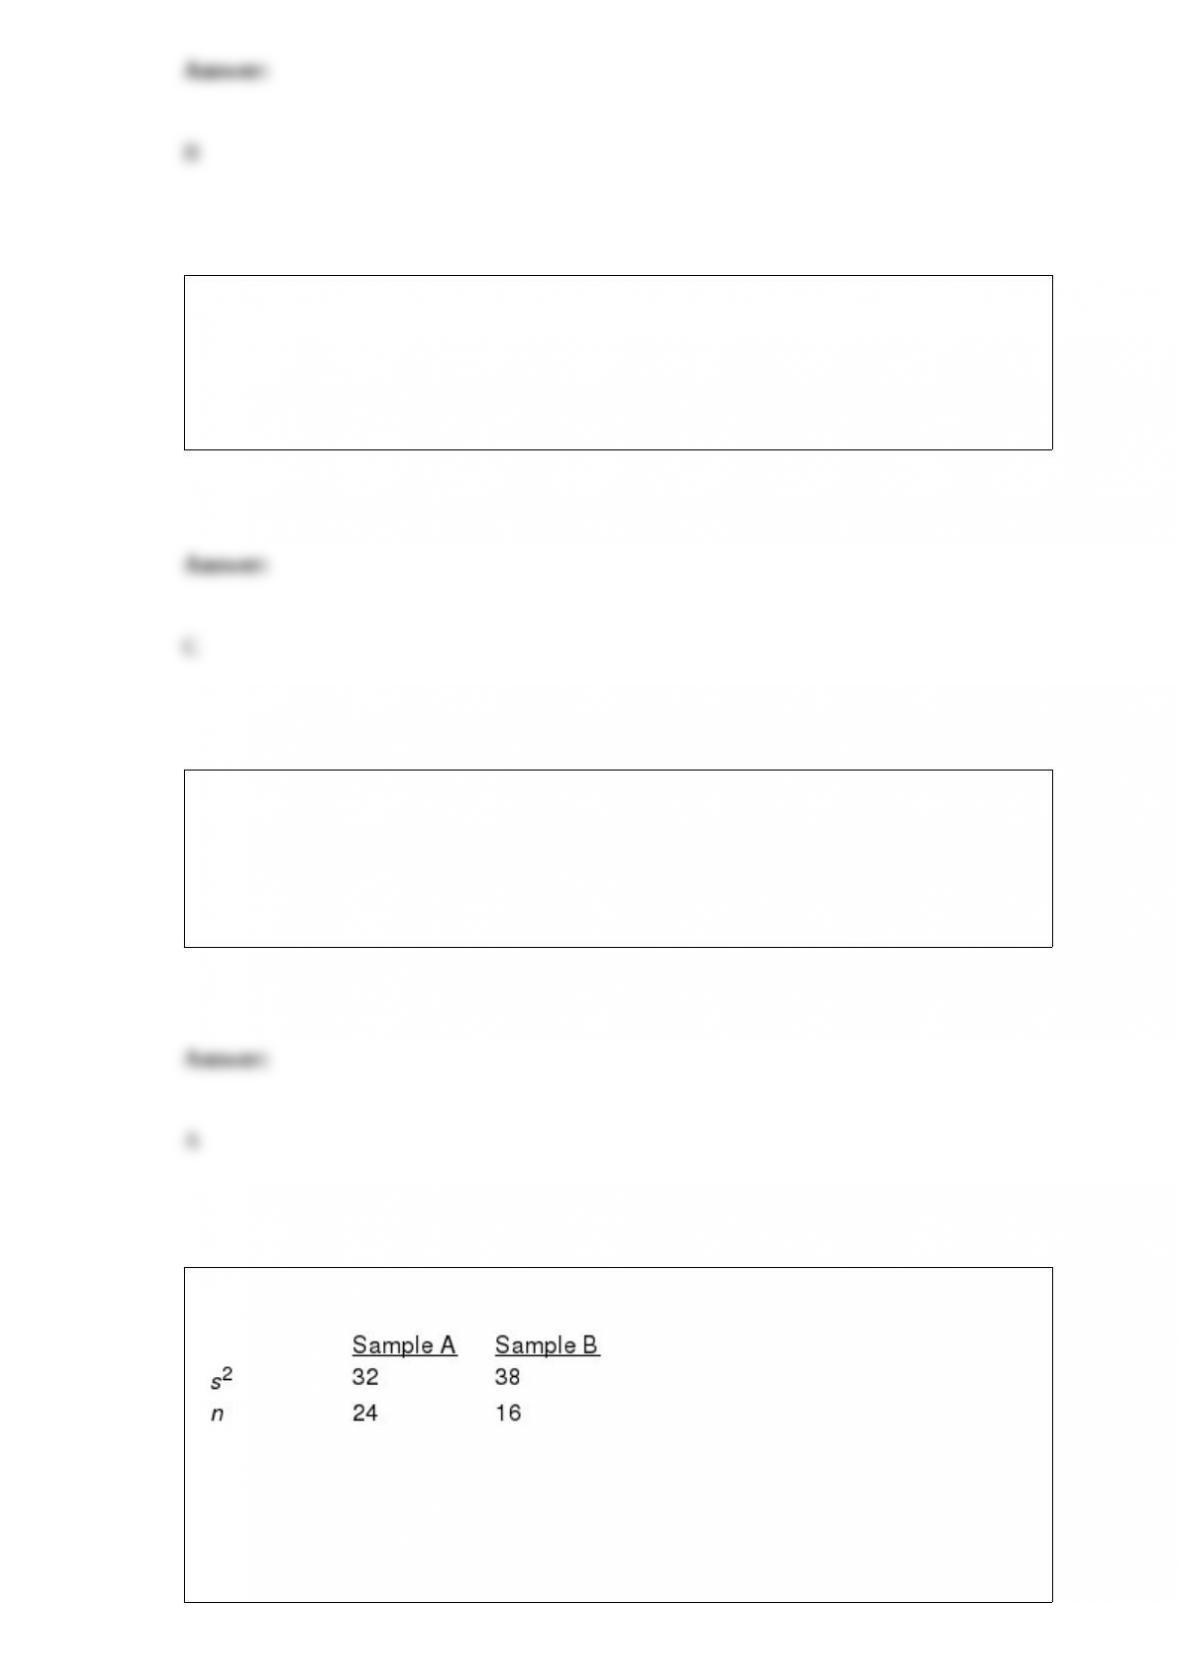
Exhibit 11-6
We want to test the hypothesis that the population variances are equal.
Refer to Exhibit 11-6. The null hypothesis is to be tested at the 10% level of
significance. The critical value from the table is
a. 2.11
b. 2.13
c. 2.24
d. 2.29
The level of measurement that is a label for the purpose of identifying an item is
a. ordinal measurement
b. ratio measurement
c. nominal measurement
d. internal measurement
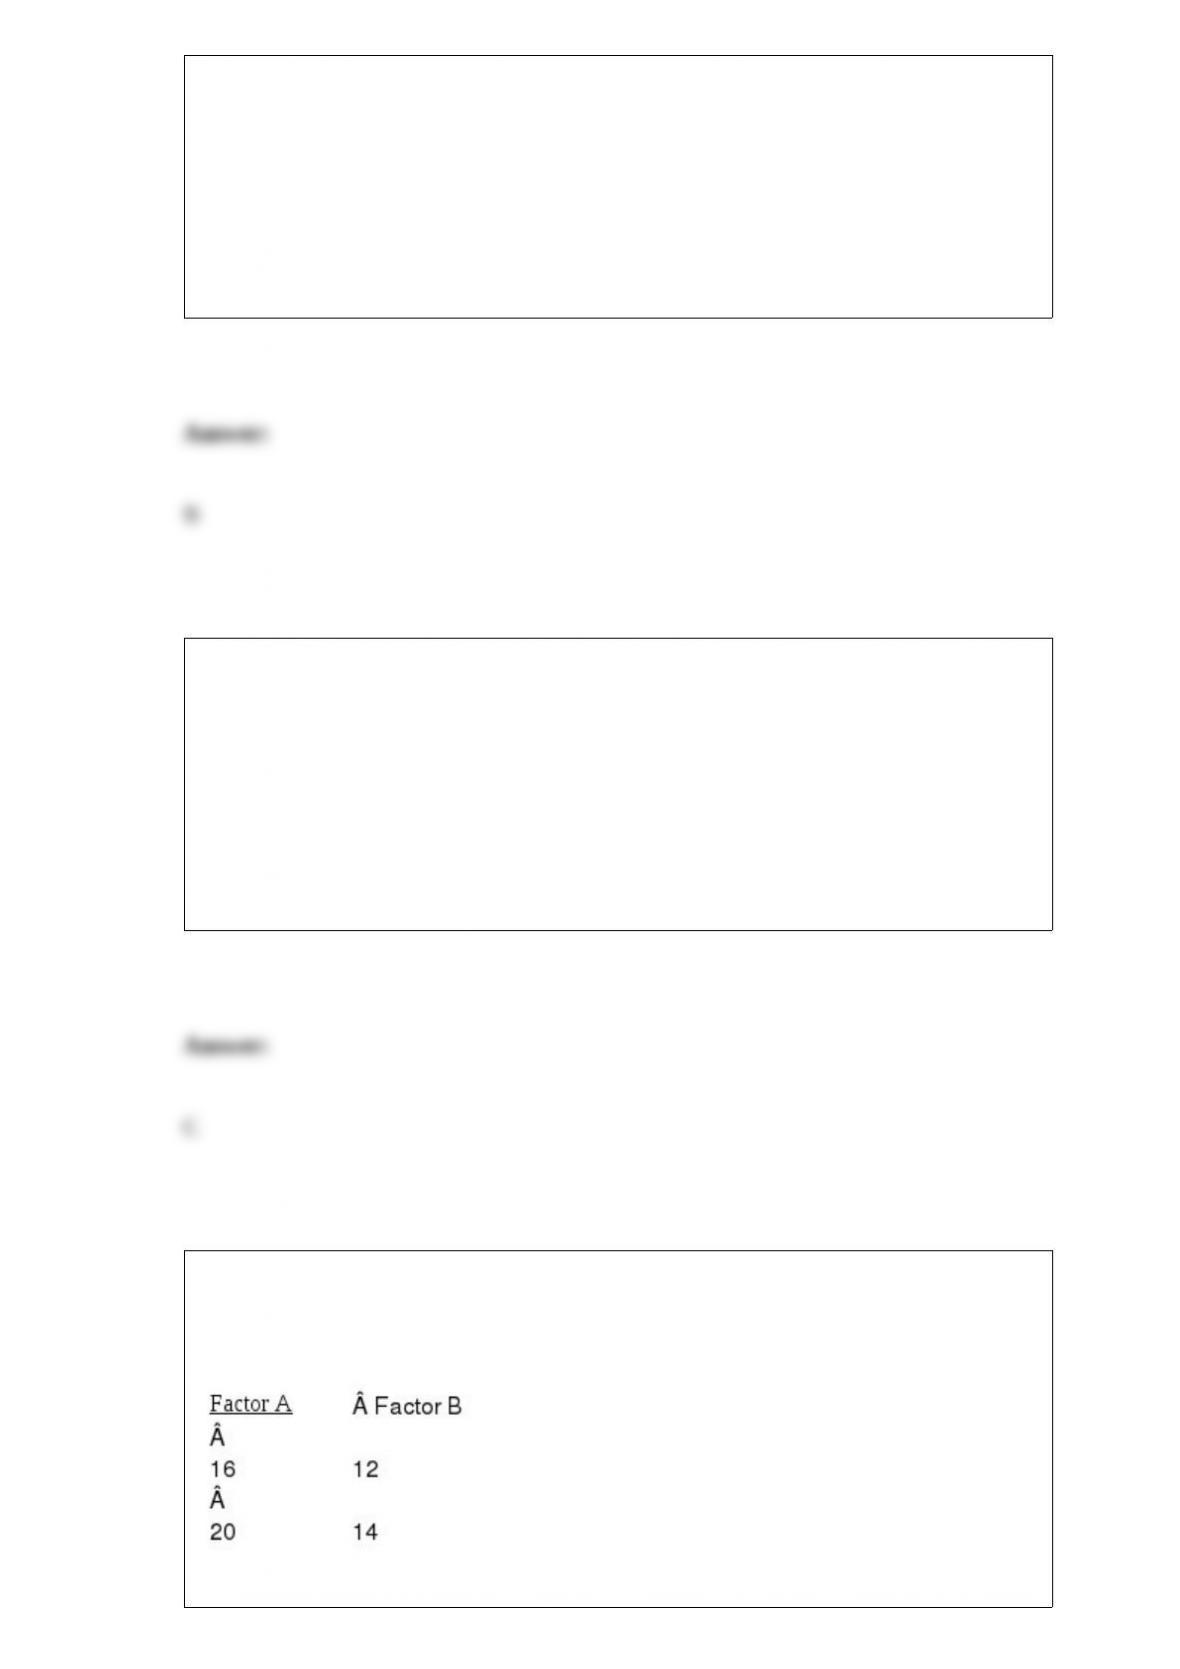
A factorial experiment involving 2 levels of factor A and 2 levels of factor
B resulted in the following.
Set up the ANOVA table and test for any significant main effect and any
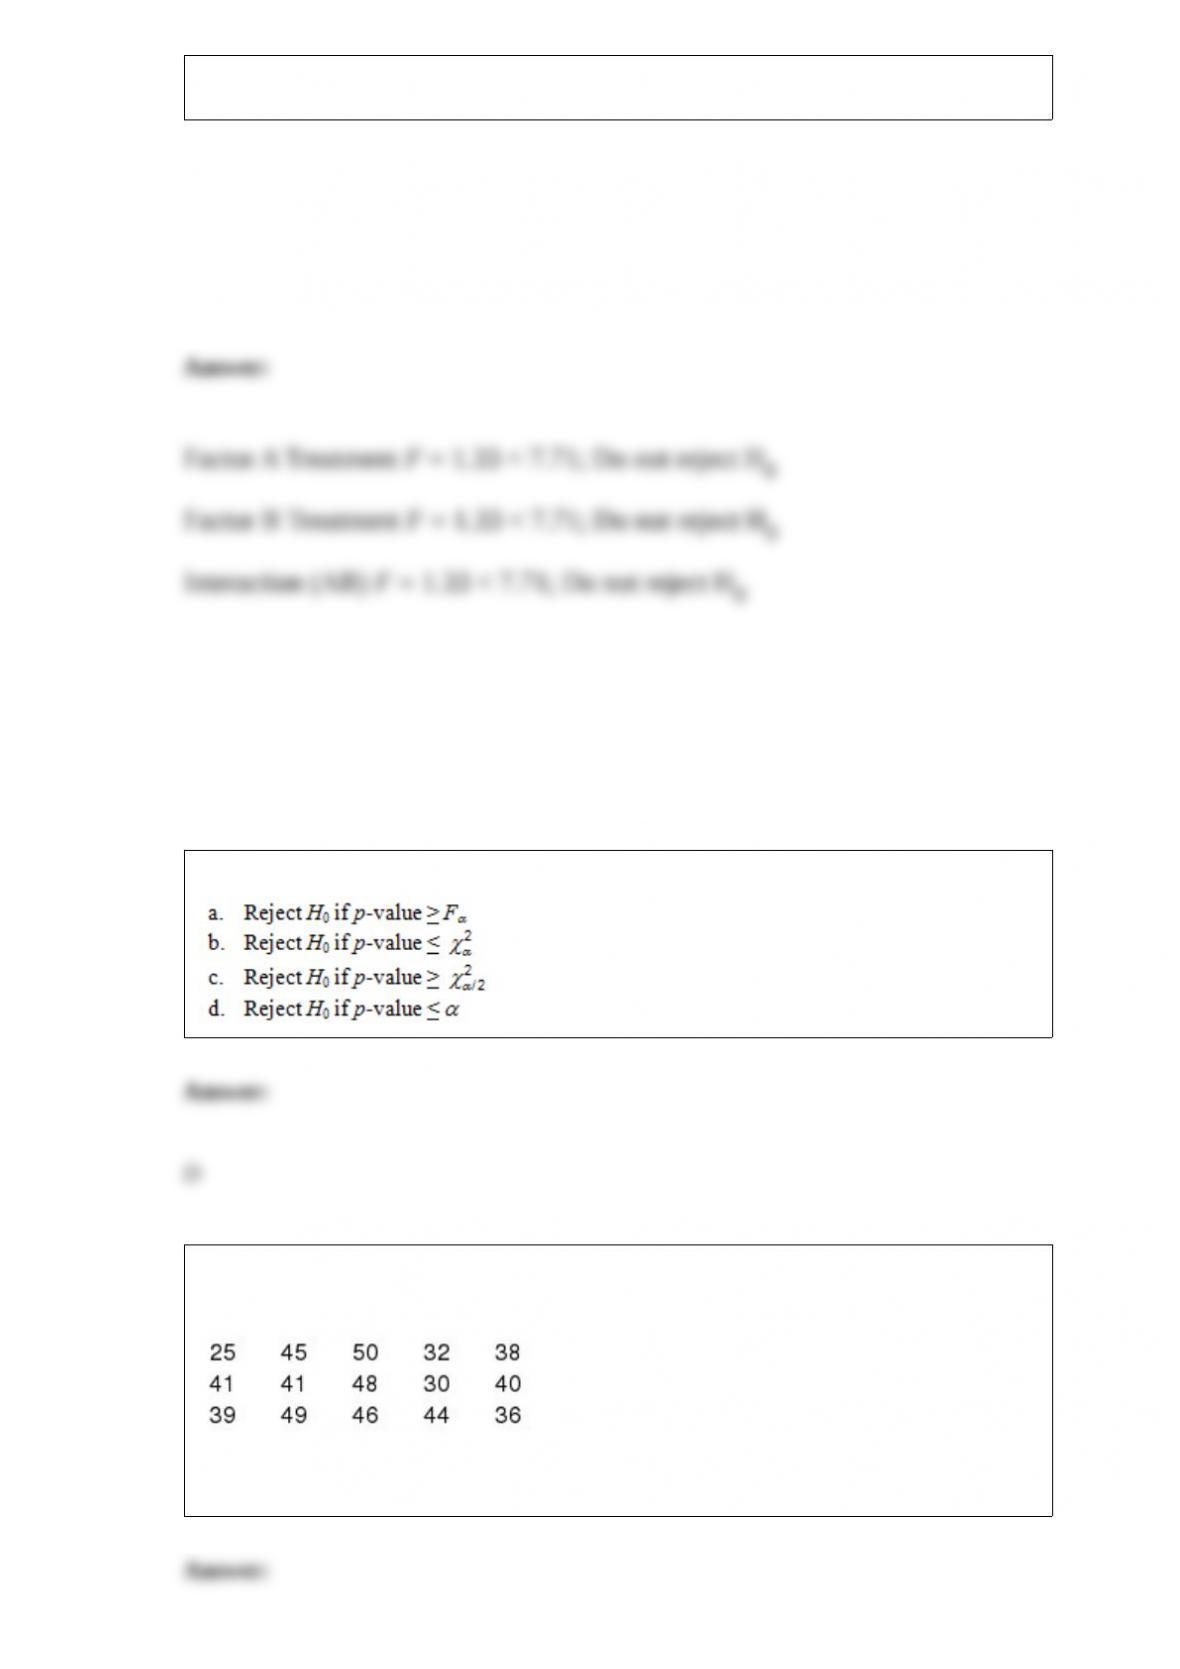
interaction effect. Use = .05.
Which of the following rejection rules is proper?
The time it takes to complete a test was recorded for a sample of 15 students. The
results follow.
Use Excel to estimate the variance with a 90% level of confidence.
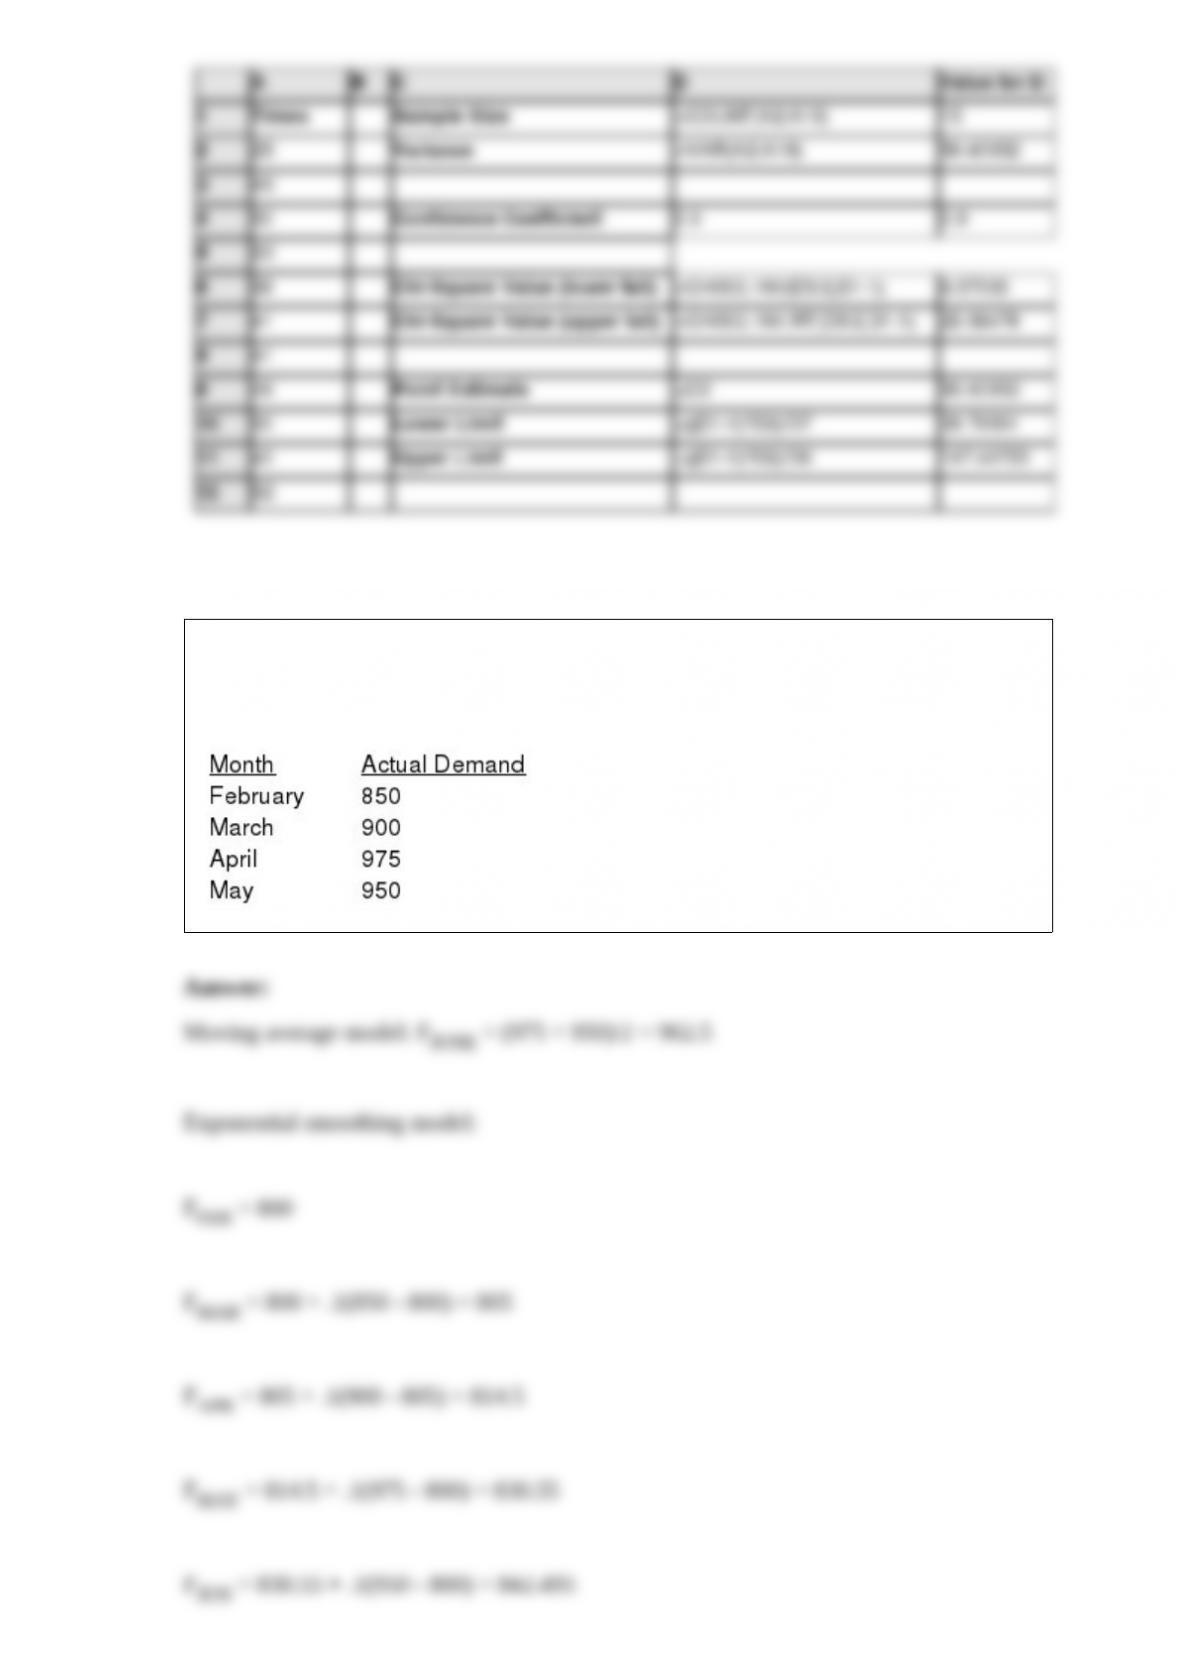
Based on the information shown below, develop forecasts for June using both a
2-period moving average model and an exponential smoothing model with = 0.10.
For the exponential smoothing model, assume the forecast for February was 800.
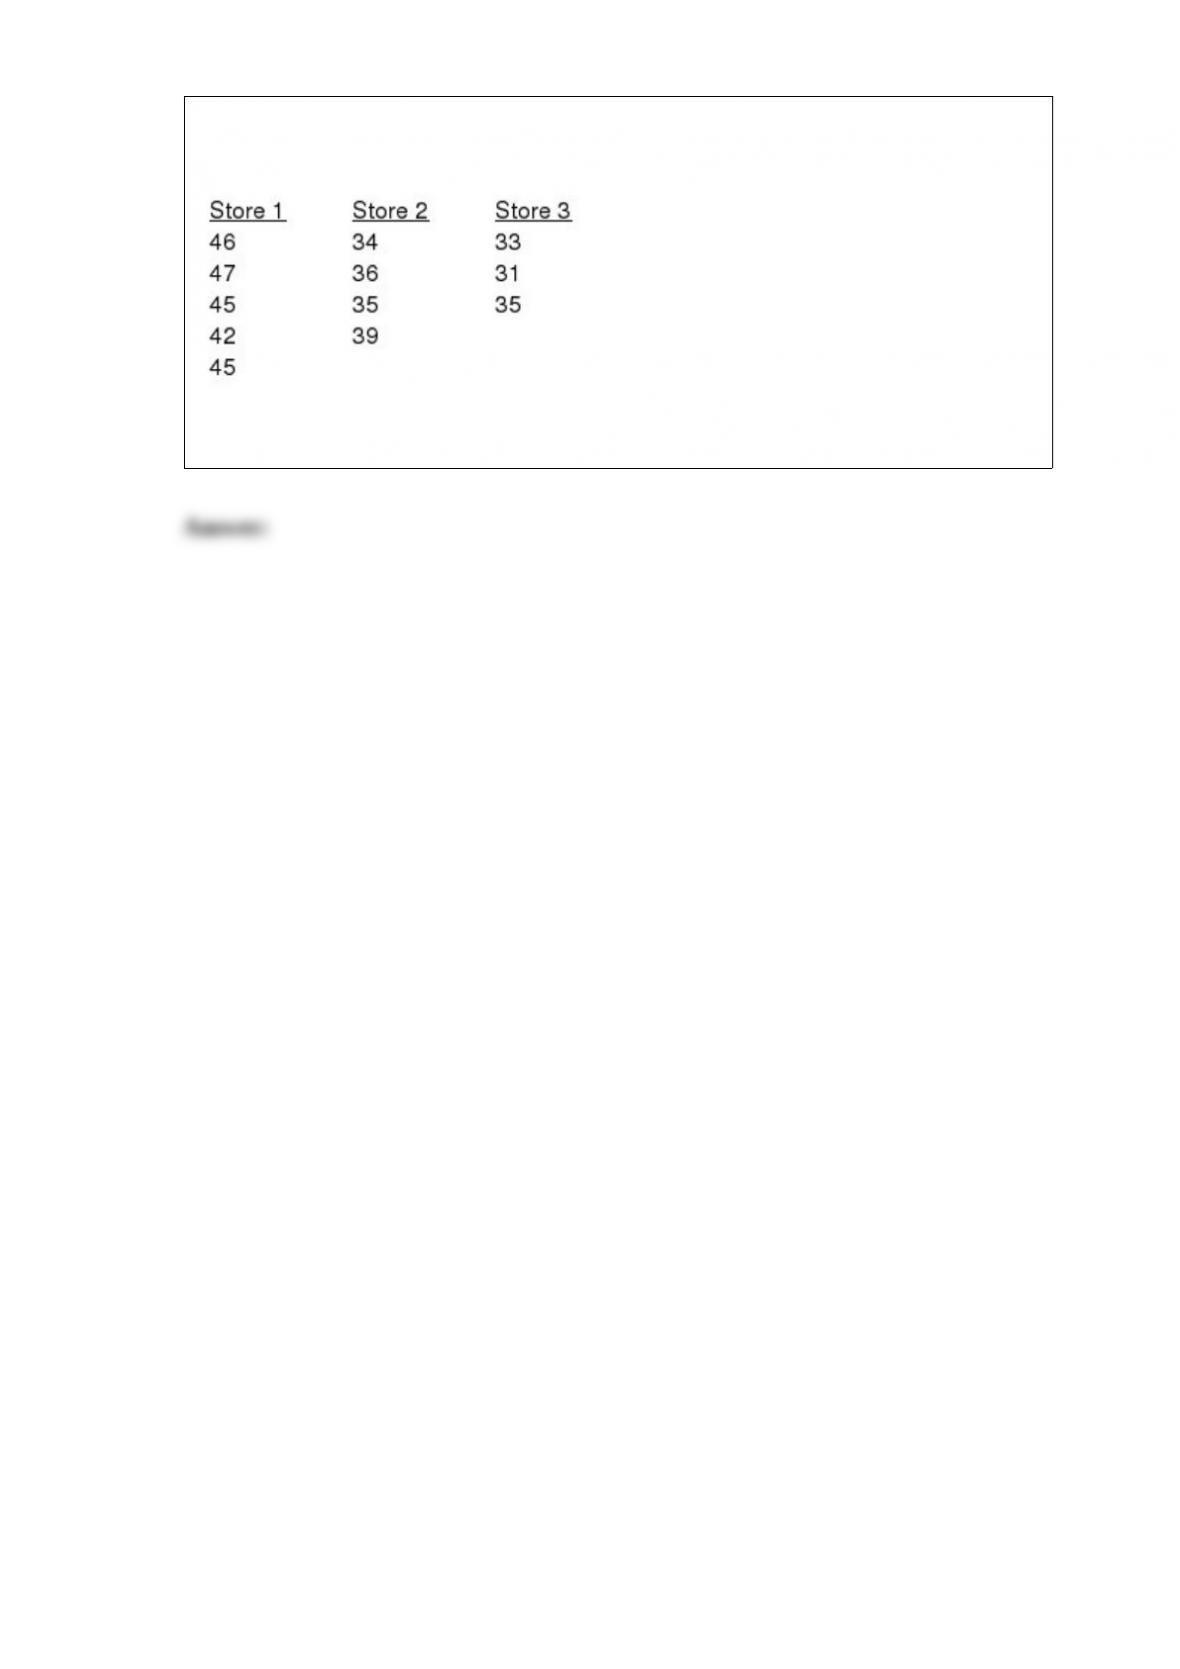
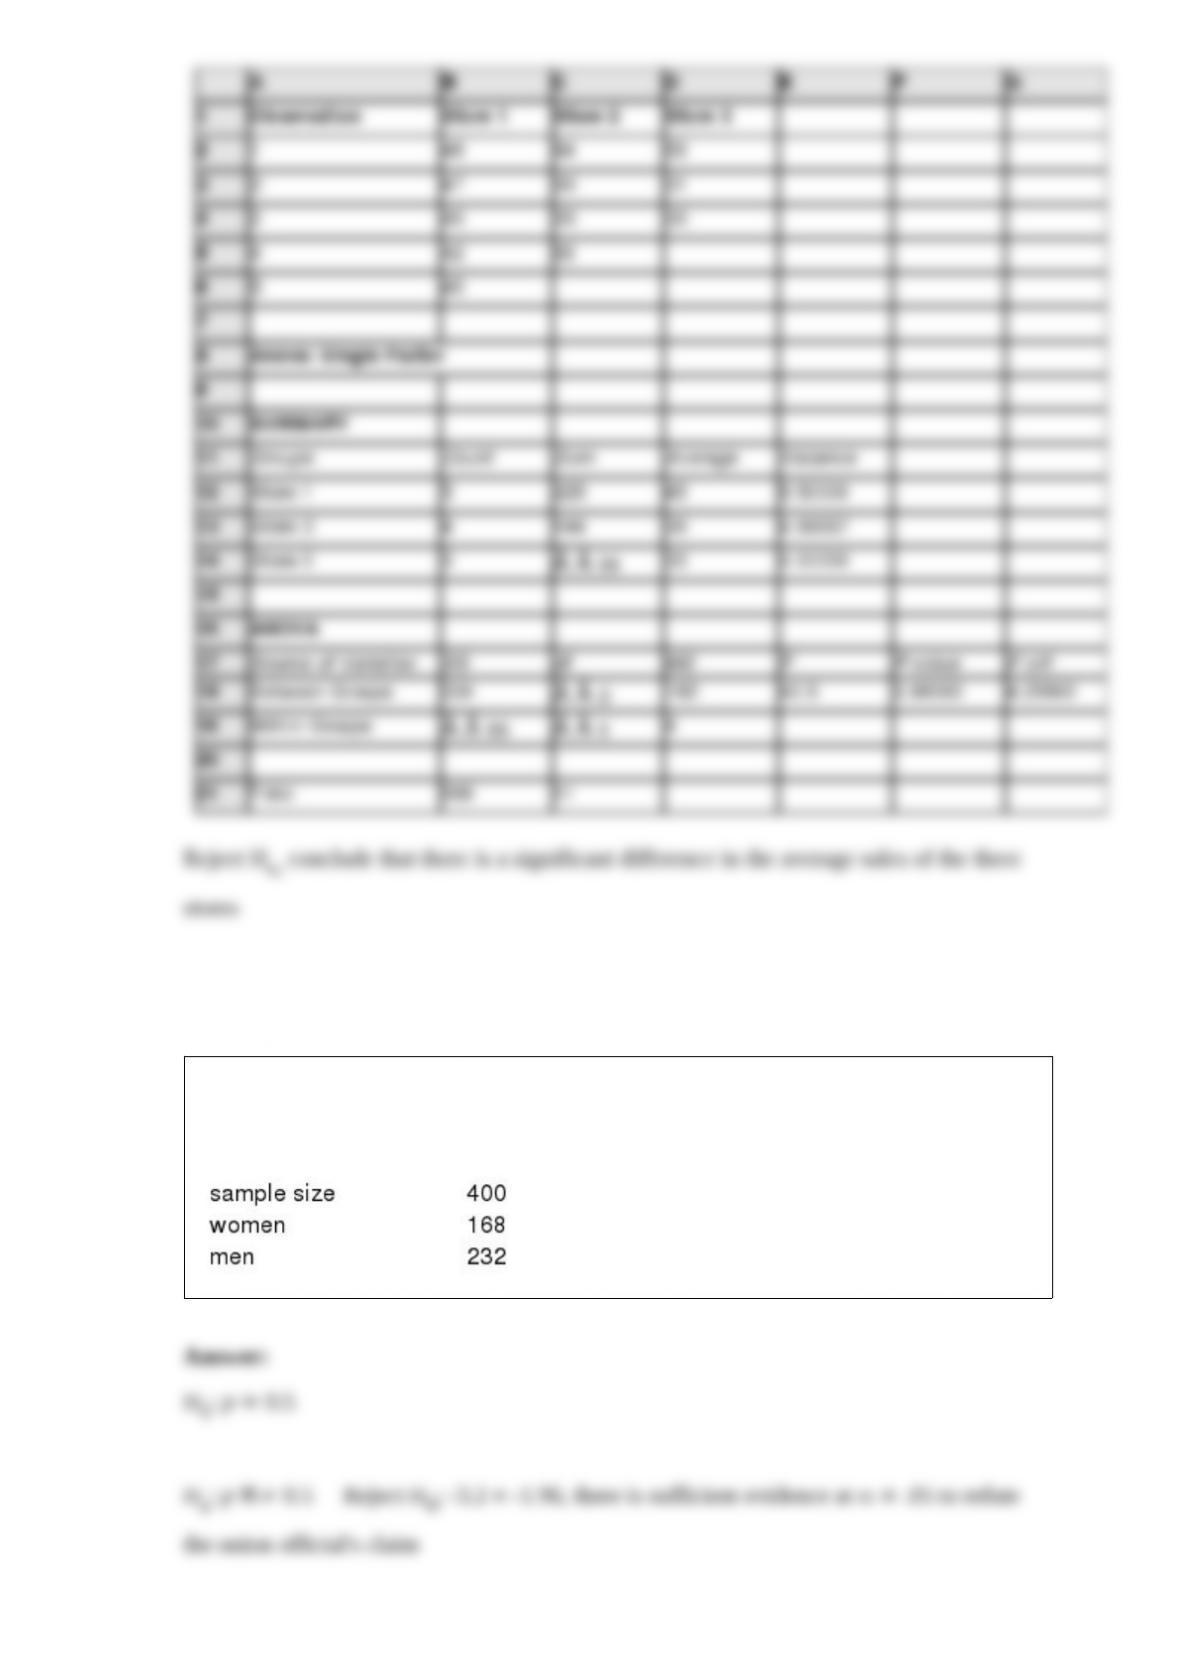
Halls, Inc. has three stores located in three different areas. Random samples of the sales
of the three stores (In $1,000) are shown below.
At a 5% level of significance, use Excel to test to see if there is a significant difference
in the average sales of the three stores.
An official of a large national union claims that the fraction of women in the union is
not significantly different from one-half. Using the sample information reported below,
carry out a test of this statement. Use a .05 level of significance.