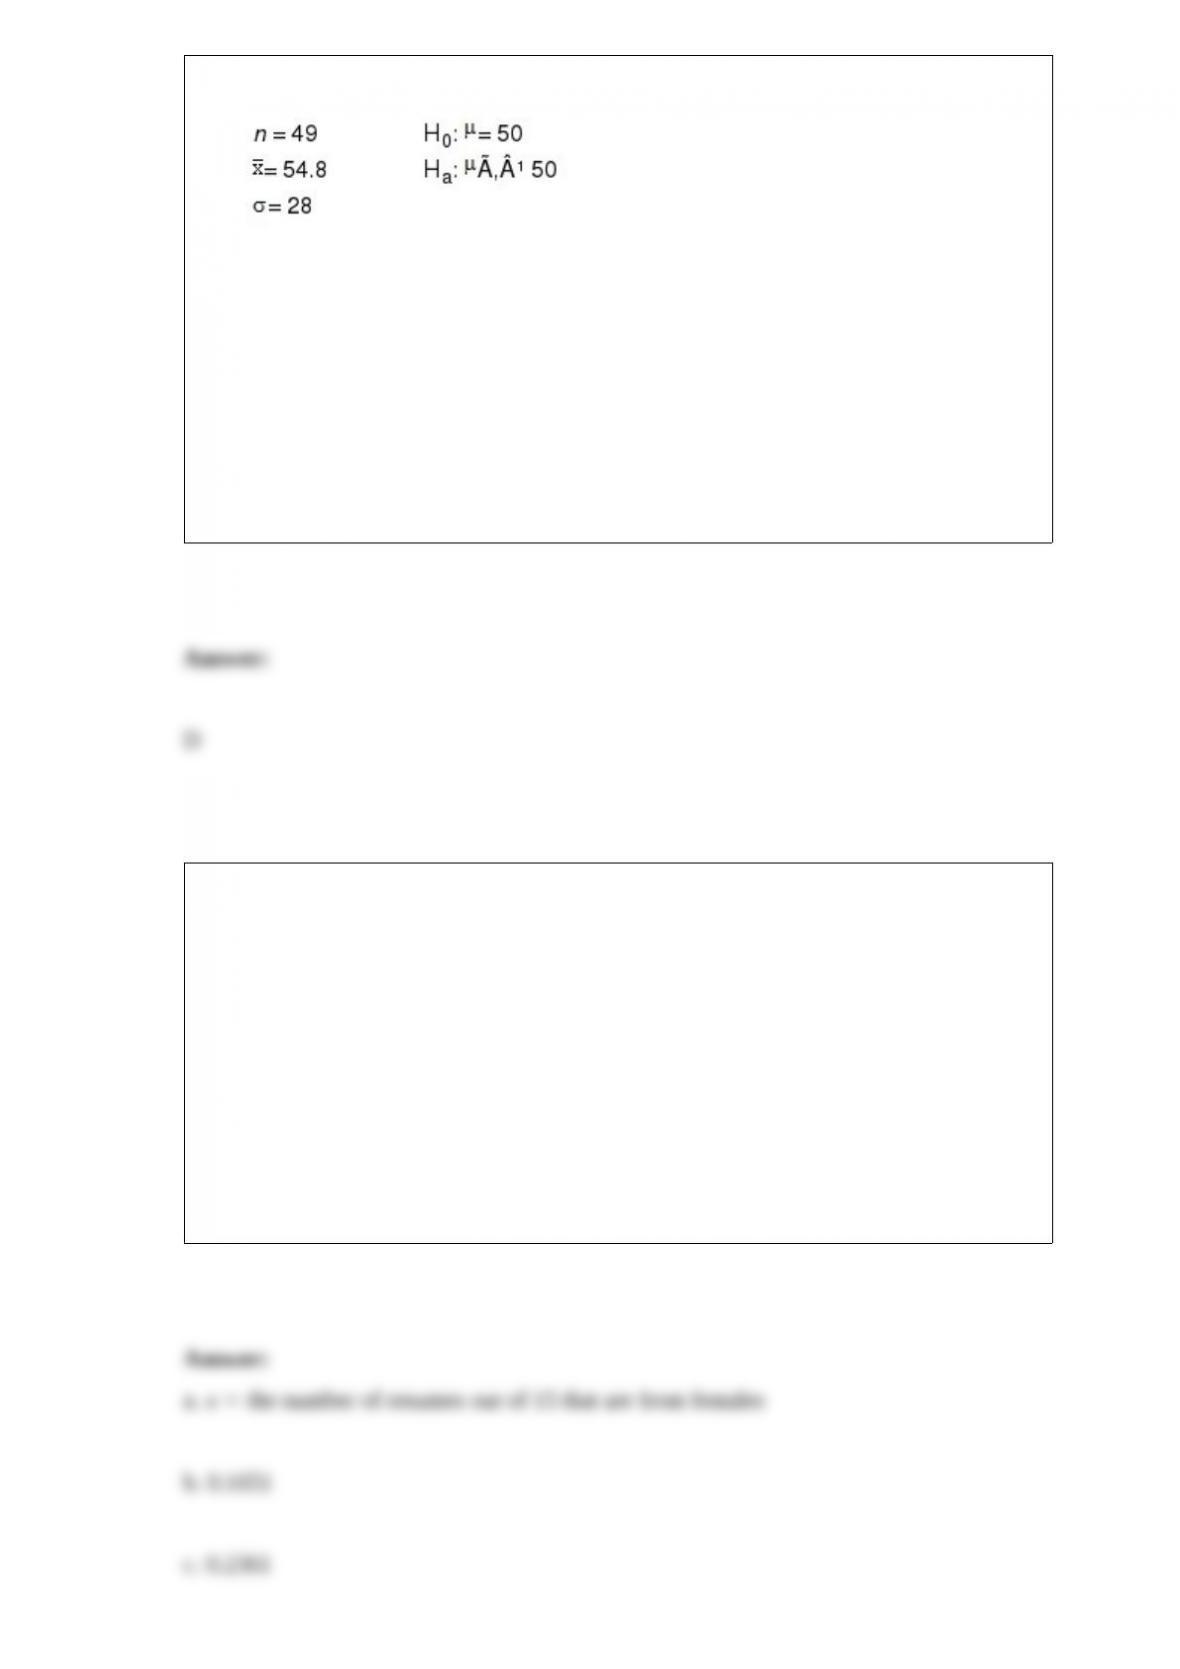
Exhibit 9-3
Refer to Exhibit 9-3. The p-value is equal to
a. 0.1151
b. 0.3849
c. 0.2698
d. 0.2302
Twenty-five percent of all resumes received by a corporation for a management position
are from females. Fifteen resumes will be received tomorrow.
a. Define the random variable in words for this experiment.
b. What is the probability that exactly 5 of the resumes will be from females?
c. What is the probability that fewer than 3 of the resumes will be from females?
d. What is the expected number of resumes from women?
e. What is the variance of the number of resumes from women?
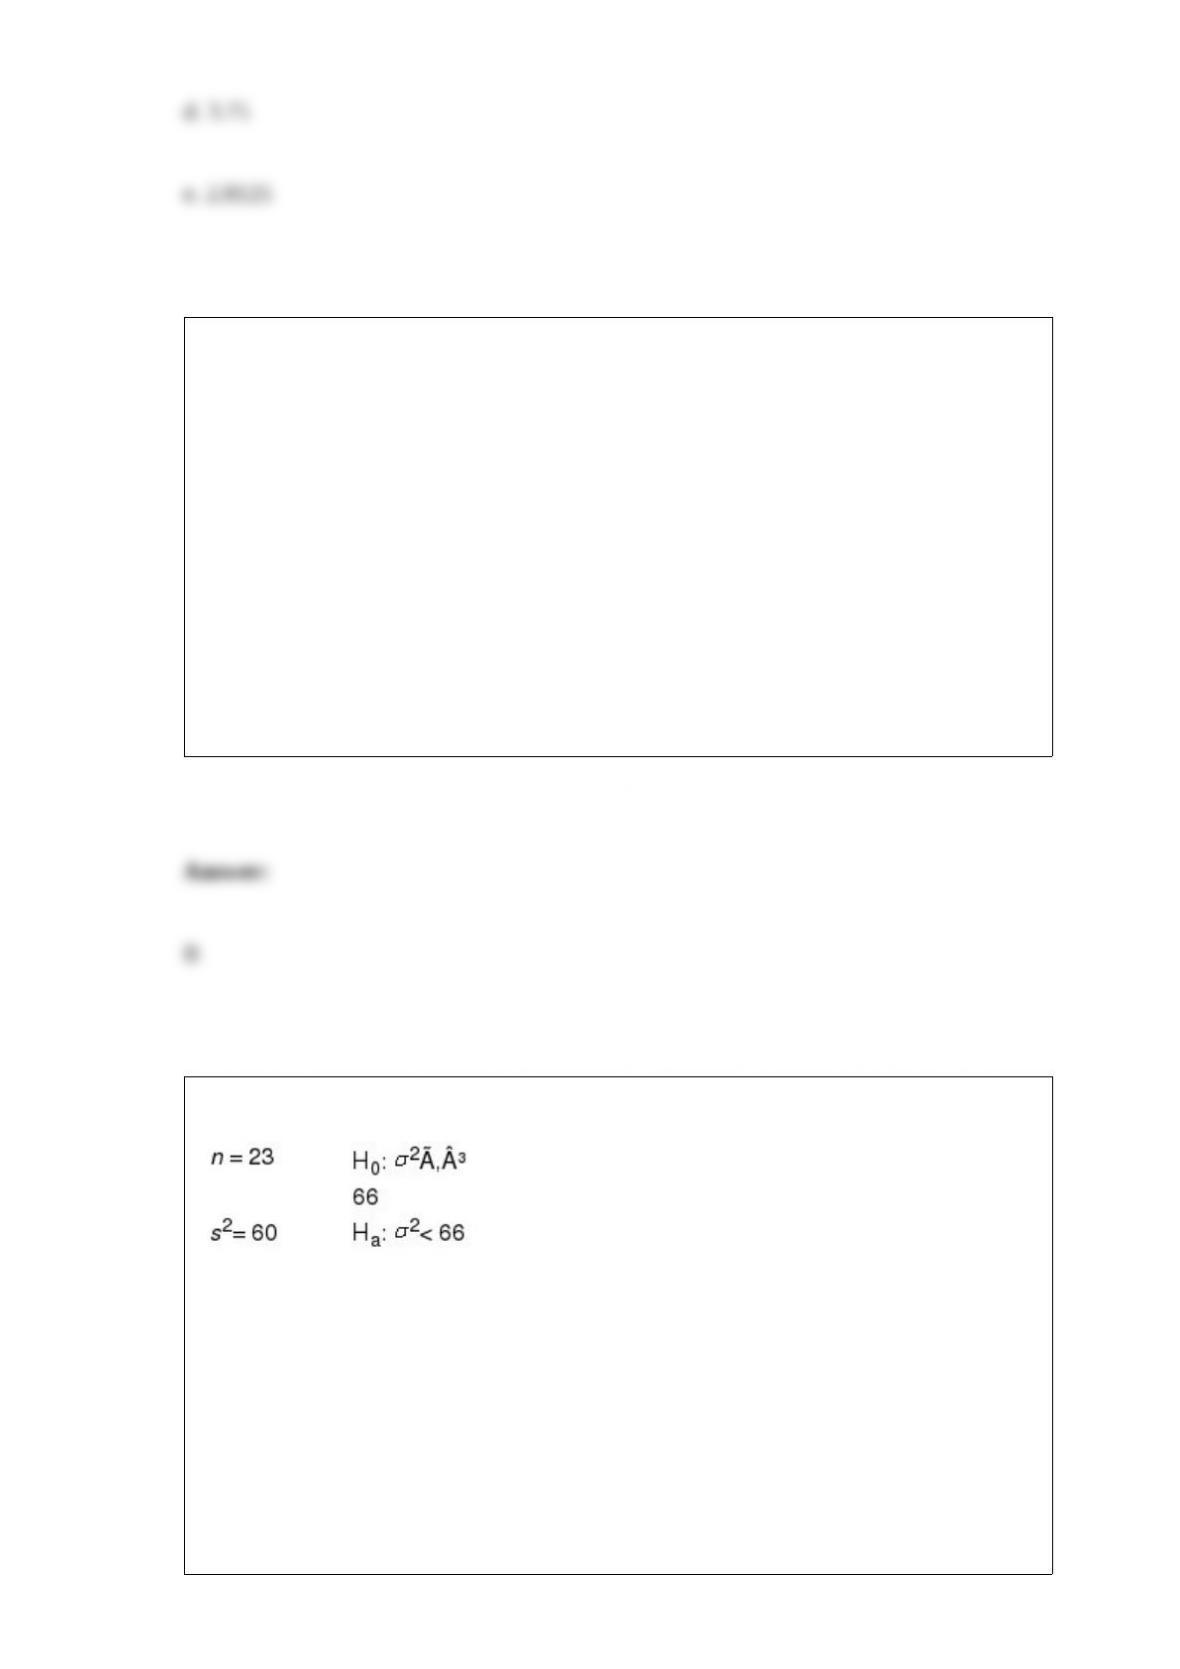
Exhibit 5-10
The probability that Pete will catch fish on a particular day when he goes fishing is 0.8.
Pete is going fishing 3 days next week.
Refer to Exhibit 5-10. The variance of the number of days Pete will catch fish is
a. .16
b. .48
c. .8
d. 2.4
Exhibit 11-8
Refer to Exhibit 11-8. The test statistic has a value of
a. 20.91
b. 24.20
c. 24.00
d. 20.00

Exhibit 14-6
You are given the following information about y and x.
Refer to Exhibit 14-6. The least squares estimate of b1 equals
a. 1
b. -1
c. -11
d. 11
Posterior probabilities are
a. simple probabilities
b. marginal probabilities
c. joint probabilities
d. conditional probabilities

A population where each element of the population is assigned to one and only one of
several classes or categories is a
a. multinomial population
b. Poisson population
c. normal population
d. None of these alternatives is correct.
The manager of Hudson Auto Repair would like to get a beer picture of the
distribution of costs for new parts used in the engine tune-up jobs done in the garage.
A sample of 50 customer invoices for tune-ups has been taken and the costs of parts,
rounded to the nearest dollar, are listed below.
Develop a frequency distribution for these cost data. Use your own
judgment to determine the number of classes and class width that provide a
distribution that will be meaningful and helpful to the manager.
a. Develop a stem-and-leaf display showing both the rank order and shape
of the data set.
b. Develop a stretched stem-and-leaf display using two stems for each
leading digit(s).
c. Which display is better at revealing the natural grouping and variation in
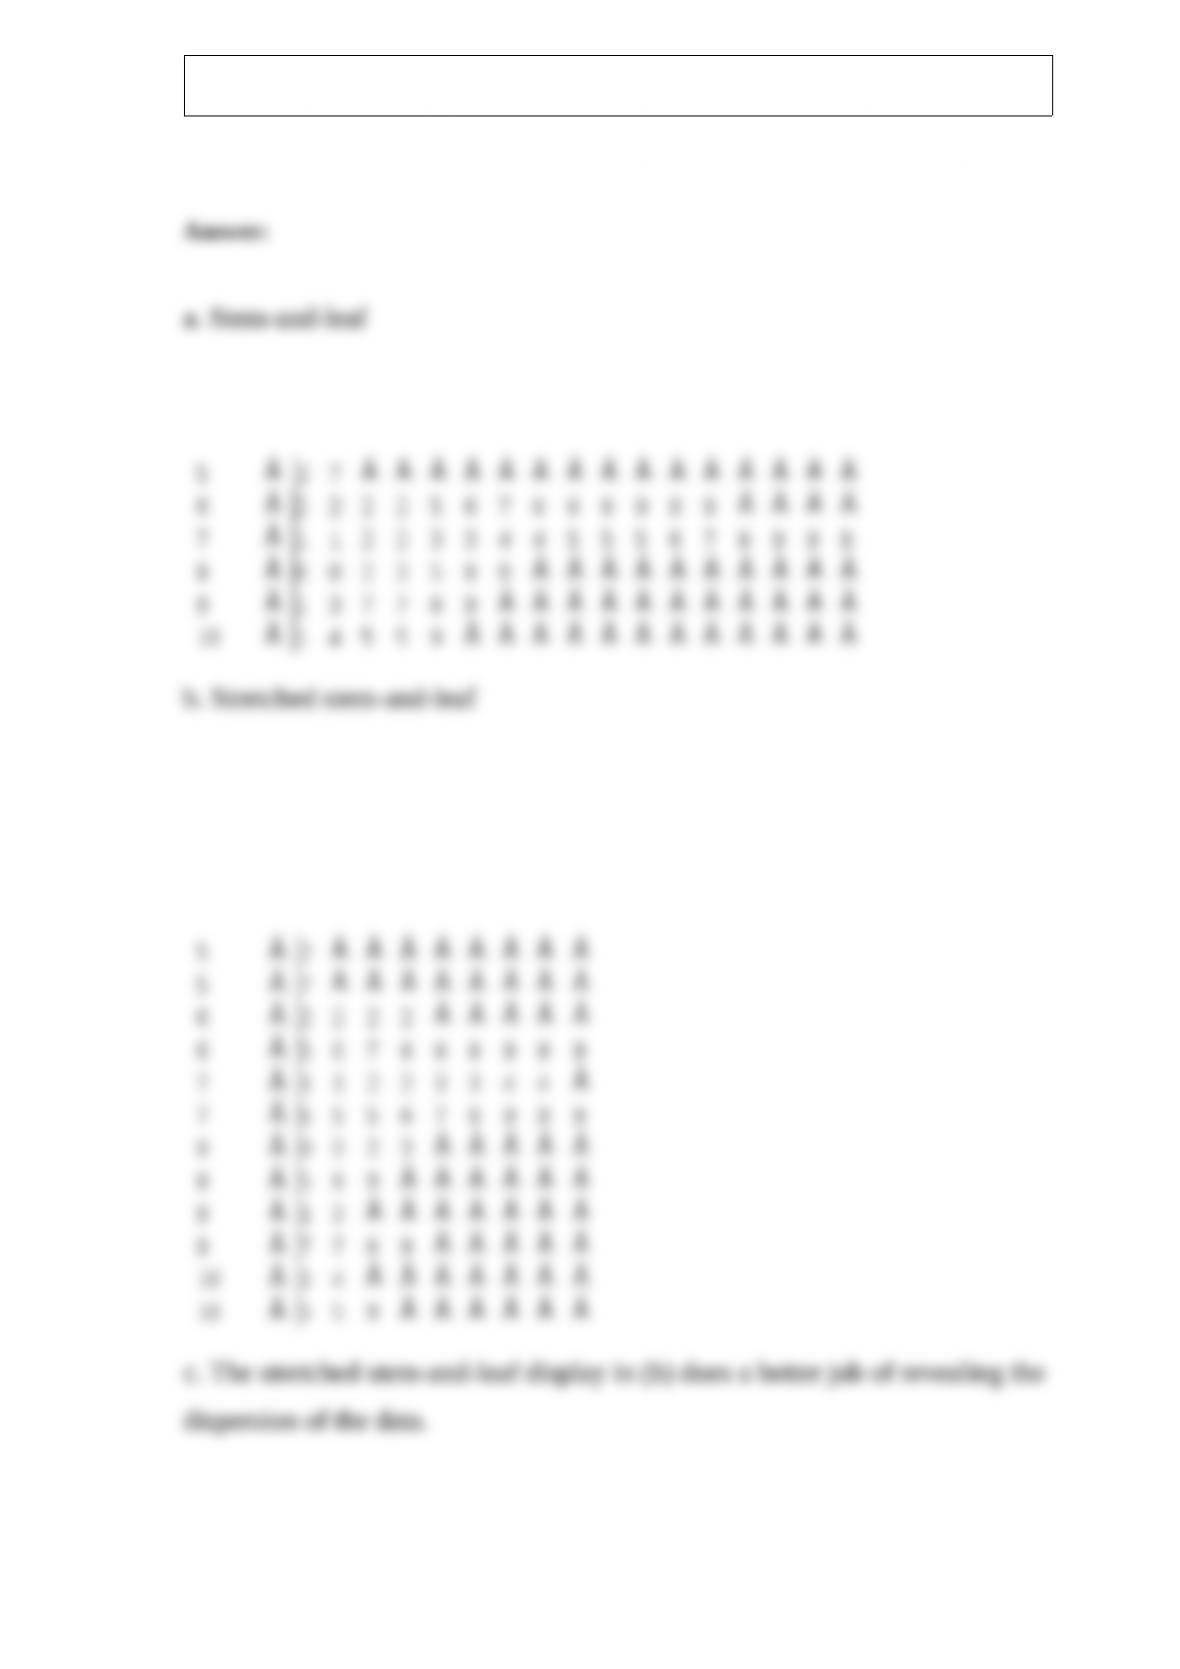
the data?

Exhibit 6-6
The life expectancy of a particular brand of tire is normally distributed with a mean of
40,000 and a standard deviation of 5,000 miles.
Refer to Exhibit 6-6. What is the probability that a randomly selected tire will have a
life of at least 30,000 miles?
a. 0.4772
b. 0.9772
c. 0.0228
d. None of the alternative answers is correct.
A light bulb manufacturer claims its light bulbs will last 500 hours on the average. The
lifetime of a light bulb is assumed to follow an exponential distribution.
a. What is the probability that the light bulb will have to be replaced within 500 hours?
b. What is the probability that the light bulb will last more than 1000 hours?
c. What is the probability that the light bulb will last between 200 and 800 hours.
A sample of 4 clusters is to be taken from a population with N = 50 clusters and M =
800 elements in the population. The values of Mi and Xi for each cluster are shown
below.
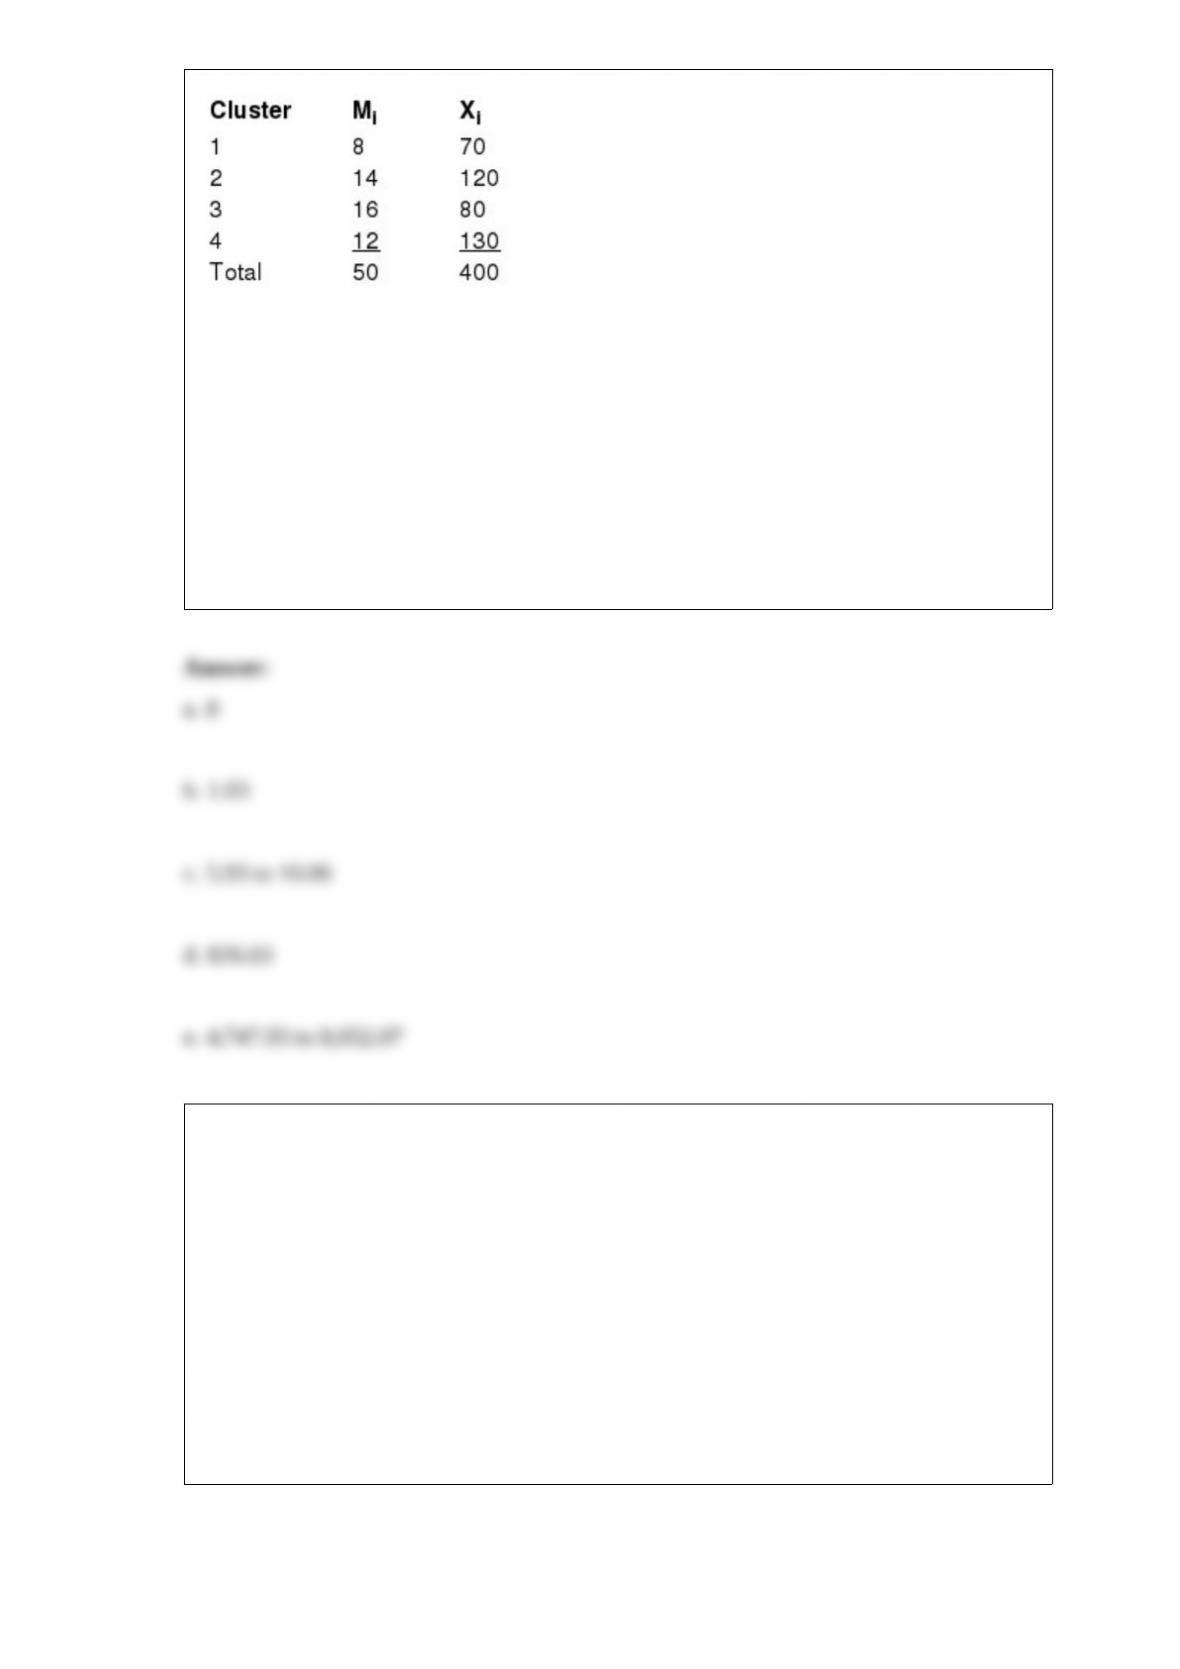
a. Determine the point estimate of the population mean.
b. Determine the standard error of the mean.
c. Develop a 95% confidence interval for the population mean.
d. Determine the point estimator of the population total.
e. Approximate a 95% confidence interval estimate of the population total.
Safety Insurance Company has compiled the following statistics. For any one-year
period:
P(accident | male driver under 25) = .22
P(accident | male driver over 25) = .15
P(accident | female driver under 25) = .16
P(accident | female driver over 25) = .14
The percentage of Safety’s policyholders in each category is:

a. What is the probability that a randomly selected policyholder will have an accident
within the next year?
b. Given that a driver has an accident, what is the probability the driver is a male over
25?
c. Given that a driver has no accident, what is the probability the driver is a female?
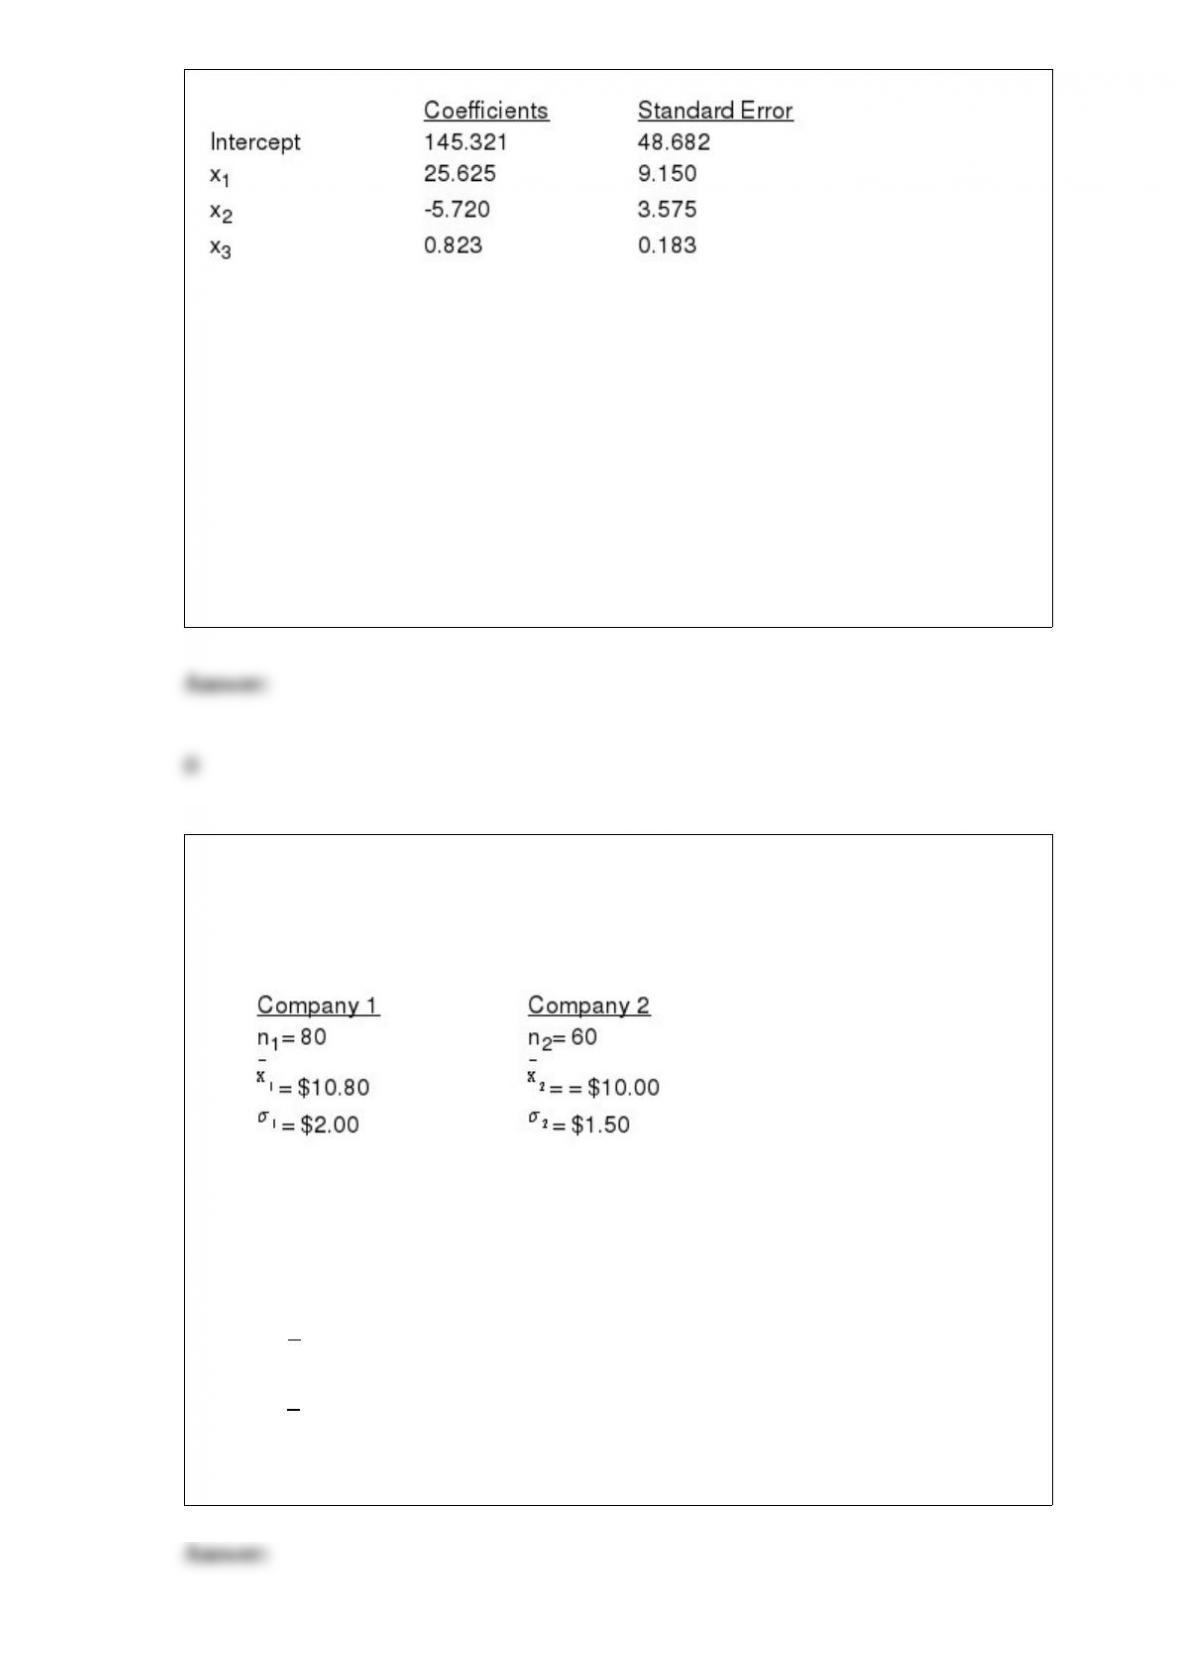
Exhibit 15-4
a. y = 0 + 1x1 + 2x2 +
b. E(y) = 0 + 1x1 + 2x2
c. = bo + b1 x1 + b2 x2
d. E(y) = 0 + 1x1 + 2x2
Refer to Exhibit 15-4. Which equation describes the multiple regression equation?
a. equation a
b. equation b
c. equation c
d. equation d
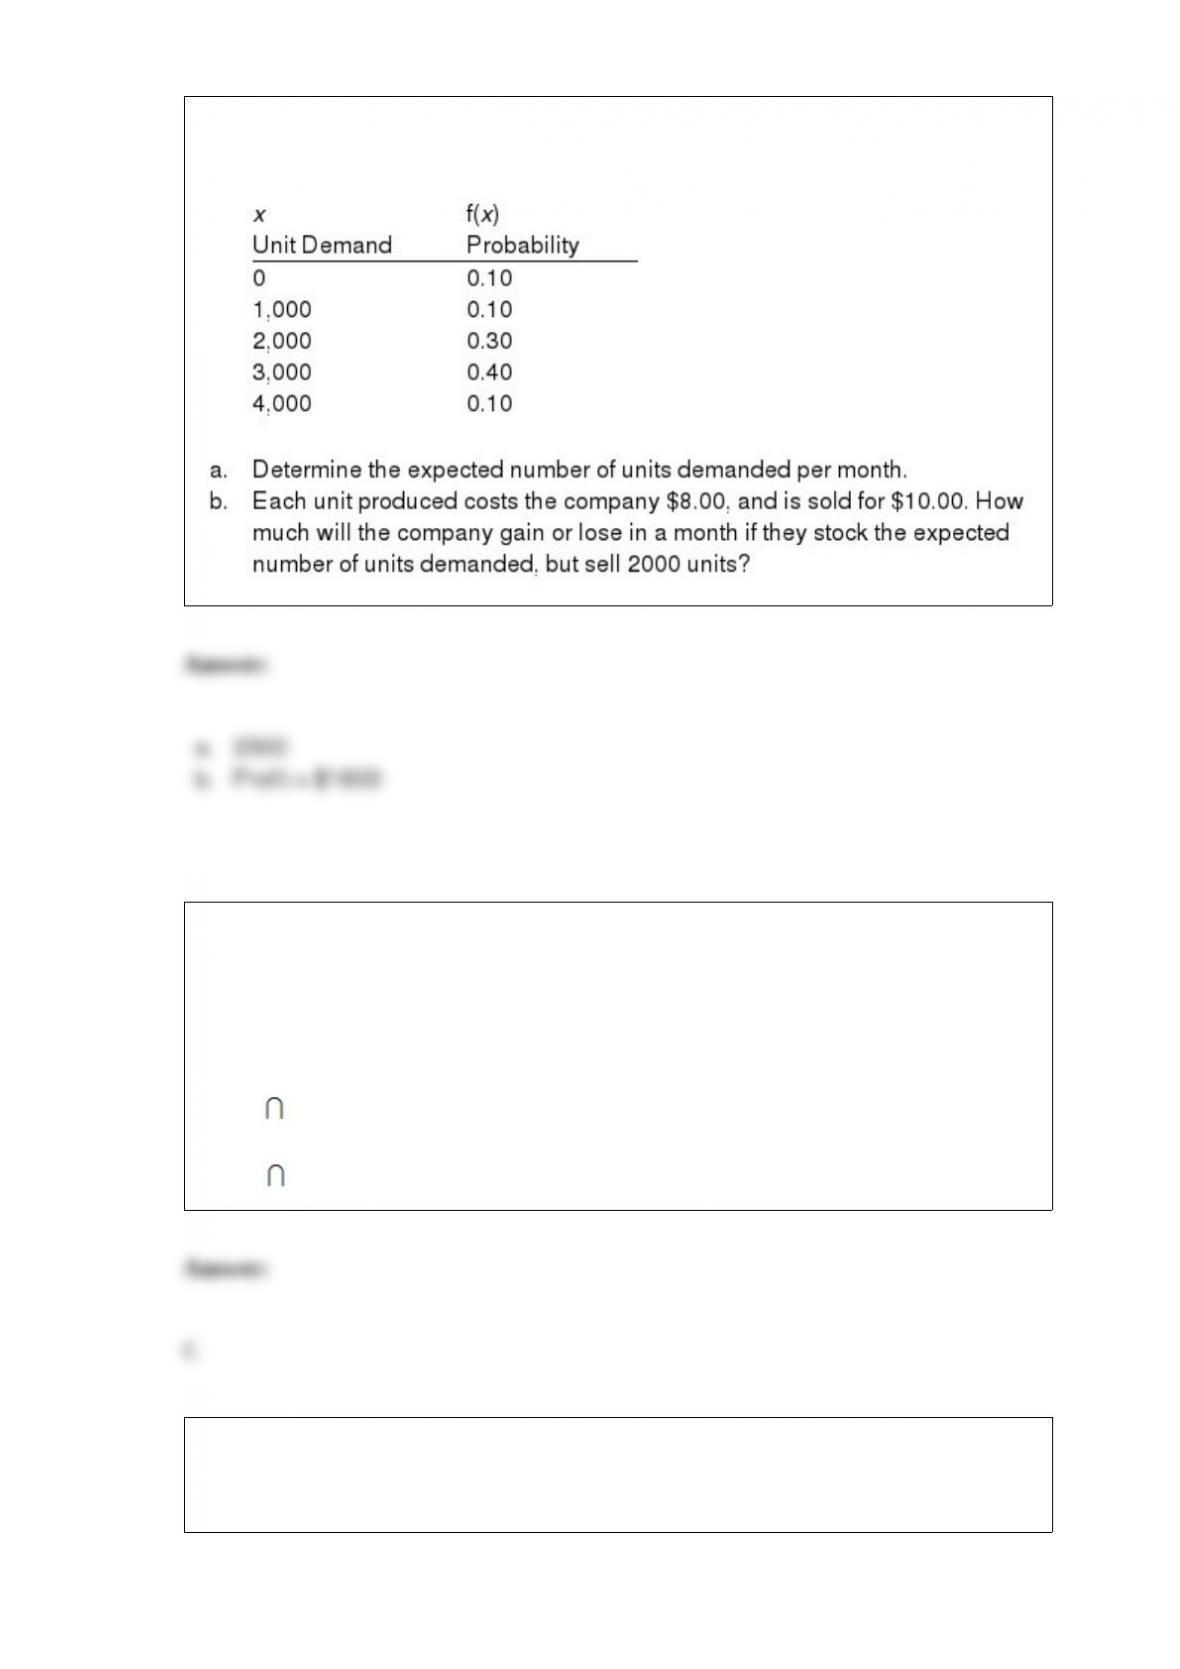
The demand for a product varies from month to month. Based on the past year’s data,
the following probability distribution shows MNM company’s monthly demand.
If A and B are mutually exclusive, then
a. P(A) + P(B) = 0
b. P(A) + P(B) = 1
c. P(A B) = 0
d. P(A B) = 1
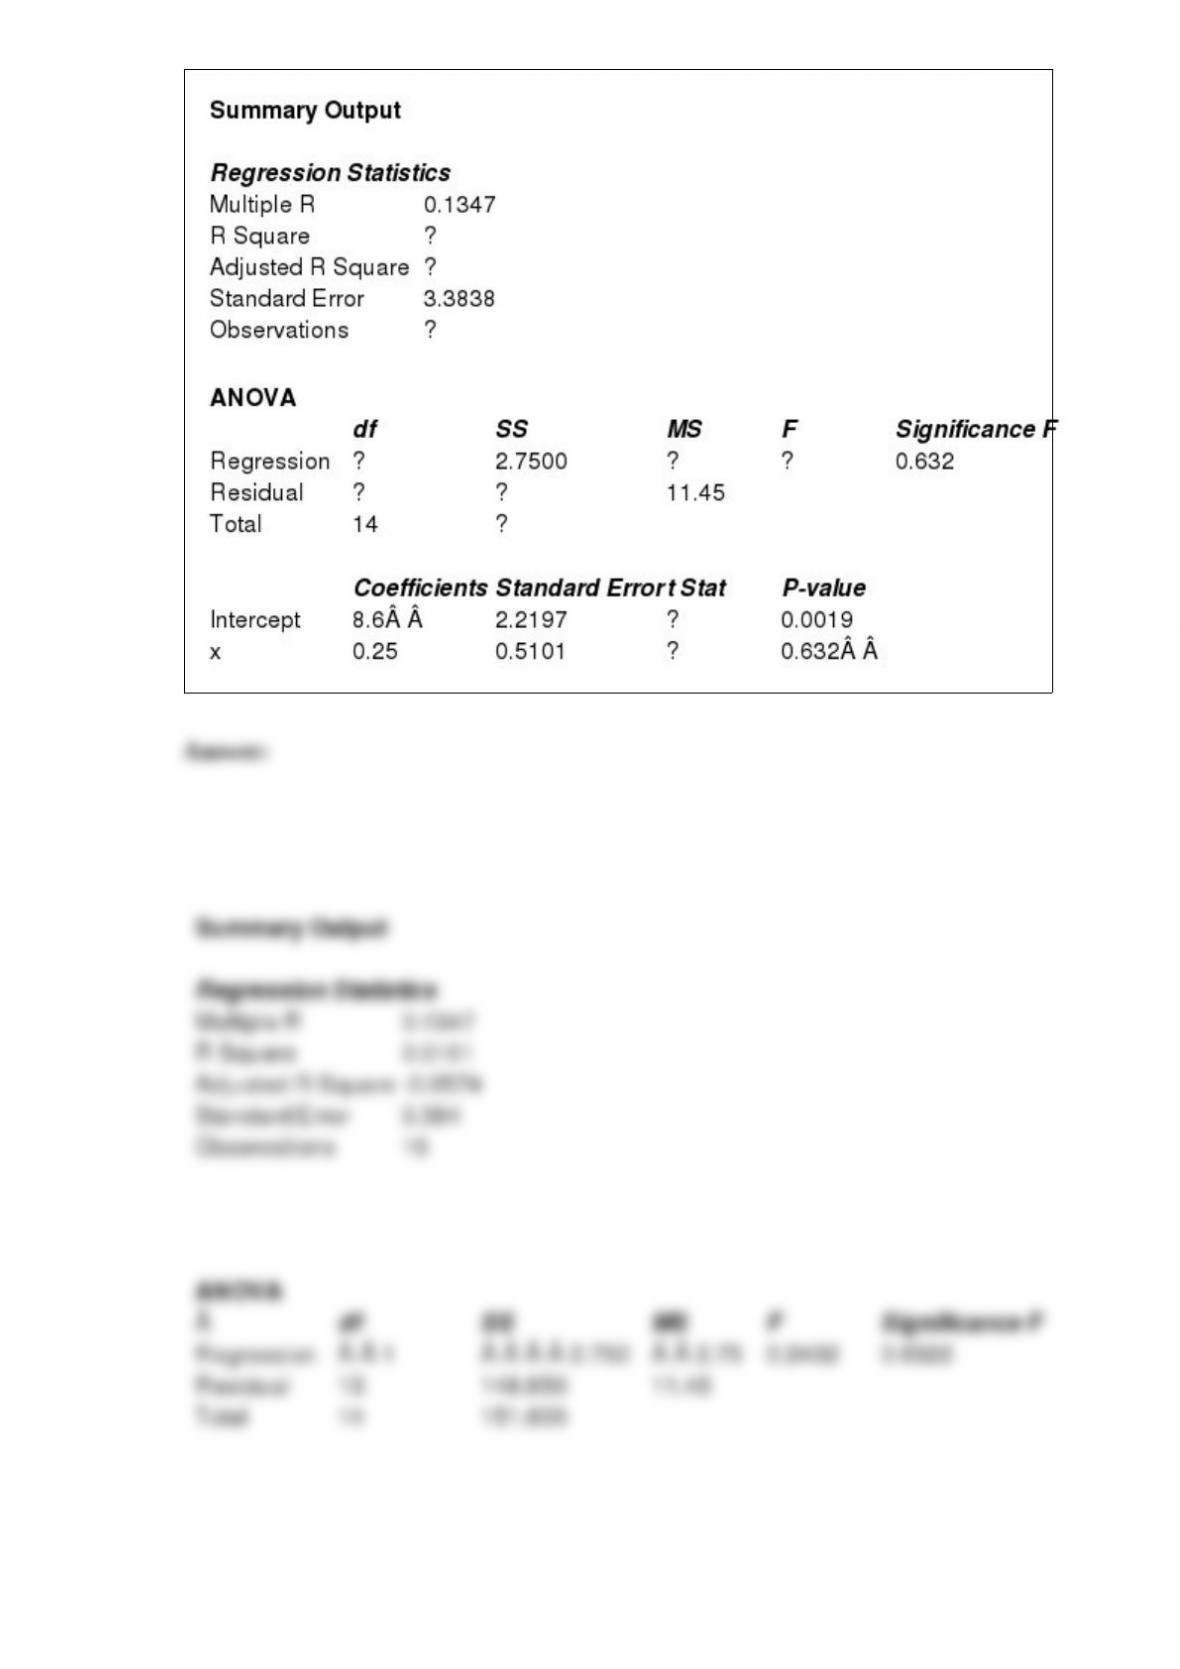
Exhibit 15-5
Below you are given a partial Excel output based on a sample of 25 observations.
Refer to Exhibit 15-5. We want to test whether the parameter 1 is significant. The test
statistic equals
a. 0.357
b. 2.8
c. 14
d. 1.96
Exhibit 10-13
In order to determine whether or not there is a significant difference between the hourly
wages of two companies, the following data have been accumulated.
Refer to Exhibit 10-13. The null hypothesis for this test is
a. 1 – 2 0
b. 1 – 2> 0
c. 1 – 2< 0
d. 1 – 2 = 0

The empirical rule states that, for data having a bell-shaped distribution, the percentage
of data values being within one standard deviation of the mean is approximately
a. 33
b. 50
c. 68
d. 95
An acceptance sampling plan with n = 20 and c = 1 has been designed with a producer’s
risk of .12.
a. Was the value of p0 equal to .02, .03, .04, or .05?
b. What is the consumer’s risk associated with this plan if p1 is .08?
c. Assume the consumer’s risk found in (b) is unacceptably high. Which modification of
the sampling plan will result in the greater reduction of the consumer’s risk, increasing
n to 30 or decreasing c to 0?
Exhibit 12-3
In order to determine whether or not a particular medication was effective in curing the
common cold, one group of patients was given the medication, while another group
received sugar pills. The results of the study are shown below.

We are interested in determining whether or not the medication was effective in curing
the common cold.
Refer to Exhibit 12-3. The expected frequency of those who received medication and
were cured is
a. 70
b. 150
c. 28
d. 48
The process of revising prior probabilities to create posterior probabilities based on
sample information is a
a. revision process
b. sampling revision
c. Bayesian revision
d. posterior revision
A random sample of ten examination papers in a course that was given on a pass or fail
basis showed the following scores.

a. What is the point estimate for the mean of the population?
b. What is the point estimate for the standard deviation of the population?
c. What is the point estimate for the proportion of all students who passed the course?
During lunchtime, customers arrive at Bob’s Drugs according to a Poisson distribution
with = 4 per minute.
a. During a one minute interval, determine the following probabilities: (1) no arrivals;
(2) one arrival; (3) two arrivals; and, (4) three or more arrivals.
b. What is the probability of two arrivals in a two-minute period?
Part of an Excel output relating X (independent variable) and Y (dependent variable) is
shown below. Fill in all the blanks marked with “?”.
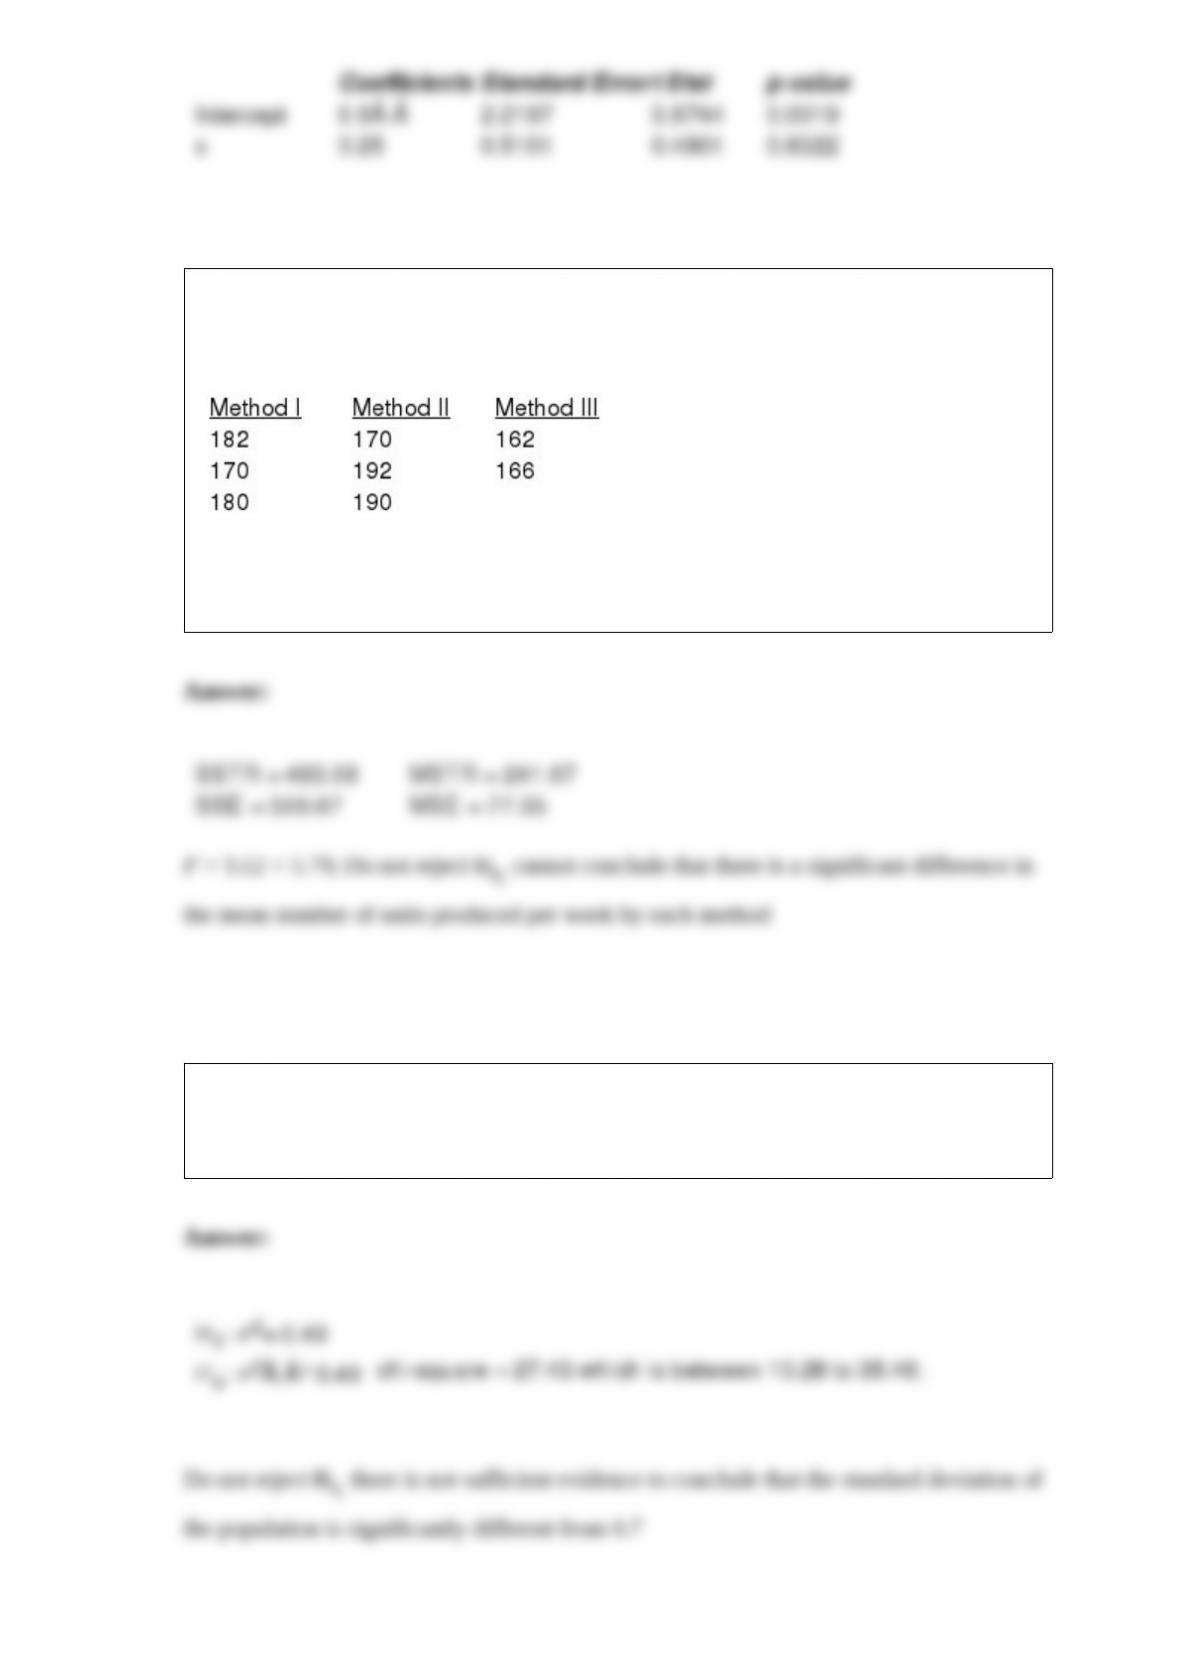
In order to test to see if there is any significant difference in the mean number of units
produced per week by each of three production methods, the following data were
collected:
At the Alpha = 0.05 level of significance, is there any difference in the mean number of
units produced per week by each method? Show the complete ANOVA table. (Please
note that the sample sizes are not equal.)
A sample of 22 bottles of soft drink showed a variance of 0.64 in their contents. At a
5% level of significance, determine whether or not the standard deviation of the
population is significantly different from 0.7.
A statistician selected a sample of 16 accounts receivable and determined the mean of
the sample to be $5,000 with a standard deviation of $400. She reported that the sample
information indicated the mean of the population ranges from $4,739.80 to $5,260.20.
She did not report what confidence coefficient she had used. Based on the above
information, determine the confidence coefficient that was used.
An egg packing company has stated that the standard deviation of the weights of their
grade A large eggs is 0.07 ounces or less. The sample variance for 51 eggs was 0.0065
ounces. Can this sample result confirm the company’s claim? Use = 0.1.
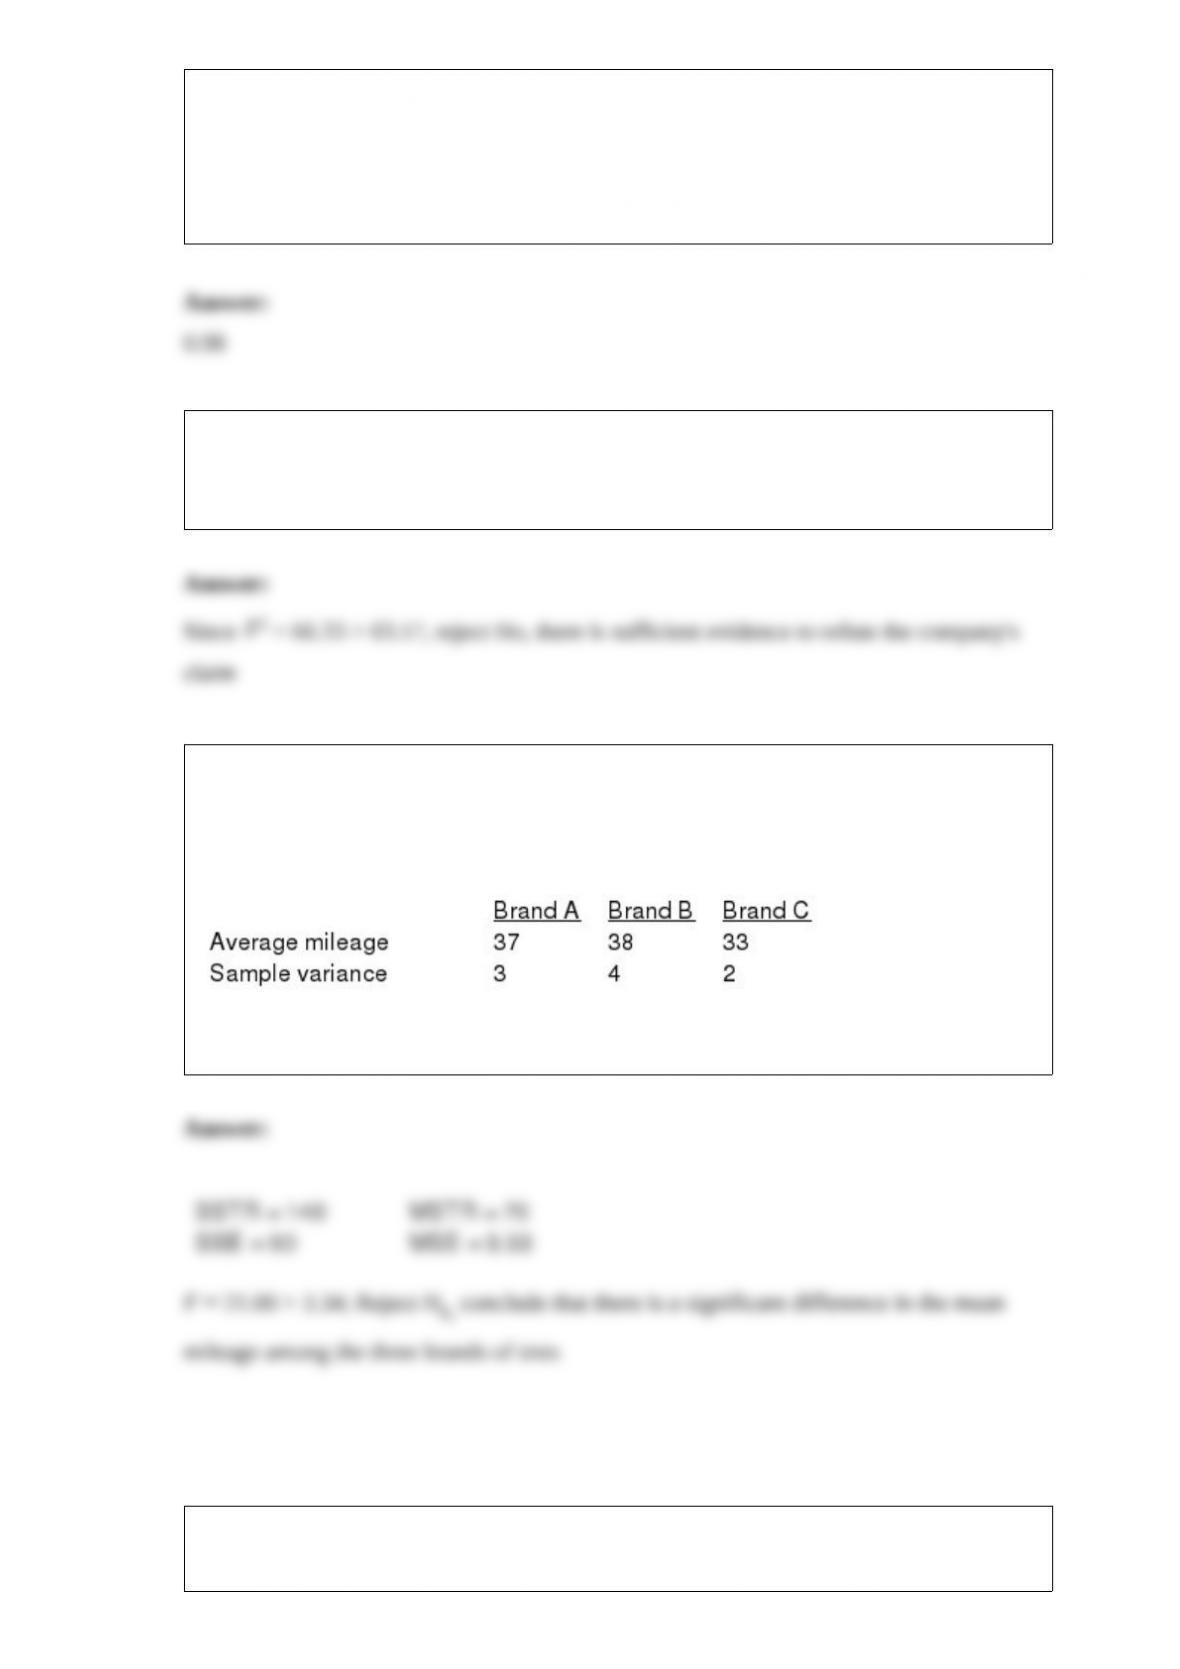
Three different brands of tires were compared for wear characteristics. For each brand
of tire, ten tires were randomly selected and subjected to standard wear testing
procedures. The average mileage obtained for each brand of tire and sample standard
deviations (both in 1000 miles) are shown below.
Use the above data and test to see if the mean mileage for all three brands of tires is the
same. Let Alpha = 0.05.
Guitars R. US has three stores located in three different areas. Random samples of the
sales of the three stores (in $1000) are shown below:

At a 5% level of significance, test to see if there is a significant difference in the
average sales of the three stores. (Please note that the sample sizes are not equal.)
In a random sample of 200 Republicans, 160 opposed the new tax laws. While in a
sample of 120 Democrats, 84 opposed the new tax laws. Determine a 95% confidence
interval estimate for the difference between the proportions of Republicans and
Democrats opposed to this new law.
In testing for the equality of k population means, the number of treatments is
a. k
b. k – 1
c. nT
d. nT – k

Exhibit 17-5
State Division of Motor Vehicles (DMV) statistics show the rate of new driver’s license
applications to be as shown below:
Refer to Exhibit 17-5. Using weights of .6, .3, and .1, what is the 3-week weighted
moving average forecast for April, week 1?
203.50
207.20
209.30
212.90